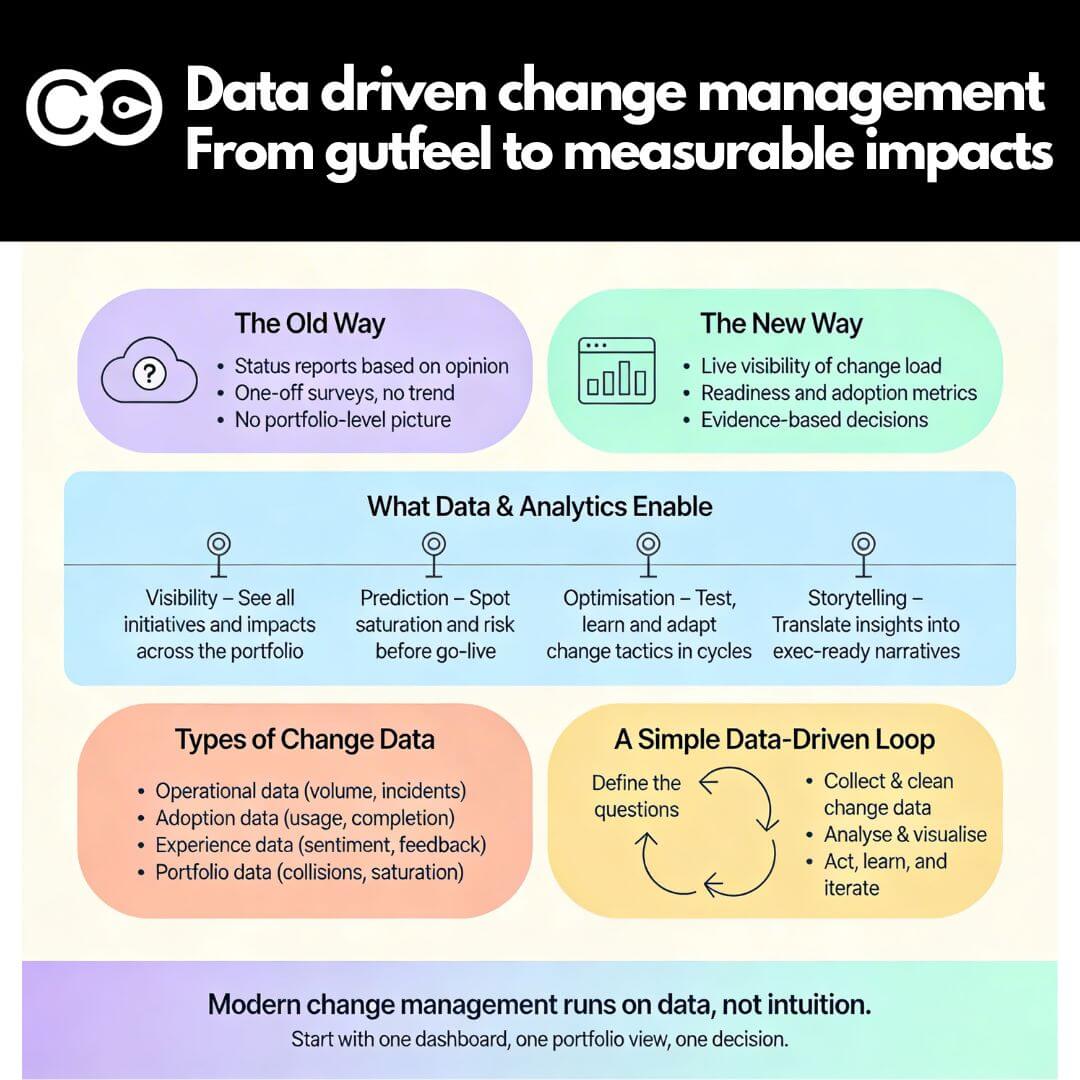
As digital acceleration and stakeholder scrutiny intensify, change leaders can no longer rely on gut feelings or generic feedback. The discipline is undergoing a seismic shift—from qualitative storytelling to quantifiable impact. Here’s why measurement is now the backbone of successful change, and how to avoid becoming another cautionary tale.
🔍 Why Measurement Is No Longer Optional
1. Executives Demand ROI—Not Just Happy Sheets
Gone are the days when a well-crafted communication plan sufficed. Today’s leaders expect change teams to demonstrate their impact with hard evidence. The Change Management Institute’s Competency Model sets a global benchmark for what effective change looks like, emphasising clusters of behaviours and skills that drive real results at every level—Foundation, Specialist, and Master. For example, the “Facilitating Change” competency requires practitioners to correctly assess readiness, build targeted plans, and conduct regular reviews—each step lending itself to clear, actionable measurement.
Action Step:
Map your change KPIs directly to the behavioural competencies outlined by the Change Management Institute. If your goal is to build readiness, track metrics such as pre- and post-training confidence scores, participation rates in workshops, and the frequency of feedback loops. For communication effectiveness, measure open rates, click-throughs, and qualitative feedback from impacted teams.
2. The Agile Imperative: Iterate or Stagnate
Agile methodologies are reshaping change management. Teams using iterative feedback loops—such as regular check-ins and rapid data reviews—report faster adoption and more sustainable results. The Competency Model encourages change professionals to adapt approaches based on real-time data, ensuring that interventions remain relevant and effective.
3. AI and Analytics: From Guesswork to Precision
AI tools now predict resistance risks, automate sentiment analysis, and personalise communications. For instance, machine learning models can be used to flag teams likely to struggle with a new CRM system based on historical adoption patterns.
📊 Change Management’s Data Evolution vs. Other Disciplines
| Aspect | Change Management (Past → Emerging) | Marketing (Past → Emerging) | HR (Past → Emerging) | Strategy (Past → Emerging) |
| Success Metrics | Past: Activity-based (e.g., training delivered, comms sent) Emerging: Behavioural & adoption metrics, business/adoption outcomes, benefit realisation | Past: Campaign outputs (impressions, reach) Emerging: Customer journey analytics, engagement, ROI, conversion rates | Past: Compliance, headcount, turnover Emerging: Employee experience, engagement, sentiment, skill adoption | Past: Plan completion, milestone delivery Emerging: Strategic alignment, market impact, agility, realised value |
| Tools & Data | Past: Surveys, anecdotal feedback Emerging: Dashboards, real-time data, sentiment analysis, portfolio risk maps | Past: CRM reports, basic analytics Emerging: Multi-channel attribution, AI-driven insights, customer sentiment mapping | Past: Annual reviews, static reports Emerging: Continuous feedback, people analytics, pulse surveys | Past: SWOT, static KPIs Emerging: Dynamic dashboards, scenario modelling, real-time performance tracking |
| Stakeholder Engagement | Past: One-way comms, generic training Emerging: Personalised, iterative, feedback-driven, co-creation | Past: Mass messaging Emerging: Personalised content, community building, omnichannel engagement | Past: Policy-driven, top-down Emerging: Employee voice, co-design, change champions | Past: Boardroom-centric Emerging: Cross-functional, iterative, stakeholder-informed |
| Measurement Frequency | Past: End-of-project reviews, one-off surveys Emerging: Continuous, real-time, iterative measurement | Past: Post-campaign analysis Emerging: Ongoing, A/B testing, real-time optimisation | Past: Annual/quarterly Emerging: Monthly, ongoing, just-in-time | Past: Annual or quarterly Emerging: Rolling reviews, fast pivots |
🛠️ Practical Playbook: Start Measuring Like a Pro
Step 1: Define “Success” with Surgical Precision
- Bad Example: “Improve employee morale during ERP rollout.”. This is overly generic and it is difficult to isolate purely project factors.
- Good Example: “Achieve 80% proficiency in the new system within 3 months, reducing help desk tickets by 50%.”
Step 2: Borrow from Agile—Build a Measurement Sprint Plan
- Week 1: Baseline survey (current proficiency levels).
- Week 2: Pilot training + daily feedback loops.
- Week 3: Adjust modules based on pain points.
- Week 4: Measure proficiency gains and correlate with productivity data.
Step 3: Visualise Progress
Use tools like Miro, Power BI or Change Automator to create:
- Adoption Roadmaps: Colour-coded timelines showing team readiness.
- Sentiment Heatmaps: Identify departments needing extra support.
From Data to Action: The New Rules of Change Management You Can’t Afford to Ignore
Yesterday’s change playbooks are gathering dust. Today, the most effective change leaders are embracing cutting-edge tools and mindsets—think AI-driven insights, hyper-personalisation, and visual storytelling. These aren’t just buzzwords; they’re practical shifts you can harness right now to drive measurable, people-focused results.
1️. AI-Powered Insights: Predict, Don’t Just React
Why It Matters:
AI is rapidly moving from the IT department into the heart of change management. Modern AI tools can analyse vast amounts of communication and performance data to identify patterns that signal potential resistance or readiness for change. By leveraging predictive analytics, change teams can proactively address issues—such as resistance hotspots or engagement gaps—before they escalate and derail a project.
Instead of waiting for problems to surface, AI-powered dashboards and sentiment analysis provide real-time feedback, allowing change practitioners to tailor communications, adjust training, and allocate resources where they’re needed most. This proactive approach not only streamlines decision-making but also accelerates adoption and supports more sustainable outcomes.
How to Apply Today:
- Use AI-based sentiment analysis tools to monitor employee feedback and flag emerging concerns.
- Segment audiences and personalise communications based on data-driven insights, ensuring the right message reaches the right people at the right time.
- Automate routine change management tasks, freeing up your team to focus on strategic interventions and stakeholder engagement.
Real-World Example:
A financial services organisation used Change Automator to map employee sentiment across a portfolio of digital projects. By visualising hotspots, they reallocated resources to struggling teams, lifting overall adoption.
2️. Employee-Centric Design: Make Change Personal
Why It Matters:
Generic change comms are out. Employees expect tailored, relevant experiences—mirroring what they get as consumers.
How to Apply Today:
- Map the Employee Journey: Use journey mapping tools to chart every touchpoint, from initial announcement to post-launch support.
- Co-Create Solutions: Run design sprints with front-line staff change champions to surface real pain points and co-design fixes.
- Micro-Target Messaging: Swap “all-staff” emails for role-specific updates—e.g., “Here’s how the new system changes your workflow, Sarah.”
Practical Tip:
Start with a single pilot group. Test different message formats (video, infographic, FAQ) and measure which drives the most engagement. Scale up what works.
3️. Visual Storytelling: Make Data Unmissable
Why It Matters:
Humans process visuals significantly faster than text. Yet, too many change reports are buried in spreadsheets. Visual dashboards, infographics, and storyboards make progress—and problems—impossible to ignore.
How to Apply Today:
- Build a Change Portfolio Dashboard: Use tools such as Change Compass to show every initiative’s impact, readiness, adoption and risk on one screen.
- Create “Before & After” Maps: Visually chart how roles, processes, or systems are changing—helping staff see what’s coming and why it matters.
- Share Wins Visually: Celebrate milestones with progress bars, leaderboards, or “heat maps” of adoption.
4️. Change Portfolio Management: See the Forest, Not Just the Trees
Why It Matters:
With overlapping projects, employees often face “initiative overload.” To read more about this check out The Change Compass blogs on Change Portfolio Management.
How to Apply Today:
- Map All Changes: List every active and upcoming initiative in a single portfolio view.
- Spot Clashes Early: Use visual tools to identify timing conflicts or resource bottlenecks.
- Balance the Load: Adjust rollout schedules to avoid overwhelming any one team.
Action Step:
Hold a monthly “change portfolio review” with business leaders. Use your dashboard to make data-driven decisions about sequencing and support.
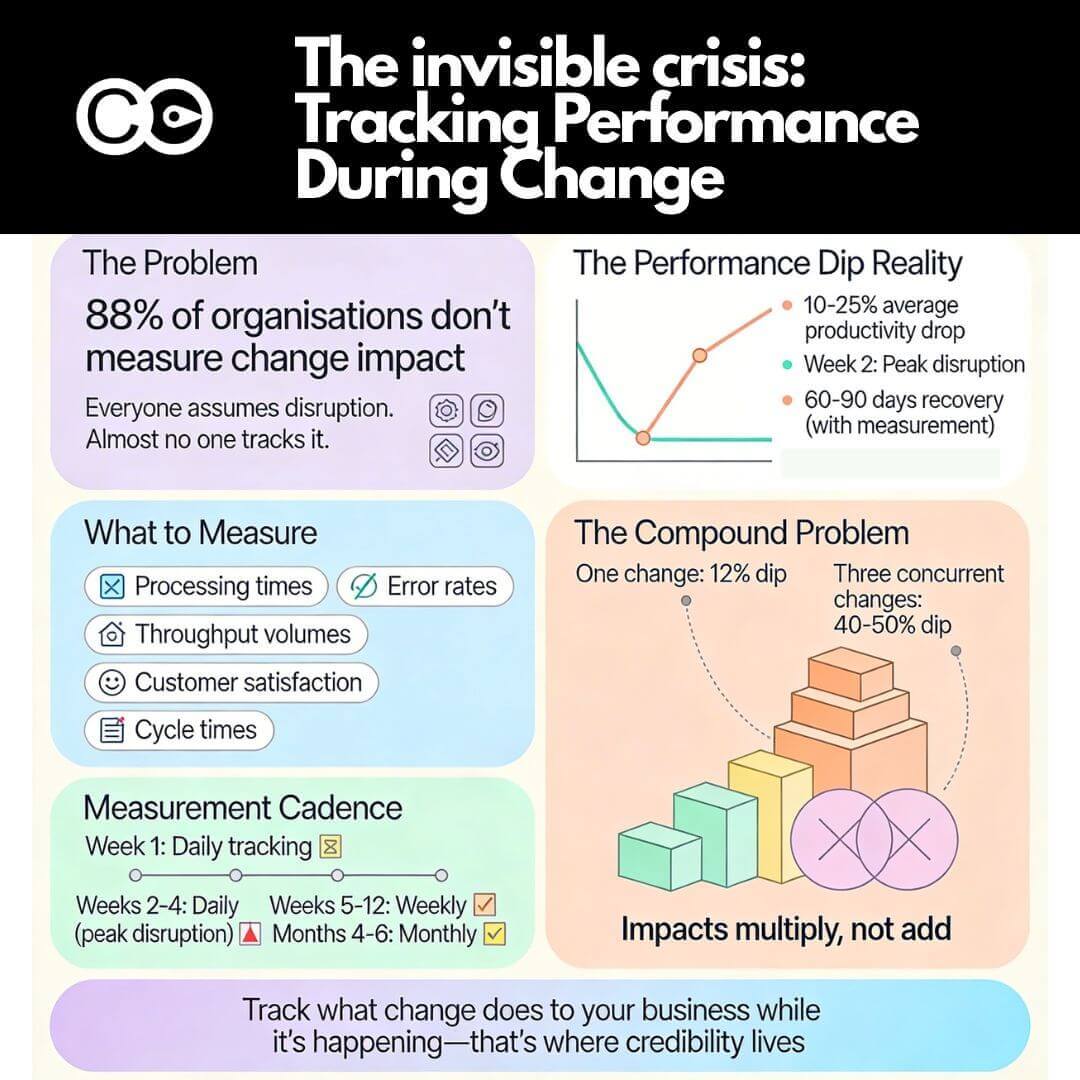
5️. Continuous Feedback Loops: Measure, Act, Repeat
One-off surveys and end-of-project reviews often miss the mark. Today’s leading organisations are moving towards ongoing, real-time feedback to spot issues early, adapt quickly, and keep change on track. Continuous feedback loops allow you to capture employee sentiment, adoption barriers, and training gaps as they arise—making your change program more responsive and resilient.
How to Apply Today:
- Run regular pulse checks: Use short, targeted surveys after key milestones or training sessions to gauge understanding and readiness.
- Empower rapid response: Assign change champions or team leads to monitor feedback and act on it quickly—whether that means clarifying communications, offering extra coaching, or removing roadblocks.
- Close the loop: Always share back what you’ve learned and what actions you’re taking as a result. This builds trust and shows that feedback leads to real improvements.
Practical Tip:
Set up a simple feedback calendar—weekly or fortnightly—so your team knows when to expect check-ins. Use tools like Microsoft Forms, The Change Compass, or even a quick stand-up meeting to keep the feedback flowing.
🏆 Quick Reference: Emerging Trends & How to Action Them
| Trend | What to Do Now |
| AI & Analytics | Deploy sentiment tools, automate reporting |
| Employee-Centric Design | Map journeys, personalise comms, co-create solutions |
| Visual Storytelling | Build dashboards, use infographics, share visual wins |
| Portfolio Management | Map all changes, review monthly, balance the load |
| Continuous Feedback | Run pulse checks, act fast, close the loop |
Stop Guessing, Start Measuring: Your 7-Step Blueprint for Change Management Success
You’ve seen why measurement is now mission-critical and how the smartest organisations are using data, AI, and design thinking to get ahead. But how do you actually put this into practice—without getting bogged down in theory or drowning in dashboards? Here’s a hands-on, step-by-step playbook you can use right now to make your change program measurable, actionable, and impossible to ignore.
1️. Get Crystal Clear on What Success Looks Like
Problem:
Vague goals (“increase engagement”, “improve adoption”) lead to fuzzy results. If you can’t measure it, you can’t manage it.
Action:
- Work with sponsors and business owners to define outcomes in hard numbers.
- Instead of “increase system usage”, set: “90% of frontline staff log into the new CRM daily within 3 weeks.”
- For behaviour change: “Reduce manual workarounds by 70% in 3 months.”
- Align these metrics to broader business KPIs.
- If your company’s focus is customer satisfaction, link your change metrics to NPS or customer complaint rates.
2️. Map Your Change Portfolio—See the Whole Picture
Problem:
Change fatigue and initiative overload are real. Siloed projects compete for attention, causing confusion and burnout.
Action:
- List every change initiative impacting your people in the next 6–12 months.
- Use a simple spreadsheet or an automated tool like The Change Compass to visualise overlaps and pinch points.
- Create a high level “heat map” of change impacts by team, location, or role.
- Colour-code by intensity.
- Share this map with leaders to adjust timing and resource allocation.
Example:
A retail chain in NSW used a portfolio map to delay a payroll system upgrade, avoiding clashing with a major sales transformation—saving weeks of disruption.
3️. Baseline Before You Begin—Don’t Skip This Step
Problem:
You can’t prove improvement if you don’t know where you started.
Action:
- Run a short, targeted survey or use existing data to capture current state.
- For a new process: measure error rates, time to complete, or customer complaints.
- For behaviour change: use a quick pulse survey (“How confident are you using the current system?”)
- Document baseline metrics and share with your team.
Visual:
Bar chart showing “before” metrics—e.g., average call handling time pre-change.
4️. Build a Real-Time Measurement Plan—Not Just End-of-Project Reports
Problem:
Annual surveys and after-action reviews are too slow for today’s pace.
Action:
- Set up a dashboard (even a simple one in Excel or Power BI) tracking your key metrics.
- Schedule weekly or fortnightly check-ins to review progress.
- Automate data collection where possible (e.g., system usage logs, sentiment surveys).
Visual:
Screenshot of a simple dashboard tracking adoption, sentiment, and productivity.
5️. Act Fast on What the Data Tells You
Problem:
Collecting data is pointless if you don’t act on it.
Action:
- Assign a “data owner” for each metric—someone responsible for monitoring and responding (your change champions may come in handy here)
- If adoption lags, run targeted workshops or peer coaching.
- If sentiment drops, hold listening sessions and tweak communications.
- Always close the loop: tell people what you’re changing based on their feedback.
Pro Tip:
Use the “You Said, We Did” format in your updates to build trust.
6️. Celebrate, Iterate, and Scale What Works
Problem:
Wins often go unnoticed, and lessons aren’t shared.
Action:
- Visually celebrate milestones—use leaderboards, digital badges, or progress bars.
- Document what worked and what didn’t in short, shareable case studies.
- Scale successful tactics to other teams or projects.
Visual:
Photo of a “Change Champions” digital wall or leaderboard.
7️. Keep the Feedback Loop Alive—Continuous Improvement
Problem:
Change is never truly “done”—but measurement often stops too soon.
Action:
- Continue pulse checks for at least 3–6 months post-launch.
- Use insights to inform future projects and refine your change playbook.
- Share lessons learned across your change portfolio—don’t let knowledge get siloed.
📋 Quick Checklist: Your Measurement-Driven Change Program
☑️ Define clear, outcome-based metrics
☑️ Map your change portfolio and impacts
☑️ Baseline before starting
☑️ Set up real-time dashboards
☑️ Assign data owners and act quickly
☑️ Celebrate and scale what works
☑️ Keep measuring and improving
🏁 Ready to Lead the Data-Driven Change Revolution?
Don’t just talk about change—prove it, measure it, and make it stick.
Start with one project, apply these steps, and watch your credibility (and results) rise. For more practical tools, checklists, and templates, visit The Change Compass Knowledge Hub and subscribe for monthly insights tailored to Australian change leaders.
What’s the first metric you’ll measure on your next change? Share your thoughts below or connect for a discussion on resolving your change measurement problems.