

Measuring change adoption means checking, with observed data and against a pre-change baseline, whether the people affected are consistently working the new way, group by group, at fixed intervals after go-live.
Teams that measure whether the change is actually being followed meet or exceed their project objectives 76% of the time, against 24% for teams that do not, according to Prosci’s best practices research. Yet most change reporting still stops at go-live dates, training completions and a pulse survey, none of which show a single person working differently. This guide is for change, HR and transformation leaders who are asked to prove that a change has landed, and who suspect that the numbers they report are measuring effort rather than adoption. It argues that adoption is established by observed behaviour, in a defined group, over time. By the end you will have a five-step method you can apply to a system rollout, a process change or a behavioural shift: define what adoption means, choose behaviours and data you can observe, take a baseline, track at fixed intervals, and act on the gaps. If you want the list of metrics itself, read our guide to change adoption metrics; for the wider measurement picture, start with the ultimate guide to measuring change.
What adoption measurement covers, and why it earns its effort
Adoption measurement tracks whether the people affected by a change have shifted to the new ways of working that the change required, and it is separate from project delivery and from awareness. Delivery tells you the system went live on time. Awareness tells you people know about it. Adoption tells you whether the new process or tool is used consistently, whether day-to-day behaviour has visibly changed, whether the outcomes that depended on the change are appearing, and whether workarounds have disappeared. Because adoption can decay once launch support fades, it needs measurement after go-live, not only at it.
The gap between those layers is large in practice. A 2025 Gartner survey of business leaders found that only 32% said the last change they led achieved healthy adoption by employees. That is the population your measurement has to work for: most changes are not landing cleanly, and leaders need an early, honest read of where.
Adoption versus compliance
A group can comply without adopting. Compliance means doing the required thing because it is required or watched; adoption means doing it because it has become the normal way of working. Staff who only comply revert when oversight eases, which is why the measurement window must extend past the end of hypercare and not stop when the project team rolls off.
Why it is worth the effort
Measurement is the nearest thing a change practitioner has to proof that the interventions worked. It also shows progress to the project team and to stakeholder groups, and it points leaders at the specific places that need their attention. Done well, it lets you influence the direction of the initiative, build momentum with senior stakeholders and steer the organisation toward the change objectives. It takes time, though. You need deliberate measurement design, a reliable way of collecting data and a visual that stakeholders understand at a glance, so budget for it early rather than bolting it on in the final fortnight.
Step 1: Define adoption in terms of the benefit
The first step in measuring adoption is to state, in observable terms, what people must do differently for the benefit the change was funded to deliver to appear. Work with the project manager to understand which benefits are targeted and how they will be tracked, because adoption measures that do not connect to a benefit are vanity metrics. Prosci reports that when organisations define success well and measure performance against objectives, their odds of meeting or exceeding those objectives can increase by up to 5X.
Start from the benefit
Benefit targets usually fall into three groups:
- Business success factors, such as revenue or cost targets.
- Product integration measures, such as usage rates.
- Market objectives, such as user base or revenue growth.
Some targets are harder to quantify but still matter: competitive positioning, employee relations, employee experience, employee capability and customer experience. The project manager may value benefits with payback time (the point at which cumulative cash flow turns positive), net present value or internal rate of return. Your job is not to run those models. It is to understand the targeted benefit, how it will be tracked, and which change management steps stand between the current state and the future state.
Map the benefit to steps and measures
A simple table keeps the logic visible. Here is a worked example for a new customer service system:
| Project benefit | Change steps required | Adoption measure | Baseline | Target |
|---|---|---|---|---|
| Higher customer satisfaction and productivity | Users operate the new system; use new features in customer conversations; managers coach and give feedback | % of users passing the proficiency test; feature usage rate; user feedback on manager coaching | Set before go-live | Agreed with the project manager |
| Faster resolution | Users proactively apply new features to drive conversations | Customer issue resolution time; call-handling capacity | Current average | Agreed target |
| Benefit visibility | Monthly benefit tracking shared in team meetings; customer communication about the improved process | Customer satisfaction score; call volume handled | Current score | Agreed target |
Fill in baseline and target for every row before go-live. A measure with no baseline cannot show movement, and a measure with no target cannot show success. Which indicators sit best in each row is a question for the adoption metrics guide; for concrete examples, see our change management adoption metric examples.
Step 2: Choose behaviours and data you can observe
The second step is to select the behaviours that evidence adoption and to pair each with an objective data source, because what people do is a firmer signal than what they say. Prosci’s ERP research draws the line sharply: activity metrics such as training completion and communications sent help manage delivery, while steering metrics, such as whether employees can complete critical transactions independently, show whether the change is working. In that research, organisations with strong metrics were 2.5 times more likely to exceed expectations for their ERP programmes, and those with poor metrics succeeded only 7% of the time, against 26% for organisations with no formal metrics.
Look past training completion and readiness
Most practitioners measure what is easy: stakeholder perceptions, readiness and training completion. These have value, but they are forward-looking indications that adoption is on its way, not adoption itself. Be wary of vanity metrics that look good and are simple to explain but do not connect to business outcomes; our piece on the problem with change management metrics covers the common traps. For readiness data, see this strategic view of readiness assessment. To measure adoption itself, look for system usage, behaviour change, correct use of the new process, or the achievement of cost or service targets, with particular attention to early adopters.
Pick observable behaviours
Most changes involve behaviour change, whether it is a different way of operating a system, new steps in a process or a new conversation with a customer. These tips keep the selection practical:
- Make it observable. A behaviour is something another person can see or a system can record. Thoughts and attitudes are not behaviours.
- Choose the right grain. Clicking a button is too fine to be worth tracking. “Proactively understands customer concerns” is too broad to rate. “Asks about the customer’s needs in the three agreed areas during each interaction” works.
- Find the trigger. Behaviours usually follow a cue, such as a customer saying “not happy”, which should start the new complaints process. Name the trigger and you can measure the response.
- Limit the count. Too many behaviours create extra work for the project team; too few cannot evidence the benefit.
Break broad behaviours into micro-behaviours
Behaviour change can feel elusive. Micro-behaviours make it practical: small, specific, observable steps rather than a cluster of behaviours. A broad aim such as “build customer rapport” becomes four measurable actions: use the customer’s name (“Is it OK if I call you Michelle?”), open with a short check-in (“How has your day been?”), reflect the customer’s feeling (“It sounds like that was frustrating”), and agree the next step (“Would it help if I escalate this for you?”). Each can be rated yes or no from call listening or case sampling. For the fuller picture of measuring and driving behaviour change, see our ultimate guide to behaviour change.
Rank your data sources
Prefer sources in this order: system logs and records, process audits and quality data, sampled observation by managers, then self-reported surveys. Surveys are useful to explain why a group is lagging, not to prove that it has adopted.
Steps 3 and 4: Take a baseline, then track at fixed intervals
Adoption is measured as movement from a known starting point, so record current performance on every chosen indicator before go-live, then re-measure at consistent intervals after it, commonly at 30, 60 and 90 days. Report each stakeholder group separately, not as one blended average, because an average of 80% can hide a team stuck at 30%. Gallup’s May 2026 tracking of AI use shows why the curve matters: 15% of US employees use AI daily, 30% use it a few times a week or more, and 52% use it a few times a year or more. Experimenting is widespread; regular use is not. A single reading would have called that a success or a failure depending on the line you drew.
Expect an S-curve, not a change curve
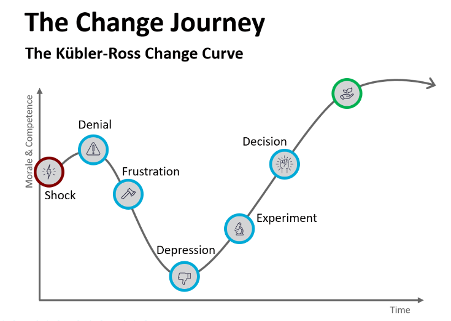
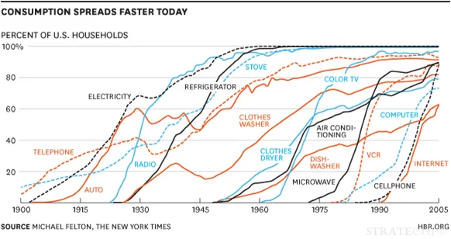
The most popular chart in change management, the Kubler-Ross change curve, was built to describe how terminally ill patients cope with dying. A 2025 review in the Journal of Organizational Change Management traces its path into workplaces and notes that empirical support for a universal sequence of stages in organisations is limited. Treat any model that is simple and intuitively right with care: it can steer you away from stakeholders’ real input, which is often where the best ideas sit. For measuring adoption, the more defensible shape is the S-curve, familiar from technology and new-product adoption. It starts slowly, climbs steeply as the majority joins, then flattens. Our World in Data’s chart of US household technology adoption shows the same shape across a century of technologies.
The curve’s steepness depends on the change:
- Minor process change. A small step from the current process gives a gentle curve, reached quickly.
- Complex new technology. A long, shallow start and a late climb are normal.
- Iterative or agile change. Each release that touches users is a small S-curve of its own, and the releases should add up to a larger one.
The familiar adoption categories (innovators, early adopters, early majority, late majority and laggards) are useful here for targeting. Support that suits innovators does not suit late majority groups, so tailor your communication and help by where each group sits, and watch the early adopters first, since they signal whether the main wave will follow.
Set the interval schedule
As a working guide, simple process changes often stabilise within 30 to 60 days, significant system or behavioural changes within 90 to 180 days, and cultural or leadership changes can take a year or more. These are planning ranges from practice, not benchmarks, so confirm them against a pilot group before you commit leaders to a date.
Step 5: Report, diagnose and act
Measurement only changes outcomes when the right people see it on a rhythm and respond to it. Gallup finds that employees whose managers actively support AI use are 1.7 times as likely to use it a few times a week or more, yet only 36% of employees in AI-integrating organisations strongly agree their manager does. Managers are therefore part of the audience for your reporting, not only the executives who own the benefit.
Design the reporting routine
Plan the reporting process once the measures are set. These are the main considerations:
- Make reporting easy. Automate collection wherever possible, using in-app data and tools, so the burden stays low and the cadence survives busy periods.
- Set contribution expectations. Get stakeholder support so it is clear who supplies which data, and when.
- Make the dashboard readable. Design for quick understanding. Our guide to designing a change adoption dashboard and the reports executives want to see cover layout and audience.
- Build reinforcement. If a measure relies on people’s input, such as a survey, design a reason for them to respond. Without one, response rates drop.
- Choose recipients deliberately. Include the business leaders who own the benefit and the middle and first-line managers who shape daily behaviour.
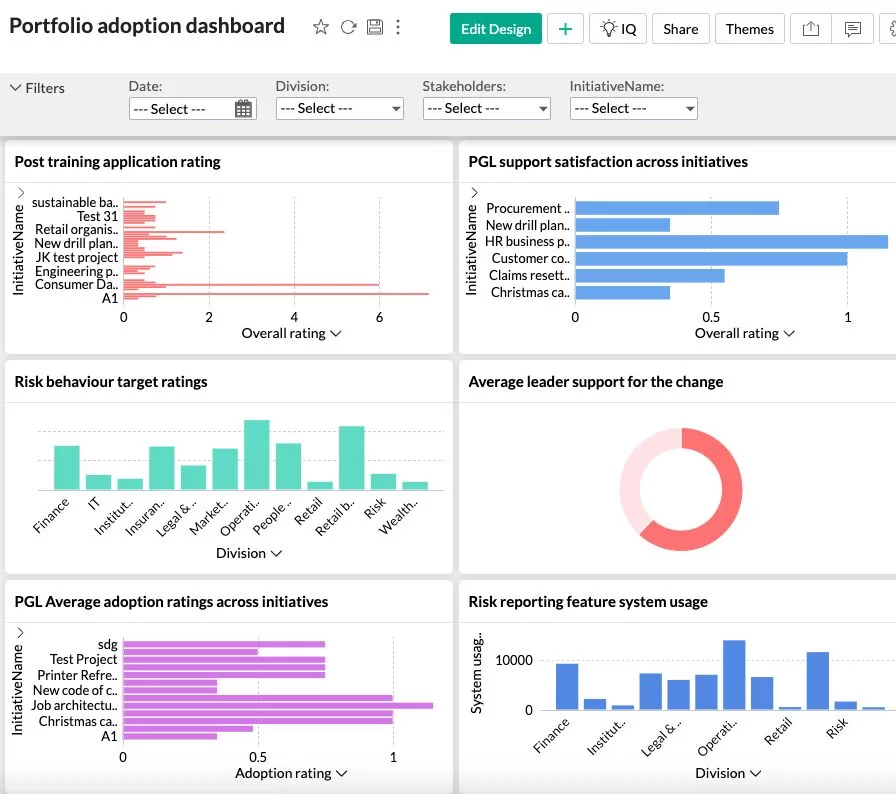
Example of change adoption dashboard from Change Automator
Diagnose before you intervene
When a group lags, work out which of three gaps explains it, because each has a different fix:
- Awareness gap. People do not know what is changing or why. Communicate more clearly and more often.
- Capability gap. People know, but cannot yet do it. Add training, practice or hands-on support in the specific tasks that fail.
- Motivation gap. People can, but are not choosing to. Look to manager engagement, incentives and removal of the old way of working.
Then track whether the intervention moved the number at the next interval. That closes the loop that most change reporting leaves open.
Measuring adoption across several initiatives
Comparing adoption across initiatives needs a common scale, even though each initiative defines adoption differently. If you run a programme or portfolio, three common ways to report are the overall percentage of identified adoption elements achieved, the percentage of milestones reached, and the share of the target population showing the behaviour, supported by manager reports and system utilisation records. These give like-for-like comparison without forcing every initiative onto one definition.
Portfolio measurement also shows something single-initiative reporting cannot: which teams are absorbing several changes at once, and which interventions lead to higher adoption across the whole portfolio. For the strategic angle, see how to align multiple initiatives for maximum benefit realisation.
Where digital tools fit
Manual adoption tracking in spreadsheets works for one initiative and breaks down at portfolio scale. Digital platforms such as The Change Compass collect adoption data in the flow of work, report it by group and initiative, and show which change interventions are associated with higher adoption. Whatever tool you choose, apply the same five steps: the tool automates collection and reporting, but the definition, the behaviours and the baseline are still yours to set.
Start with one change and one baseline
Pick the change you are most worried about, and write down in one sentence what a person would be doing differently if it had worked. Choose three observable behaviours, find the data source for each, and take a baseline this week, before the next milestone gives you a reason to postpone it. Then book the 30, 60 and 90-day readings in the diary and agree who will see them. A rough baseline taken now is worth more than a polished one taken after go-live, and it gives you the one thing leaders rarely get from change reporting: evidence of movement they can trust. When you are ready to choose indicators for each behaviour, the adoption metrics guide is the next step, and the ultimate guide to measuring change puts it in context.
Frequently asked questions
How do you measure change adoption step by step?
Define what adoption looks like in observable terms, choose the behaviours and data sources that show it, record a baseline before the change, track each affected group at fixed intervals after go-live (commonly 30, 60 and 90 days), and use the gaps to trigger targeted action. Report by group rather than as one average, so lagging teams are visible.
What is the difference between change adoption and change compliance?
Compliance is doing the required thing because it is required or observed. Adoption is doing the new thing consistently because it has become the normal way of working. Employees who comply without adopting tend to revert when oversight eases, so measure behaviour again after support is withdrawn, not only at go-live.
How long does change adoption take?
As a working guide, simple process changes often stabilise within 30 to 60 days of go-live, significant system or behavioural changes within 90 to 180 days, and cultural or leadership changes can take 12 to 24 months or more. These are planning ranges drawn from practice, not research benchmarks, so set your own expected curve from a baseline and a pilot group.
How do you measure adoption when there is no system data?
Use observed behaviour instead of opinion: manager observation checklists, call or case sampling, process audits, and downstream quality or cycle-time data. Break the change into small observable micro-behaviours that can be rated yes or no, and sample a consistent number of cases per group at each interval. Use surveys to explain a gap, not to prove adoption.
How do you compare adoption across several change initiatives?
Define adoption separately for each initiative, then report on a common scale: the percentage of identified adoption elements achieved, the percentage of milestones reached, and the share of the target population showing the behaviour. This lets you compare like with like across a portfolio, and spot where several changes are landing on the same teams at once.
References
- Prosci. Metrics for Measuring Change Management (12th edition Best Practices research; updated August 2026).
- Prosci. Change Management Success.
- Prosci. Built To Change: Measuring what actually predicts ERP success (August 2026).
- Gartner. Gartner HR Research Finds Just 32% of Business Leaders Report Achieving Healthy Change Adoption by Employees (8 July 2025).
- Gallup. Indicator: Artificial Intelligence (data as of May 2026).
- Journal of Organizational Change Management (2025). From coping with dying to coping with organizational change: the bricolage of the change curve’s evolution.
- Our World in Data. Share of United States households using specific technologies.