Enterprise change management reporting is changing. In today’s dynamic business environment, it no longer consists of general updates on organisational change management efforts, change leaders, streams of project progress, or updates on various change capability training session volumes and satisfaction rates. Executives are demanding more value from enterprise change functions that incorporate change management practices and digital transformation, leveraging new tools. The pace of change since Covid has not slowed down. For many, it has increased in pace and volume. To gain better insight into how the change management function is supporting the success of organisations, reports and dashboards have often become a visible linchpin of what value enterprise change management delivers.
What is enterprise change management and why is it important?
Enterprise change management refers to the structured approach organizations use to manage the people side of change in organizational change management, including the types of organizational change in processes, systems, and personnel across an entire organization, while integrating risk management principles. It’s crucial for minimizing disruption, ensuring smooth transitions, and enhancing employee engagement. Effective change management fosters resilience, boosts productivity, and aligns teams with organizational goals for sustained success.
What is enterprise change management and why is it important?
Enterprise change management refers to the structured approach organizations use to manage changes in processes, technologies, and organizational structures, including various type of change efforts that relate to the levels of change management. It’s crucial for minimizing resistance and ensuring smooth transitions. Effective change management enhances employee engagement, drives project success, and fosters a culture of adaptability within the organization.
Having the right content and format for your enterprise reports can make or break your reputation in the realm of information technology. Do it right and you could start a ripple of high-impact and strategic conversations across senior stakeholders that drive focus on improving change. You can be in the spotlight in influencing change leadership and the achievement of change and transformation goals. Do it wrong and you may never have another opportunity to have the room to talk about change management to senior leaders. You may be associated with not providing much value and too ‘operational’.
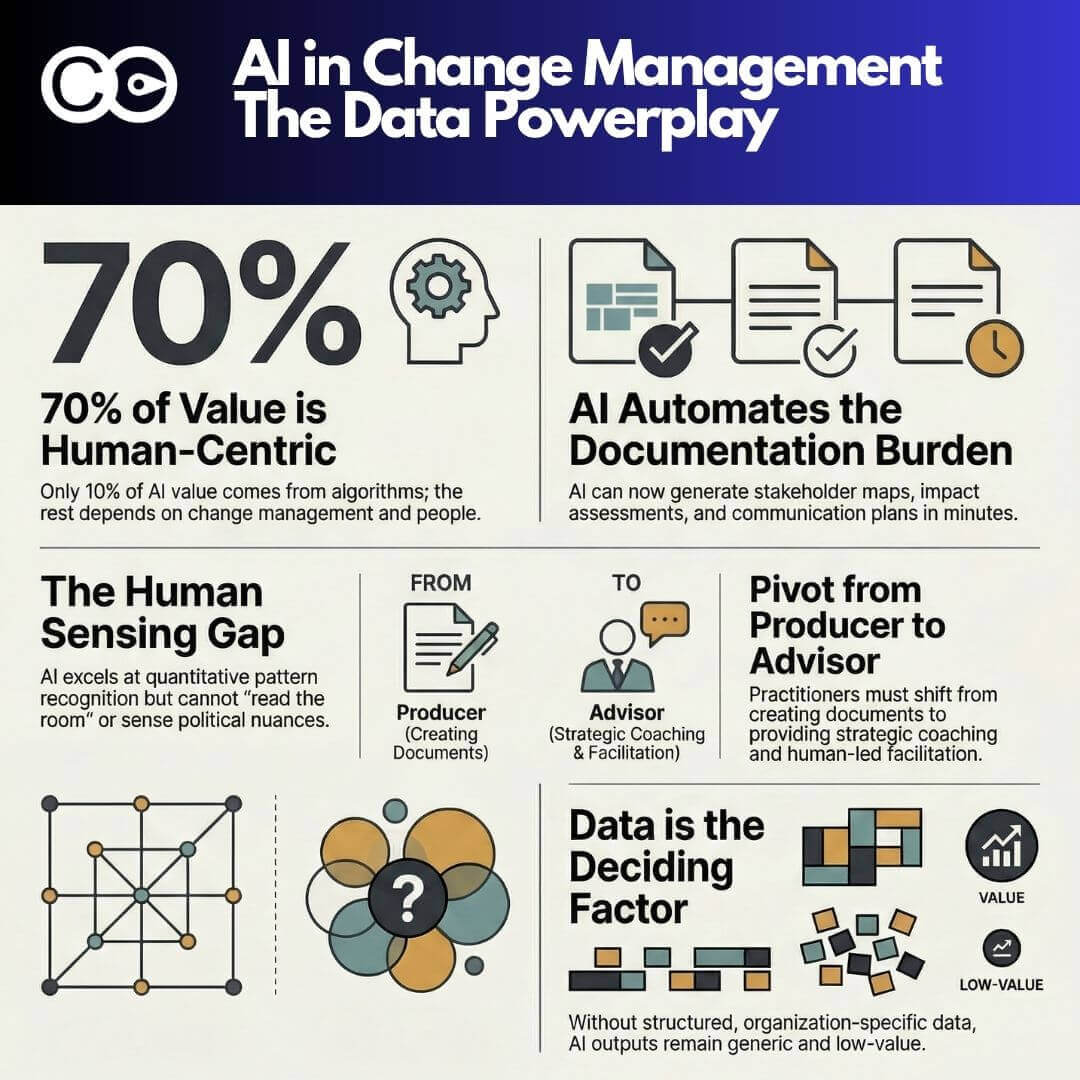
At its core, enterprise change management reporting goes beyond merely tracking progress. It encompasses a holistic approach that considers various factors crucial to the success of organizational initiatives. While monitoring progress, readiness, and the amount of work done may be interesting components, true impact comes from focusing on impacts, adoption and predictors for benefit realization.
Executives and stakeholders are not just interested in receiving progress updates; they seek insights into the likelihood of initiative success and the potential risks that may impede desired outcomes. These risks extend beyond project timelines and budget constraints to encompass broader business implications such as performance impacts, capacity constraints, prioritization effectiveness, and the sustainability of behavioural change.
Impacts of change:
Quantifying and visualising impacts are not new to change practitioners. The key is how the data is presented over time. A lot of change practitioners would settle with a standard heatmap based on personal ratings. This does not deliver much value as the data cannot be easily substantiated by evidence (since it is more of a finger in the air estimation). Standard heatmaps also are too high level and does not really support key decision making.
Decision making requires specific data points such as:
- Change saturation or change tolerance levels (these levels need to be substantiated based on business indicator reference to justify the levels, and not be someone’s personal opinion)
- What division, team, role and which week the saturation points are forecasted
- Corresponding data on what initiatives, and their respective impact activities that contribute to the saturation risk, and therefore proposed options
A key part of representing change impacts should not just be at an operational level, which is more concerned about capacity and bandwidth. Impact should also be tied to strategic levers, portfolio types, benefit types and readiness.
Predictive Indicators for Success:
To create impactful change management reports, organizations must incorporate predictive indicators that go beyond change volume and risk assessment. These indicators should provide insights into business performance, strategy achievement, and the realization of intended benefits.
These are some of the ways you can incorporate predictive indicators:
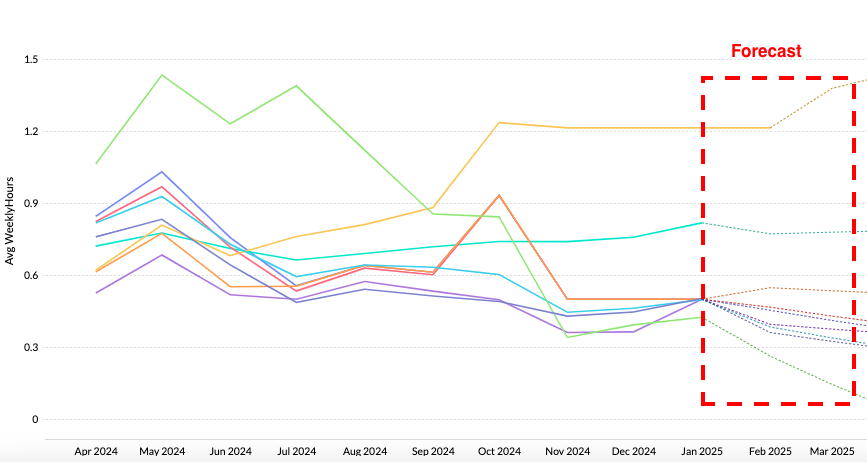
- Forecast lines. With sufficient data you can forecast such as impact or capacity levels (which may be seasonal), or even readiness levels across the initiative lifecycle historically across initiatives.
- The types of factors that can be included as predictive indicators can include readiness. It could be that readiness levels only get lifted just before go live or at go live. Adoption levels can also be forecasted if you have trend data across initiatives
- Change tolerance levels across different parts of the business can also be seen as a predictive way of forecasting how much capacity there is for change beyond which saturation may be a key risk
Adoption and Behaviour Tracking:
Central to successful change management is the adoption and sustained implementation of new processes or technologies. Tracking adoption rates, user engagement, and behavioural changes are crucial indicators of initiative success. However, it’s essential to strike a balance between capturing relevant metrics and overwhelming stakeholders with unnecessary data.
Capturing behaviour change data can be key for larger initiatives or transformations. Behavioural change can be central in a range of changes such as customer centricity, efficiency, team collaboration or effectiveness. Measuring key behaviour changes that drive the initiative outcome the most is critical. For example, having effective conversations with customers to improve customer experience is a behaviour that can be rated, tracked and reported. Depending on the change, there may also be system features that can aid the tracking of these behaviours.
To read more about driving behaviour change check out The Ultimate Guide to Behaviour Change.
Business Performance and Strategy Alignment:
Effective change management goes hand in hand with strategic alignment, strategic goals, and necessary resources for strategic objectives. Reports should assess how initiatives contribute to overarching business objectives and whether they align with the rest of the organization’s strategic direction in the first place. Business leaders can utilize metrics related to revenue growth, cost savings, customer satisfaction, and employee productivity to provide valuable insights into the impact of change initiatives on business performance.
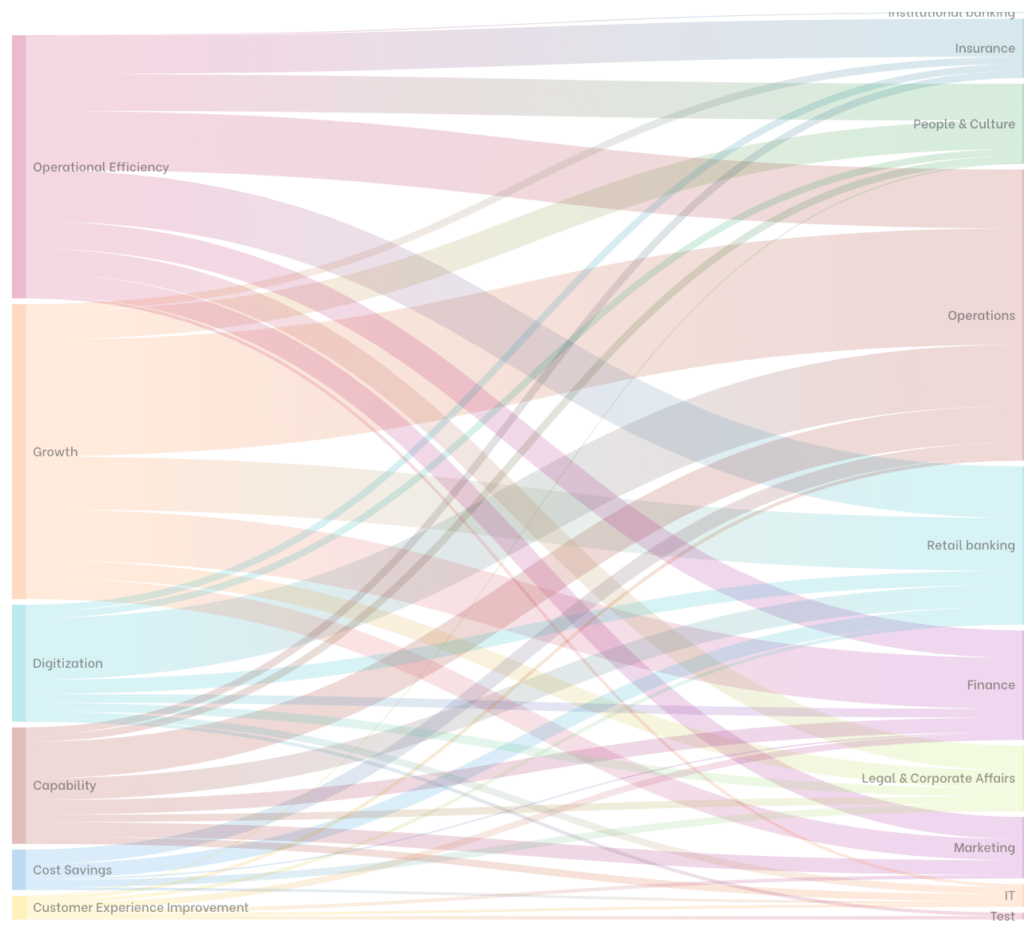
You can also link your change impacts to each strategic lever. In this way you can visually show the size of the impact per strategic lever. This will give your executives a way to examine whether the right level of impacts in the right areas of business are planned as a part of the course of each strategic lever.
The other angle is to visually show the pace of change against the strategic levers. Are certain key initiatives being driven at the right pace at the right time? Will the velocity of change exceed the ability of the business to absorb the changes? Or is the velocity not sufficiently meeting leadership expectations?
Benefit Realization:
Ultimately, the success of change initiatives is measured by their ability to deliver tangible benefits and assess the impact of the change. Change management reports should include key performance indicators (KPIs) and metrics that track the progress of change initiatives and the realization of expected benefits, whether they are financial gains, process efficiencies, or competitive advantages. By monitoring benefit realization, organizations can course-correct as needed and ensure that investments in change deliver the intended outcomes.
A key responsibility for change is to focus on those foreward looking measures that predict eventual benefit realisation, including readiness, adoption, engagement and behaviour change. Be sure to link these specifically to high benefit initiatives to provide strategic oversight.
Balancing Complexity and Clarity:
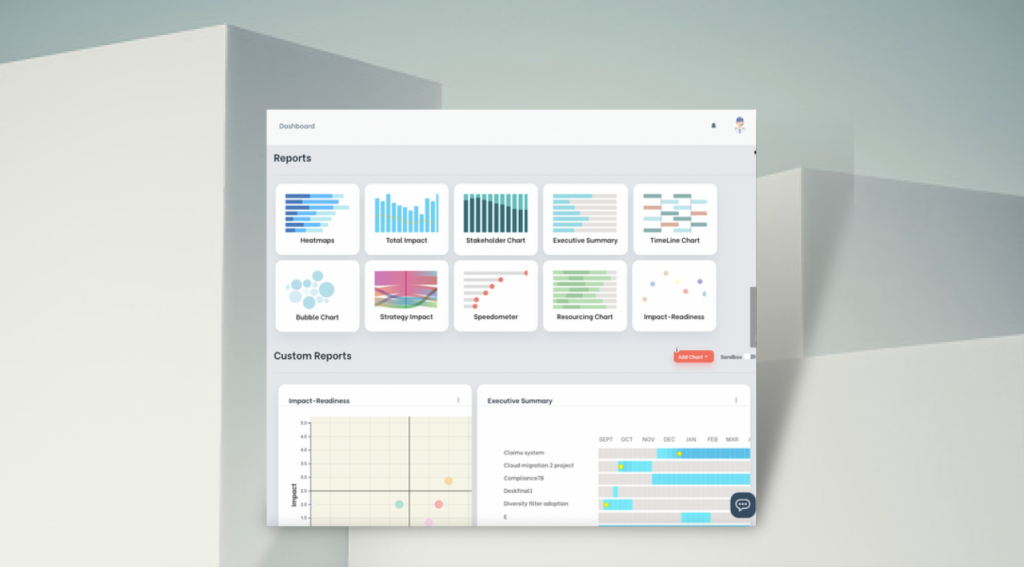
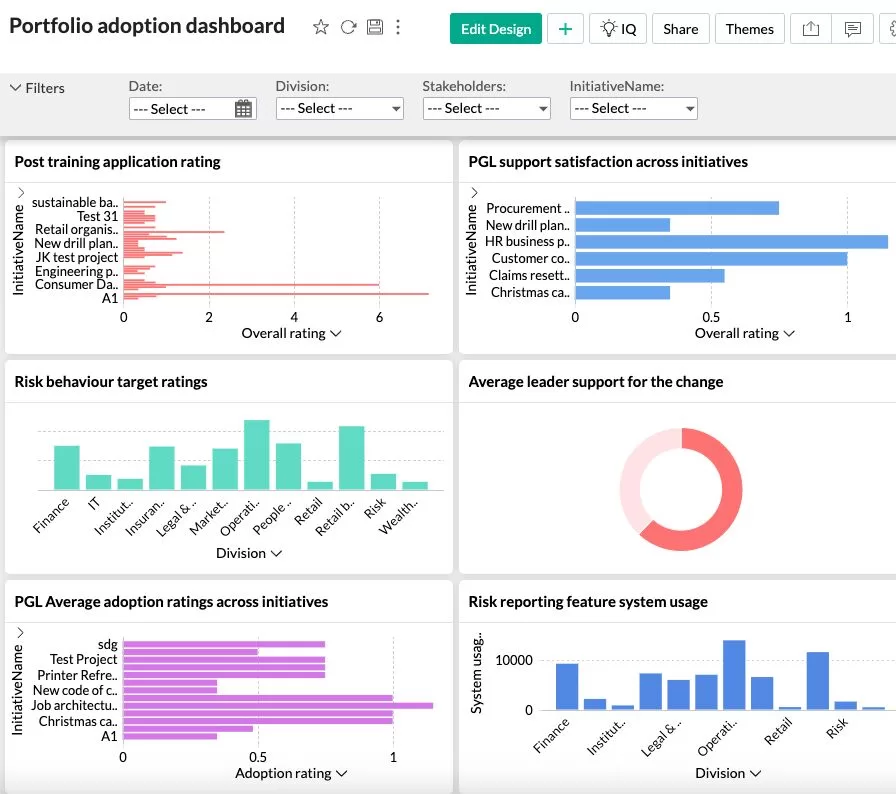
While incorporating a diverse range of metrics is essential for comprehensive reporting, it’s equally important to maintain clarity and focus. Reports should be structured in a way that highlights key insights and trends without overwhelming stakeholders with excessive detail. Visualizations such as charts, graphs, and dashboards can help distill complex data into actionable insights, facilitating informed decision-making at all levels of the organization.
All aspects of chart and dashboard designs are critical. These range from colour scheme chosen, number of charts, commentary, titles, legends, sequencing of charts, and type of charts chosen all act to either contribute to simplicity and clarity or complexity and confusion. Your narrative as you talk through the charts also plays a key role in building the story-line, and simplifying the key messages and actions you would like to impart to the audience.
Charts and dashboards tell a story and in presenting them you should always incorporate any actions required from the audience. If this is not done then it will always remain a FYI. FYI content will be deemed lower in the value curve over time and your stakeholders will lose interest. Instead, you should work on crafting a continual story that ebbs and flows. The following are key questions you should be asking when crafting you ongoing charts and dashboards:
- Is there an emerging risk or opportunity that warrants specific focus for this month?
- How are we tracking the effectiveness of stakeholder actions through data? This feedback loop is critical and gives your stakeholders a reference point for their own effectiveness
- Is your data-based story uni-dimensional? Are there other dimensions beyond what you have been presenting that stakeholder should be aware of?
- Are you giving stakeholders what they are most interested in? Whether it be strategic success progress, or benefit realisation?
- Are you presenting change data in a holistic way in terms of how the business is run? Vs. just focused on standard change management function-specific metrics such as training sessions, or number of workshops completed?
Enterprise change management reporting is a critical tool for navigating the complexities of organizational change. By focusing on predictive indicators, including adoption and behavior tracking, business performance alignment, and benefit realization, organizations can unlock the full potential of their change management initiatives. However, achieving impactful reporting requires a careful balance between complexity and clarity, ensuring that stakeholders receive actionable insights without being inundated with unnecessary information. Ultimately, by harnessing the power of enterprise change management reporting, organizations can drive successful outcomes and thrive in an ever-evolving business landscape.
To find out more about enterprise change management reporting leveraging digital automation and analytics chat to us here.
To read up more about change analytics and reporting check out our other articles.
Frequently Asked Questions
Enterprise change management reporting refers to the systematic reporting of change management data across an organisation’s full portfolio of change initiatives – not just individual programme updates. It provides leadership with visibility of the total volume and complexity of change the organisation is absorbing, the adoption performance across all major programmes, and the change capacity available to absorb further change. Enterprise reporting is the foundation of a mature, data-driven approach to change governance.
Programme-level change reports focus on the readiness, adoption, and risk status of a single change initiative. Enterprise change reports aggregate data across all programmes to show the full picture of change load, resource deployment, and adoption performance at the organisational level. Enterprise reporting answers questions that programme-level reporting cannot: which employee groups are over-saturated with change? Which programmes are competing for the same people’s attention? Is the organisation’s change capacity sufficient for the current and planned change portfolio?
Enterprise change reporting requires three types of data: change portfolio data (what changes are being delivered, to whom, and on what timeline), change impact data (the level of disruption each change creates for each affected employee group), and adoption data (the rate at which changes are being adopted across the organisation). Collecting and aggregating this data manually is extremely difficult at enterprise scale – a purpose-built change management platform is typically required to make enterprise reporting sustainable and credible.