Banks now take more than a year, on average, to fully implement a single regulatory change, and most are running several at once while modernising the technology underneath them (CUBE, Cost of Compliance Report 2025). Change management in financial services is the discipline of delivering transformation, regulatory change and legacy modernisation concurrently, inside a risk and compliance culture, by measuring adoption, operational performance and compliance risk while the change is still rolling out. This article is for transformation, change and operational risk leaders in banking, insurance, superannuation and asset management who are accountable for outcomes that boards and regulators will test. It argues that the sector’s real constraint is not appetite for change but visibility: most institutions cannot see whether a programme is landing until after go-live, when fixing it is slowest and most expensive. By the end you will be able to place your organisation on a three-level change maturity scale, make the case for agile delivery that risk and compliance will sign off, and define the five measures that replace narrative with evidence in a board pack.
Why financial services change is different
Financial services change is different because three loads land on the same people at once: continuous regulatory change, ageing technology, and a cap on how much risk any experiment may carry. Other sectors face one or two of these. Banks, insurers and super funds face all three, and each makes the others harder.
Regulatory change never finishes
Regulation in financial services does not arrive in waves with pauses between them. APRA’s Prudential Standard CPS 230 on operational risk management came into force on 1 July 2025 for authorised deposit-taking institutions, general and life insurers, private health insurers and superannuation trustees, with existing service provider contracts brought into line by the earlier of renewal or 1 July 2026 (APRA). The EU’s Digital Operational Resilience Act began applying on 17 January 2025 across 20 types of financial entity (EIOPA). In the same period CUBE logged 157 new laws and rules on AI in financial services, almost double the previous year, and 60 percent of the 2,000 compliance and risk officers it surveyed expect regulatory change costs to rise again (CUBE).
The practical effect is a permanent queue. A change team finishing one compliance programme usually inherits the next before the first has bedded in.
Legacy technology absorbs the change capacity
The second load is technology. Accenture’s 2026 banking trends report found that about 70 percent of bank IT budgets are consumed by maintenance of technical debt, and that software costs have grown by an average of 8 percent a year since 2017, outpacing revenue growth (Accenture). That leaves a small slice of investment for the modernisation that customers, regulators and shareholders are all asking for.
For change leaders the consequence is less about money than about people. Modernisation programmes often depend on the same product owners, operations teams and subject matter experts who are already carrying regulatory deadlines. Every new programme draws on a shared pool of attention that nobody is measuring.
Concurrent programmes compete for the same frontline
The third load is concurrency. A branch manager, claims assessor or relationship banker may in a single quarter absorb a CPS 230 control uplift, a new lending platform, a policy rewrite and a restructure. Each programme tracks its own readiness. Nobody tracks the total. This is the heart of the saturation problem, covered in more detail in managing change saturation, and the mix of change types behind it is mapped in financial services transformation: eight core types.
Unlike a retailer or a manufacturer, a financial institution cannot treat a failed compliance transformation as a project miss. It carries regulatory penalties, remediation costs, customer trust and sometimes shareholder value, so the standard for evidence is higher.
The regulatory pressure cooker
Regulatory pressure shapes financial services transformation because it consumes most of the change budget and sets the sequencing of everything else. Boston Consulting Group found that banks spend 40 to 60 percent of their change budget on regulatory compliance, and that a significant part of that spend is inefficient because of sequential, waterfall delivery (BCG, When Agile Meets Regulatory Compliance, 2017). The share is the most-quoted quantification of the problem, and the 2025 data suggests the underlying dynamic has not eased.
The tension for transformation leaders
This creates a first tension that every transformation leader in the sector recognises. How do you fund modernisation when the majority of resources go to compliance? How do you hold momentum for a digital programme when a new directive resets priorities every few months? And how do you judge success when the regulatory requirement was met on time but the behaviour change that makes the control real never happened?
CUBE’s survey shows the scale of the execution gap. Fully implementing a regulatory change takes more than a year on average, 21 percent of respondents rate their regulatory change management as somewhat or highly ineffective, and only 16 percent report potential regulatory change directly to their executive team or board (CUBE via Wealth Briefing).
Compliance completion is not compliance behaviour
Institutions at lower maturity often stumble because they lack integrated visibility into how regulatory changes cascade through the transformation portfolio. They can complete a compliance programme on schedule and still have no view of downstream operational impact, adoption or whether the risk was actually remediated. A control that exists on paper but is bypassed by a manual workaround is the usual failure, and it tends to surface in an audit or an incident, not in a project status report.
More mature organisations build change tracking into their compliance processes. They separate two questions: did we deliver the control, and did people change how they work because of it? The second question is the one regulators increasingly ask, and the one the governance model for financial services is designed to answer.
The agility paradox: Risk as guardrail, not gate
Agile change management can work in a regulated bank or insurer when risk and compliance are built into every increment of delivery rather than applied as a final approval gate. The same environment that demands caution also demands speed, because regulation itself has become iterative and complex.
Why sequential projects fail against moving rules
MiFID II began as an 80-page level 1 text and expanded to more than 5,000 pages at implementation level (BCG). Sequential approaches assume the requirement is certain before build starts, and in this sector it rarely is. BCG estimated that properly governed agile delivery could reduce IT spending on compliance projects by 20 to 30 percent while improving on-time delivery.
Many boards remain sceptical, and the scepticism is not irrational. A technology firm can run experiments at speed. A fintech can pivot. A bank cannot without regulatory comfort, compliance sign-off and governance endorsement. Ironically, the rigidity designed to protect stability often produces slower time-to-market, higher cost and strategic misalignment when external conditions shift.
Making agile acceptable to the second line
The way through is to reimagine risk management, not to abandon it. Agile risk management means agile-specific risk assessments and continuous monitoring that embed compliance checks at every step, rather than at the end. In practice that means:
Risk, compliance and the business sit in the same cross-functional team from sprint zero.
Control objectives are written as acceptance criteria for each increment, so evidence is produced as work is done.
Release decisions use agreed risk thresholds rather than a single end-of-project sign-off.
Change impacts on frontline teams are assessed per release, not once at the start. The agile change management in the AI era article covers how to keep this practical.
This turns risk management from a gate into a guardrail.
From second line of defence to design partner
It also requires a cultural shift for risk and compliance functions. They must move from a second-line mindset in which they audit and approve to a design-partner mindset in which they collaborate from day one. Institutions with higher change maturity consistently do this better, because they have embedded risk and compliance perspectives into change governance from the start rather than at the approval stage.
Evidence for boards and regulators: The Change Compass shows regulatory, technology and business change landing on the same teams in one view, with the evidence boards and risk committees ask for. See how The Change Compass works or book a demo.
The cultural challenge: Risk-aversion meets innovation
Risk-averse culture is the hidden barrier in financial services transformation because the same instincts that protect customer deposits also make experimentation feel dangerous. Conservative decision-making, extensive approval chains and multiple layers of governance evolved for good reasons. They have also built institutional muscles that resist testing.
Accountability has become personal
That culture is now reinforced by regulation. Australia’s Financial Accountability Regime applies to authorised deposit-taking institutions from 15 March 2024 and to insurers and superannuation trustees from 15 March 2025, and it is designed to improve risk and governance cultures through a strengthened accountability framework for entities and their senior executives (APRA; ASIC). When an executive is personally accountable for a change outcome, appetite for visible experimentation understandably drops.
A technically excellent transformation can stall because the institution’s cultural immune system rejects change it perceives as risky. Conversely, a transformation that wins buy-in by positioning itself as low risk may lack the ambition to change anything.
Risk-aware innovation
Leading institutions create controlled experimentation frameworks, sometimes called risk-aware innovation. The pattern is consistent:
Test in a sandbox or limited cohort with defined exposure.
Set explicit guardrails and monitoring before launch.
Agree in advance what degree of failure is acceptable in pursuit of learning.
State the trade-off openly: a marginal increase in risk here to capture an opportunity there, with the mitigation named.
The transparency matters as much as the sandbox. Regulators and boards are far more comfortable with a measured, documented risk than with an undisclosed one.
Treat resistance as data, not as a communications problem
This is also where maturity differences show most clearly. Lower-maturity organisations treat cultural resistance as an engagement problem to communicate away. Mature organisations read it as a signal of misalignment between stated strategy and actual incentives, governance structures and decision rights. They use change data, such as adoption patterns, sentiment and participation, as diagnostic tools to surface those tensions and address them directly.
Change maturity: The predictor most programmes ignore
Change maturity is a stronger predictor of transformation success in financial services than budget, sponsorship or project management rigour, because it determines whether anyone can see and correct problems while the work is under way. Institutions sit on a spectrum, and the CUBE data shows why tooling alone does not move them along it: 98 percent of respondents have some automation in regulatory change management, yet 21 percent still rate their process as ineffective (CUBE). The distinguishing factor is how change data is used, not whether it exists.
The three levels
Level 1, project-centric. Change is an overlay during a project. A team is assembled, engagement campaigns run, and the team disperses at go-live. Nobody tracks whether changes stick, adoption plateaus or benefits are realised.
Level 2, governance-integrated. Change is part of project governance and practitioners are trained. Measurement is qualitative: surveys for adoption, workshop attendance for engagement, spot checks for compliance. Leaders cannot reliably tell a programme that looks on track from one that is failing without anyone saying so.
Level 3, data-driven operations. Change is a continuous operating discipline. Adoption metrics reflect behaviour, not logins. Operational performance is tracked against baseline, compliance risk is forward-looking, and financial impact is checked against business case assumptions in real time.
What Level 3 looks like in practice
The most mature institutions integrate these streams into one view that supports diagnosis, not just description. If adoption in a division is 65 percent, the question is why: a training gap, a process design flaw, misaligned incentives, cultural resistance or weak leadership communication? Each has a different fix, and a leader armed with diagnostic data can intervene precisely.
They also distinguish the expected J-curve dip, where performance falls before it improves as teams learn new processes, from structural degradation that needs action. Their capability often goes unrecognised externally. Peers see the results and attribute them to better technology or luck, when the cause is a deliberate investment in making change visible. The foundations are laid out in why change maturity matters and how to build it.
A worked example: One control uplift at three levels
Take an illustrative case: a mid-sized insurer uplifting its operational risk controls and service provider management to meet CPS 230. At Level 1, the project team documents the new controls, runs briefings for process owners and closes the programme at the regulatory date. Whether claims or procurement teams actually follow the new steps is discovered at the next internal audit. At Level 2, the team adds a readiness survey and a training completion report, which is better, but both measure intent and attendance, not behaviour.
At Level 3, the insurer tracks the control in use: how many contract renewals went through the new due diligence step, which teams still approve suppliers through the old email route, and how long the new step adds to cycle time. When one division lags, the data shows whether the cause is workload, unclear ownership or a poorly designed form. The programme closes with evidence that the control operates, which is what a supervisor will ask to see.
What boards and regulators need: Evidence, not narrative
Senior leaders and boards in financial services need operational evidence of risk and impact, not change management frameworks or engagement scores. They want to know whether the transformation is on schedule, where adoption is stalling, what the effect on operational performance is, whether compliance is at risk and what return the investment is producing. Only 16 percent of compliance and risk leaders report potential regulatory change directly to their executive team or board (CUBE via Wealth Briefing), which suggests much of this information is not reaching the people who need it.
Five measures that replace narrative
Operational leaders in the sector think in a distinct vocabulary. These are the five measures to put in front of them:
Regulatory risk. Which processes remain misaligned with requirements, what is the remediation timeline, and what is the forward-looking exposure as systems and processes change?
Operational performance. How steep is the J-curve, how long will it last, and which signals mean intervene?
Adoption velocity. Not only whether people use the new system but at what pace and proficiency, which groups lag, and which steps are bypassed with manual workarounds.
Financial impact. Cost savings, revenue from faster time-to-market and reduced rework, tracked in real time against the business case.
Risk incident frequency. Whether the transformation is introducing new operational risk: error rates, compliance incidents, early warnings of instability.
Why the data usually does not exist
Most programmes track adoption at process level but not operational performance at transaction or customer level. They record compliance status historically, not as a forward-looking view. They report milestones, not business impact. Without the data, leaders decide on narrative and intuition, and cannot tell a programme that is tracking well but communicated poorly from one that appears on track while masking emerging operational risk. In financial services, discovering the second case at go-live rather than during implementation is exponentially more costly.
How change management software supports transformation
Change management software supports financial services transformation by turning adoption, readiness, impact and compliance exposure into a continuous, shared data set that leaders can act on before go-live. Rather than relying on periodic surveys, workshops and engagement tracking, platforms instrument the transformation to capture continuous signals. Their relevance has grown as regimes like CPS 230, which requires entities to identify, assess and manage operational risks with effective controls, monitoring and remediation (APRA), expect evidence of oversight rather than assertions of it.
What effective platforms capture
Change management metrics and success measurement. Dashboards that track whether transformations deliver intended outcomes, moving from activity metrics (people trained, workshops held) to outcome metrics tied to adoption velocity and business impact.
Change monitoring and readiness assessment. Continuous readiness for change by department, team and role, so support goes where it is needed before go-live rather than after problems appear.
Change tracking and analysis. Operational, financial and compliance position of each change, integrated with operational data to indicate what is driving adoption patterns and which interventions will work.
Performance metrics and analytics. Correlation of adoption with operational performance, compliance risk and financial outcomes, answering questions such as whether 75 percent adoption in a division is sufficient.
Strategy alignment and initiative orchestration. Connecting individual initiatives to the wider strategy so leaders see how concurrent changes interact, compound or conflict. This matters in a sector juggling dozens of regulatory and technology changes simultaneously.
Assessment and challenge identification. Early surfacing of skills gaps, process misalignments, governance mismatches and resistance, while leaders can still act.
Embedding change data in the operating rhythm
The decisive difference among mature organisations is that they do not treat this as optional project reporting. Change measures feed monthly leadership reviews. Alerts fire when adoption thresholds are breached. Compliance risk is assessed continuously, and financial impact is tracked against projections with course correction when they diverge. IAG’s change governance team describes this kind of data-led approach in a large insurer.
When a regulatory change rolls out, leaders see whether behaviour is really changing or whether people are working around it. When agile teams experiment, leaders see whether the risk envelope is holding. When a cultural programme runs, they track sentiment and behavioural adoption instead of waiting for a survey that arrives months after the decisions were made. The software is valuable not because it is clever but because it makes visible what was previously invisible.
Building credibility with regulators
This data infrastructure has a second function in the sector: it builds credibility with regulators. When a supervisor asks about a major transformation, the question underneath is whether leadership has genuine visibility of operational risk and compliance impact. Real-time transformation metrics show leadership is monitoring and managing the change, not hoping it works. In a regime where accountable executives are named, that evidence matters to the individuals as much as to the institution.
A digital tool for change visibility
For organisations ready to move from project reporting to this kind of operating discipline, purpose-built platforms such as Change Compass provide the integrated view of change impact, load and adoption across a portfolio, so that decisions about sequencing, capacity and intervention rest on evidence. The benchmark for the sector is no longer a well-run project; it is a transformation portfolio managed with the same rigour as financial or operational performance.
Systems thinking: Five data streams in one operating model
The shift from reporting to operating discipline rests on integrating five streams of data rather than collecting them in parallel. Adoption data goes beyond login frequency to whether processes are followed correctly and deliver the intended outcome. Operational data tracks speed, accuracy, error rates and compliance breaches against baseline as the change lands. Risk data gives forward-looking signals about exposure, process gaps and vulnerabilities the transformation itself introduces. Financial data compares actual cost and revenue impact with the business case. Sentiment and engagement data provides early warning of resistance or leadership misalignment.
On their own each stream describes. Together they explain. The organisations that perform best embed this combined view into how decisions get made, in monthly reviews, investment committees and risk forums, instead of keeping it as a parallel reporting activity run by the change team.
Setting the industry standard
Institutions at the top of this maturity range have stopped trying to choose between risk-aversion and innovation. They designed transformation so that risk management, compliance oversight and governance run inside the rhythm of change rather than in sequence after it. They treat controlled experimentation as a core capability, not an exception to risk doctrine, and they regard every transformation as partly a data problem: the work is to understand change in real time, at the granularity and speed senior leaders and supervisors expect.
The practical lesson for any leader in a regulated sector is that maturity is built through systems and decision infrastructure, not through more training sessions or a longer methodology document.
Frequently asked questions
Why is change management harder in financial services than in other industries?
Financial services runs transformation and regulatory change at the same time, inside a risk and compliance culture built for control. A single regulatory change takes more than a year to implement on average, and regimes such as APRA CPS 230, DORA and the Financial Accountability Regime add personal accountability for senior executives. A failed change can mean regulatory penalties and lost customer trust, not only lost money.
How much of a bank’s change budget goes on regulatory compliance?
Boston Consulting Group found that banks spend roughly 40 to 60 percent of their change budget on regulatory compliance. Much of that is inefficient when delivered through sequential, waterfall projects. The same analysis found agile approaches, properly governed, could cut IT spending on compliance projects by 20 to 30 percent while improving on-time delivery.
Can agile work in a regulated bank or insurer?
Yes, if risk and compliance are built into delivery rather than added as a final approval gate. Cross-functional teams that include risk, compliance and the business can release in small increments while controls are tested at every step. This turns risk management from a gate into a guardrail and keeps the audit trail regulators expect.
What should financial services leaders measure to know a transformation is working?
Track outcomes, not activity. The five measures that matter are adoption velocity (correct use of the new process, not logins), forward-looking regulatory risk, operational performance against baseline, financial impact against the business case, and new risk incidents introduced by the change. Linking them in one view lets leaders diagnose why a division is lagging and intervene precisely.
What are the levels of change maturity in financial services?
There are three broad levels. At the project-centric level, change management is an overlay that disbands when the project ends. At the governance-integrated level, change is part of project governance but measured mainly through surveys. At the data-driven level, change is a continuous operating discipline with real-time visibility of adoption, compliance risk, operational performance and financial return.
Building the transformation financial services needs
Delivering on time and on budget is no longer enough in this sector. The programmes that earn their place are the ones that move adoption at pace, hold operational performance through the transition, manage compliance ahead of the deadline, show a return against the business case and leave the organisation better prepared for the next round. That is an operating discipline more than a project skill, and it depends on a view of the whole portfolio, not one programme at a time.
Start with an honest placement on the three maturity levels, then pick the one measure from the five above that your board cannot currently see. Make that visible first, and use it to build the case for the rest. Institutions that do this are better able to hold regulatory deadlines, concurrent modernisation and a cautious culture in the same plan, because they can show where each is landing while there is still time to adjust.
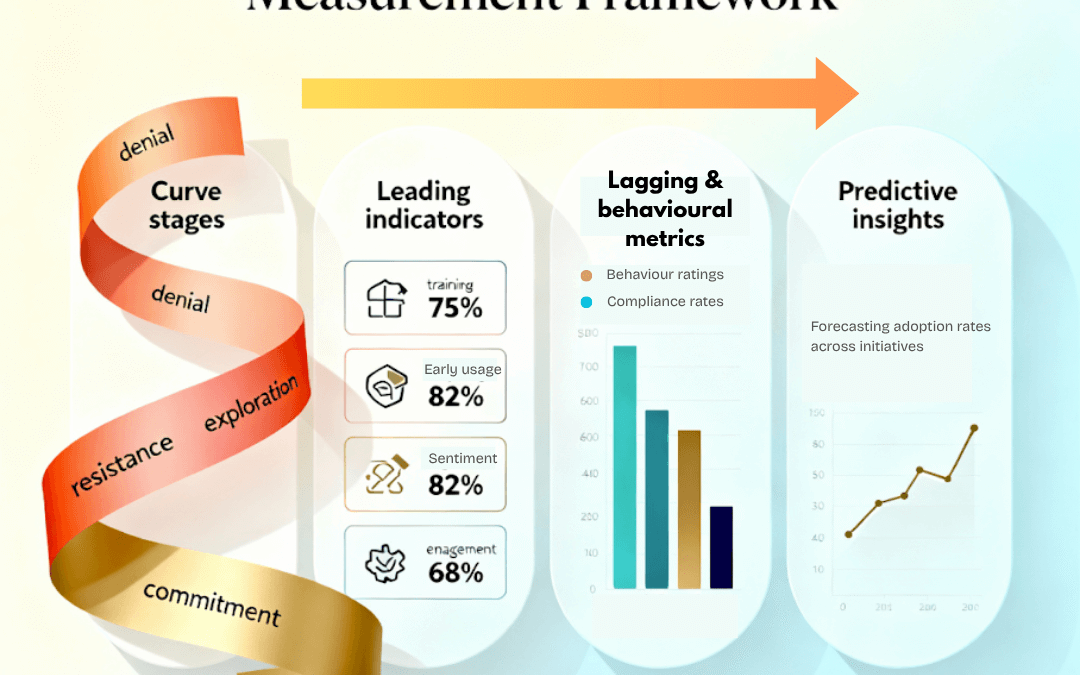
Understanding how people navigate through organisational change has been a cornerstone of effective change management for decades. The change management curve, adapted from Elisabeth Kübler-Ross’s work on grief, provides valuable insights into the emotional journey individuals can experience during transformation. However, measuring change adoption requires more than simply mapping people’s positions on this curve – it demands a sophisticated understanding of behavioural indicators, performance metrics, and the complex realities of modern organisational change in organisations.
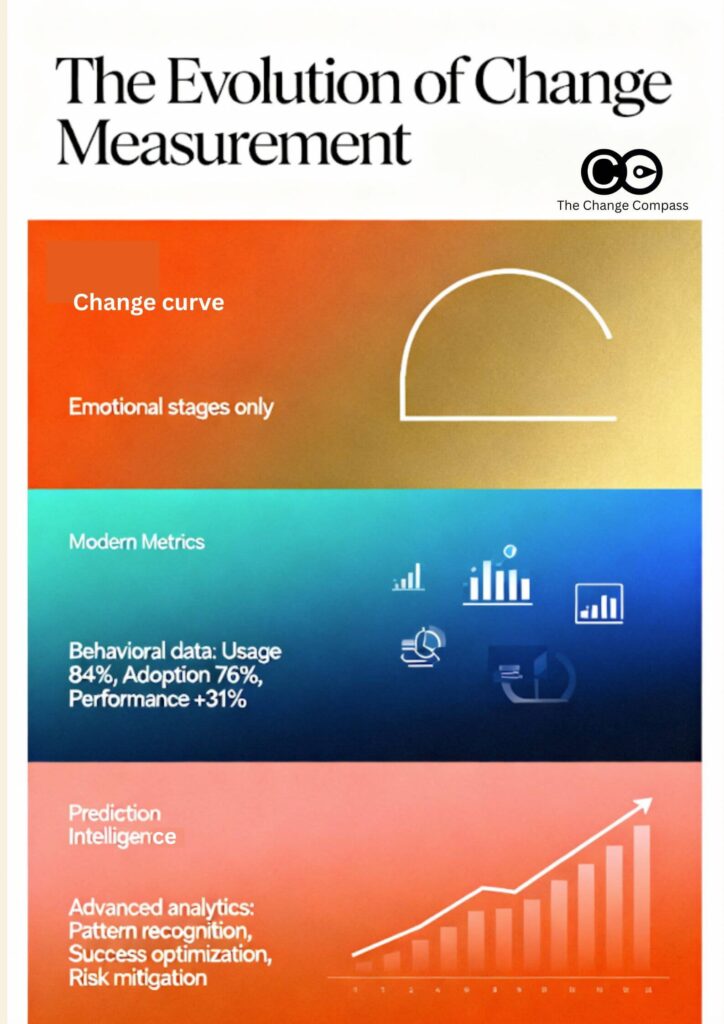
The relationship between the emotional stages of change and measurable adoption outcomes is both nuanced and critical to transformation success. While the change curve offers a framework for understanding emotional responses within your change management framework, measuring change management effectiveness requires concrete, observable indicators that demonstrate whether people are actually embracing new ways of working rather than merely progressing through emotional stages.
This guide explores how to measure change adoption effectively within the change management curve. We’ll examine when the curve provides valuable guidance, when it may mislead practitioners, and how to build robust measurement frameworks that capture the true indicators of change management success in complex organisational environments.
Understanding the change management curve
Origins and validation of the model
The change management curve emerged from Dr. Elisabeth Kübler-Ross’s 1969 work “On Death and Dying,” which outlined five stages of grief experienced by terminally ill patients. Change management practitioners adapted this psychological model to explain how individuals respond emotionally to organisational transformations as part of change management theory.
Recent research by Hagemann and Cechlovsky (2024) provides empirical validation of these stages in business environments, demonstrating that “individuals manifest akin responses within their respective phases of the change curve, amenable to effective facilitation through judicious interventions”. The study identified four validated phases that consistently appear across different project contexts: Unawareness & Denial, Discomfort & Resistance, Exploration & Discovery, and Integration & Commitment.
Multiple studies have validated the existence of the change curve in organisational contexts, including research from The University of Alabama (1999), “The Death Valley of Change” study (2002), and Finnish-American research (2010). However, the research also reveals important limitations. The curve is not universally applicable, and individual experiences vary significantly. Some people adapt faster than others, and some may not even go through all the stages.
When the change curve is useful for understanding adoption
Appropriate contexts for curve application
The change management curve proves most valuable in specific organisational contexts where emotional processing plays a central role in adoption success within your change management approach. Research indicates that the curve is particularly effective when changes require significant behavioural change management, involve loss or disruption of familiar systems, affect deeply held values or practices, or create uncertainty about job security or role changes.
Complex system implementations, organisational restructuring, cultural transformations, and compliance initiatives that alter fundamental work practices represent ideal applications for change curve analysis as part of your change management methodology.
Individual-level emotional support and resistance prediction
The change curve excels at providing frameworks for individual emotional support during transformation. Understanding where individuals are positioned on the curve enables “effective facilitation through judicious interventions” as part of comprehensive change management techniques. Someone in the denial phase requires different support than someone in the exploration phase.
When the change curve should not be used
Linear progression and high-performing environments
Recent research reveals that the characteristic “dip” in the change curve may not occur in environments with the right conditions. As noted by Leopold and Kaltenecker (2015), the performance dip primarily occurs “when the change necessitates that people in the organisation have to unlearn old behaviours, processes and systems and learn new ways of doing things”.
In organisations with strong change management capabilities, high psychological safety, clear communication, and adequate support systems, individuals may transition through change without experiencing significant emotional disruption. High-performing teams with previous positive change experiences may demonstrate change readiness that bypasses traditional curve patterns entirely.
Complex organisational and technology-driven changes
The change curve focuses on individual emotional responses but fails to address the systemic complexities of modern organisational change. Large-scale transformations involving multiple interdependent systems, cross-functional teams, and varied stakeholder groups require change analysis beyond individual emotional processing.
Contemporary changes often involve agile change management approaches, iterative implementations, and continuous adaptation that don’t align with the discrete stages suggested by the curve model. Additionally, not all organisational changes trigger the emotional responses that the change curve addresses. Technology upgrades with minimal workflow impact or process optimisations may not generate significant emotional responses, and attempting to apply curve-based interventions to these situations may misdirect resources away from practical adoption barriers.
Key elements of measuring change adoption
Behavioural indicators vs emotional stages
Effective change adoption measurement requires distinguishing between emotional processing and actual behavioural change. While the change curve tracks emotional responses, adoption measurement must focus on observable actions that indicate genuine integration of new ways of working.
Behavioural indicators provide concrete evidence of adoption success:
• System usage frequency and feature utilisation patterns
• Knowledge sharing and collaborative behaviours using new tools or processes
These indicators offer more reliable adoption insights than emotional assessments because they reflect actual implementation of change rather than feelings about change.
Leading vs lagging adoption metrics
Comprehensive change adoption measurement requires understanding the distinction between leading and lagging indicators as part of change management KPI frameworks.
Leading indicators include training completion rates and competency assessments, early system usage patterns, stakeholder engagement in change management activities, feedback sentiment and change champion activity.
Lagging indicators encompass sustained performance improvements, full workflow integration, business outcome achievement, long-term retention of new behaviours, and customer satisfaction improvements.
Quantitative and qualitative approaches
Quantitative metrics provide objective, measurable data about change adoption progress using change management analytics. Essential metrics include adoption rate (percentage of target users actively using new systems), time-to-adoption, usage frequency, feature utilisation, compliance rates, and performance measures showing productivity and quality improvements.
While quantitative metrics provide measurable outcomes, qualitative assessment offers crucial context about adoption barriers, user experience, and sustainability factors through stakeholder interviews, change management surveys, observational studies, feedback sessions, and case studies. These approaches reveal the “why” behind quantitative patterns and inform targeted interventions.
Building comprehensive adoption measurement frameworks
Multi-dimensional measurement approach
Effective change adoption measurement requires frameworks that capture multiple dimensions of change simultaneously. Comprehensive measurement examines adoption across people, process, and business dimensions.
People metrics focus on individual and team change readiness, capability development, and engagement levels. Process metrics examine how well new workflows and systems are being integrated into daily operations. Business metrics demonstrate the ultimate value delivery of change initiatives through improved outcomes, cost savings, and strategic objective achievement.
Technology-enabled measurement platforms
Modern change adoption measurement benefits significantly from technology platforms that automate data collection, provide real-time insights, and enable sophisticated analysis as part of change management tools and techniques.
Technology advantages include real-time data collection from system usage and user interactions, automated reporting that reduces manual effort, predictive analytics that identify adoption risks, change management metrics dashboard visualisation, and integration capabilities that combine data from multiple sources.
Change adoption measurement must be ongoing rather than episodic to capture the dynamic nature of adoption processes through effective change monitoring. Continuous monitoring approaches include weekly usage analytics, monthly adoption reviews, quarterly deep-dive analyses, and real-time alert systems flagging significant adoption issues.
This approach transforms measurement from a retrospective assessment tool into a proactive management capability that drives ongoing change management success.
Integration of change curve insights with adoption metrics
Combining emotional and behavioural indicators
The most effective change adoption measurement approaches combine insights from the change management curve with concrete behavioural metrics. This integration provides both emotional intelligence about stakeholder experience and objective data about adoption progress as part of comprehensive change management best practices.
Integrated measurement frameworks track emotional indicators showing curve progression alongside behavioural metrics demonstrating actual adoption, satisfaction and confidence measures correlated with performance and usage data, and resistance patterns identified through curve analysis combined with compliance and engagement metrics.
Using curve insights to interpret adoption data
Change curve insights provide valuable context for interpreting adoption metrics. Understanding emotional progression helps explain adoption patterns and guides appropriate responses to measurement findings.
For example, decreased system usage during early implementation phases may reflect curve-predicted resistance rather than system problems, requiring different interventions than technical issues would warrant. Similarly, rapid adoption by some users may indicate curve bypass rather than universal success, suggesting need for continued support of others still processing emotional aspects of change.
The Change Compass approach to predictive adoption intelligence
Beyond measurement to predictive insights
The Change Compass platform represents the next evolution in change adoption measurement, moving beyond traditional tracking to provide predictive and prescriptive intelligence that transforms how organisations approach change management. Rather than simply reporting what has happened, The Change Compass uses sophisticated analytics to forecast adoption trajectories and identify the factors that drive successful adoption across different contexts.
This predictive capability addresses one of the fundamental limitations of traditional change management tracking: the reactive nature of insights that arrive too late to inform proactive intervention. The Change Compass enables organisations to identify adoption risks weeks or months before they manifest, providing the lead time necessary for effective mitigation strategies.
Data-driven adoption forecasting
The Change Compass leverages historical change management data combined with current adoption indicators to generate accurate forecasts of adoption rates across different stakeholder groups, timeframes, and change contexts.
Forecasting capabilities include:
• Adoption rate predictions by stakeholder group, showing expected adoption curves over time
• Risk identification highlighting specific individuals, teams, or business units likely to struggle with adoption
• Timeline accuracy providing realistic estimates for achieving adoption milestones
• Resource requirement forecasting predicting support needs throughout the adoption journey
• Outcome probability estimating likelihood of achieving intended business results
These predictions enable change managers to allocate resources proactively, adjust timelines realistically, and design interventions that address predictable challenges before they impact outcomes.
Pattern recognition for adoption success factors
Beyond forecasting adoption trajectories, The Change Compass identifies the specific factors that enhance or inhibit adoption success within your organisational context. Through analysis of multiple change initiatives over time, the platform recognises patterns that distinguish successful adoption from failures.
Pattern analysis can reveal:
• Stakeholder characteristics associated with rapid adoption (previous change experience, role types, team dynamics)
• Intervention effectiveness showing which change management techniques produce the best outcomes in different contexts
• Environmental factors that accelerate or impede adoption (organisational culture, leadership support, resource availability)
• Optimal timing patterns for training, communication, and support activities
• Threshold indicators signalling when adoption has achieved sustainability
This intelligence transforms change management from an art based on intuition to a science informed by evidence. Instead of relying on generic best practices, organisations can implement strategies proven effective within their specific environment.
Contextual intelligence for targeted interventions
The Change Compass provides contextual intelligence that enables precisely targeted interventions rather than generic approaches. By understanding how to measure change management success factors specific to different stakeholder groups, the platform recommends interventions tailored to the unique characteristics of each adoption challenge.
Contextual recommendations address individual learning preferences, team dynamics, role-specific barriers, geographic variations, and timing optimisation to schedule interventions when stakeholders are most receptive. This level of precision dramatically improves intervention effectiveness while optimising resource allocation to areas of greatest need.
Delivering strategic value through integrated intelligence
The Change Compass is an example of a digital platform that transforms change management from a tactical support function into a strategic capability that drives measurable organisational value. By integrating adoption measurement with broader business intelligence systems, the platform provides executives and transformation leaders with the insights needed to make confident, data-informed decisions about their change portfolio.
This integration enables organisations to understand the true impact of their change initiatives on business performance, moving beyond activity reporting to demonstrate concrete value delivery. When adoption metrics connect directly to revenue growth, cost reduction, customer satisfaction improvements, and strategic objective achievement, change management becomes demonstrably essential to organisational success.
Strategic benefits include:
• Portfolio optimisation through clear visibility of which change initiatives deliver the greatest value, enabling smarter resource allocation across the transformation portfolio
• Risk mitigation by identifying struggling initiatives early enough to course-correct, protecting strategic investments from failure
• Capability building as pattern recognition reveals which change management approaches work best in your specific organisational context, building institutional knowledge that improves with each transformation
• Executive confidence in transformation investments backed by predictive analytics showing expected returns and realistic timelines
• Competitive advantage through faster, more successful change execution that enables rapid response to market opportunities
The change management curve provides valuable insights into emotional processing during organisational transformation, but effective change adoption measurement requires comprehensive frameworks that capture behavioural change, performance improvement, and sustained implementation success. Modern change adoption measurement benefits from technology-enabled data collection, analytics-driven insights, and continuous change monitoring approaches that transform measurement from retrospective assessment to proactive management capability.
The future of change adoption measurement lies in predictive, and technology-enhanced approaches that recognise individual differences while maintaining organisational coherence. The ability to not only track but forecast and optimise adoption through pattern recognition represents the next frontier in enterprise change management, enabling organisations to approach transformation with unprecedented confidence and precision in achieving change management success.
References
Hagemann, M., & Cechlovsky, S. (2024). Revisiting the change curve: A rigorous examination and three case studies prompting a re-evaluation of a timeless concept. Journal of Health Services Management. Retrieved from https://journals.sagepub.com/doi/10.3233/HSM-240051
Leopold, K., & Kaltenecker, S. (2015). Organizational and Personal Change. Kanban Change Leadership: Creating a Culture of Continuous Improvement, 110-121.
Nikula, U., Jurvanen, C., Gotel, O., & Gause, D. C. (2010). Empirical validation of the Classic Change Curve on a software technology change project. Information and Software Technology, 52(6), 680-696.
FAQ: Measuring Change Adoption Within the Change Management Curve
Q: What is the change management curve and why does it matter for measuring change adoption?
A: The change management curve (adapted from Elisabeth Kübler‑Ross’s model) describes how individuals emotionally progress through stages during organisational change. It matters for measuring change adoption because it provides context for emotional responses that may influence users’ behaviours—though actual adoption must be measured via behavioural and performance indicators.
Q: What are the limitations of using the change management curve for adoption measurement?
A: The curve assumes a linear, sequential progression through emotional stages, but in real organisational settings individuals may skip or revisit stages, or show minimal emotional disruption. Also, the curve focuses on emotional states, whereas adoption measurement must capture observable behaviour and business outcomes.
Q: What are the most effective metrics to measure change adoption?
A: Effective metrics include behavioural indicators (e.g., system usage frequency, feature utilisation, process compliance, knowledge-sharing) and a combination of leading indicators (training completion, early usage patterns, stakeholder engagement) and lagging indicators (sustained performance improvements, workflow integration, business results).
Q: How can organisations build a comprehensive adoption measurement framework?
A: A robust framework covers multiple dimensions — people (capability, engagement), process (workflow integration, compliance), and business (outcomes, value delivery) — and uses both quantitative (adoption rate, time-to-adoption, usage metrics) and qualitative (surveys, interviews, feedback) methods. It should include continuous monitoring, not just one-off assessments.
Q: How can insights from the change curve be integrated with adoption metrics?
A: By combining emotional insights from the change curve (such as where stakeholders might be in their emotional journey) with behavioural and performance data, organisations can interpret adoption patterns more accurately. For example, a drop in usage might reflect a resistance phase rather than a technical fault.
Q: What role does technology play in measuring change adoption?
A: Technology enables automated data collection (e.g., system logs, usage analytics), real-time dashboards, predictive analytics, and integration across systems. This allows transformation teams to move from retrospective measurement to proactive, predictive adoption management.
Q: When should the change management curve be used—and when should it not?
A: Use the change curve when changes involve significant emotional or behavioural disruption (e.g., major system replacements, role re-definitions) because emotional processing is likely a key factor. Avoid relying on it when changes are incremental, low-impact on roles or processes, or in high-performing teams with strong change readiness where the classic “dip” may not occur.
In short: A change management heat map is a grid that rates how heavily a change lands on each part of the organisation, usually in red, amber and green, by business unit or role against impact type or month. You build one in five steps: set the scope and rating scale, collect stakeholder input, build the matrix, validate it, then present it with recommendations. Its limits are colour bias, ratings with no visible evidence, no guidance on what to do, and a view too coarse to show differences between teams and roles.
Change impact assessment has become a cornerstone of effective change management, providing practitioners with visual tools to understand and communicate how organisational transformations will affect different areas of the business. The change management heat map, with its familiar red, amber, and green colour coding, has emerged as one of the most widely used change management tools and techniques for visualising change impact across departments, teams, and business units.
For change managers beginning their impact assessment journey, heat maps offer an accessible entry point into systematic change analysis. They provide a visual framework that executives can quickly grasp and a structured change management approach for gathering stakeholder input about change effects across the organisation. Understanding how to manage change through these tools effectively remains an important foundational skill for change management professionals pursuing change management best practices.
We will explore a comprehensive approach to creating change management heat maps, from initial setup through stakeholder engagement and final presentation. However, we will also explore the significant limitations of traditional heat map approaches and examines why modern organisations require more sophisticated change assessment tools to successfully navigate complex change initiatives.
Understanding change management heat maps
What is a change management heat map
A change management heat map is a visual representation that displays the anticipated impact of change in organisations across different areas of the business using colour-coded matrices. Most commonly, these maps use traffic light colours – red for high impact, amber for medium impact, and green for low impact – to provide stakeholders with an immediate visual understanding of where change will be most significant within their change management framework.
Heat maps typically organise information along two key dimensions as part of a structured change management methodology. The vertical axis usually represents different organisational areas (departments, business units, locations, or roles), while the horizontal axis might show different types of change impact (process changes, technology changes, people changes, structural changes) or different phases of the change initiative (planning, implementation, adoption, sustainment). There are also other display methods including months of the year at the horizontal axis and business process changes along the vertical axis.
The appeal of heat maps lies in their simplicity and visual impact for implementing change management. Executives can quickly scan the map to understand which areas require the most attention and resources, while change managers can use the visual to guide conversation about support needs and intervention strategies as part of their change management activities.
When heat maps are most useful
Heat maps work particularly well in several specific contexts within the change management process:
• Initial change scoping: When you need to provide stakeholders with a high-level overview of change impact across the organisation during early change management planning
• Executive communication: When presenting to change leadership who require rapid visual understanding of impact distribution
• Resource planning: When making initial decisions about where to focus change management resources and effort
• Stakeholder engagement: When facilitating discussions with business unit leaders about their areas’ change requirements
Heat maps also serve as effective starting points for more detailed change analysis. They can help identify areas that warrant deeper investigation and provide a change management framework for structuring stakeholder conversations about specific impacts and needs.
Creating your change management heat map: a step-by-step guide
Step 1: Define your assessment scope and dimensions
Before creating your heat map, you need to establish clear parameters for your analysis as part of fundamentals of change management. This foundational step determines the effectiveness and usefulness of your final change assessment.
Identifying organisational areas for assessment: Start by determining which parts of the organisation your change initiative will affect. Common approaches to managing organizational change include:
• Business unit analysis (Product divisions, geographic regions, customer segments)
• Functional role groupings (Front-line staff, middle management, senior leadership)
• Location-based divisions (Head office, regional offices, field locations)
Selecting impact dimensions: Choose the types of change impact you want to assess using proven change management techniques. Typical dimensions include:
• Process changes (new workflows, revised procedures, updated standards)
• Technology changes (new systems, software upgrades, digital tools)
• People changes (role modifications, skill requirements, reporting relationships)
• Cultural changes (values, behaviours, communication patterns)
Establishing your rating scale: Define what constitutes different levels of change in your organisational context:
• High impact (Red): Significant changes requiring extensive support, training, or adjustment
• Medium impact (Amber): Moderate changes requiring some support and adjustment
• Low impact (Green): Minor changes requiring minimal support or adjustment
Document these definitions clearly as part of your change management plan, as they’ll guide all subsequent change management activities and ensure consistency across different evaluators.
Also note that change heatmaps can be focused for one specific project, or multiple projects within a portfolio, a department or across the whole organisation.
Step 2: Gather stakeholder input and data
Effective heat map creation requires systematic data collection from relevant stakeholders who understand the operational realities of different organisational areas, representing core change management principles of stakeholder engagement.
Identifying key informants: Select stakeholders who can provide accurate insights about change impacts for your change management process:
• Business unit leaders who understand operational requirements
• Subject matter experts familiar with current processes and systems
• Front-line managers who understand day-to-day work realities
• HR representatives who understand people and capability implications
• Technical specialists who understand system and process dependencies
Conducting impact assessment interviews: Structure your stakeholder conversations to gather consistent, comparable information and conduct subsequent analysis given the organisation environment:
• Present the change initiative overview and timeline
• Explain your impact assessment dimensions and rating scale
• Walk through each relevant organisational area
• For each area, discuss the nature and extent of changes across your chosen dimensions
• Document not just the ratings but the reasoning behind them
• Identify any dependencies or interconnections between areas
Using assessment surveys and workshops: Complement interviews with broader data collection methods as part of comprehensive change management techniques:
• Change management surveys for stakeholders who can’t participate in detailed interviews
• Group workshops to explore areas where multiple perspectives are valuable
• Focus groups to understand specific stakeholder concerns and requirements
• Document reviews to understand current state processes and procedures
Step 3: Build your heat map matrix
With your data collected, you can begin constructing your visual heat map representation using appropriate change management tools and techniques.
Setting up your matrix structure: Create a grid with your organisational areas on one axis and your impact dimensions on the other. Most practitioners use spreadsheet for this initial construction, though purpose-built change assessment tools offer additional functionality.
Populating impact ratings: For each intersection of organisational area and impact dimension within your change management framework:
• Review your stakeholder input and supporting data
• Apply your defined rating criteria consistently
• Assign the appropriate colour code (red, amber, green)
• Document the rationale for each rating in supporting notes
Adding supporting information: Enhance your heat map with additional context following change management best practices:
• Include brief descriptions of the specific changes driving each rating
• Note key dependencies or risks associated with high-impact areas
• Identify stakeholder groups requiring particular attention
• Document assumptions and data sources for transparency
Creating visual clarity: Ensure your heat map is visually effective for change management communication:
• Use consistent colour schemes and formatting
• Include clear legends explaining your rating system
• Add titles and labels that make the map self-explanatory
• Consider using different visual elements (patterns, symbols) to convey additional information
Step 4: Validate and refine your assessment
Before finalising your heat map, validate your analysis through stakeholder review and refinement as part of rigorous change management methodology.
Stakeholder validation sessions: Present your draft heat map to key stakeholders for feedback on your change assessment:
• Walk through your methodology and rating criteria
• Review specific ratings for areas where stakeholders have expertise
• Explore any unexpected patterns or outliers in your assessment
• Gather additional context or information that might affect your ratings
Cross-referencing and consistency checking: Review your heat map for internal consistency within your change management approach:
• Compare similar organisational areas to ensure rating consistency
• Check that interdependent areas have appropriate ratings
• Verify that your impact assessment aligns with known change requirements
• Ensure your ratings reflect the actual scope and timeline of planned changes
Incorporating feedback and adjustments: Refine your heat map based on stakeholder input following change management principles:
• Adjust ratings where new information suggests different impact levels
• Add missing organisational areas or impact dimensions
• Clarify definitions or criteria where confusion arose
• Document changes and the reasoning behind them
Step 5: Present and utilise your heat map
The final step involves presenting your heat map effectively and using it to guide change management planning for change success.
Executive presentation strategies: When presenting to change leadership:
• Start with an overview of your methodology and data sources
• Highlight the highest-impact areas requiring immediate attention
• Explain the implications for resource allocation and timeline
• Connect impact patterns to business priorities and strategic objectives
• Provide clear recommendations for next steps in your change management plan
Facilitating stakeholder discussions: Use your heat map as a conversation starter for managing change:
• Focus discussions on high-impact areas and required support
• Explore dependencies and interconnections between areas
• Identify opportunities for shared resources or coordinated approaches
• Develop action plans for addressing specific impact requirements
Translating insights into change strategy: Convert your heat map findings into practical change management plans:
• Prioritise high-impact areas for early engagement and support
• Design targeted interventions based on specific impact types
• Allocate change management resources according to impact intensity
• Develop communication messages tailored to different impact levels
• Create change monitoring approaches to track progress in critical areas
Beyond the spreadsheet heatmap: If your heatmap lives in Excel or PowerPoint, The Change Compass builds it from structured impact data and keeps it current across every initiative, down to role and week. See how The Change Compass works or book a demo.
The growing limitations of traditional heat map approaches
While heat maps serve as useful introductory tools for change assessment, experienced change managers increasingly recognise their significant limitations in complex organisational environments. These limitations become particularly problematic when dealing with large-scale transformations, multi-dimensional changes, or sophisticated organisational structures that require advanced change management analytics.
Risks in using the heatmap
A lot of change managers have experienced situations where they walk into a leadership meeting expecting to have discussions about business areas most impacted by the change, and instead:
They are interrogated about how the colours are determined and are asked to justify how logical the ratings are
Stakeholders’ eyes glaze over the visuals since there is not much they could do with the information beyond a nice FYI
Stakeholders start asking questions about specific decisions required for business capacity risks, but decisions are hard to make with high level categorical ratings that does not allow any depth in drilling down to specific details
The psychological bias challenge
The most immediate problem with heat maps lies in their reliance on traffic light colours that carry inherent psychological associations. When stakeholders see red, they instinctively interpret this as “bad” or “problematic,” while green suggests “good” or “safe.” Yet in change impact assessment, these colours are supposed to represent intensity of change, not positive or negative outcomes.
This psychological bias creates several practical change management challenges that undermine the effectiveness of heat map communication. A department marked as “red” for high change impact might be perceived as where the attention should be. However, it may be that the department has great leadership strength and team capability and the changes for them are not more significant than for other departments that are less change-mature. Conversely, “green” areas might be overlooked entirely, even if they contain critical dependencies or risks that need change monitoring.
More problematically, this colour-coding system makes it remarkably easy for stakeholders to challenge your assessments. “Why is marketing red when they’re already using digital tools?” or “How can finance be amber when they’ve been through system changes before?” These questions expose the fundamental issue: heat maps don’t provide the underlying logic, criteria, or evidence base that supports the colour assignments, limiting their effectiveness as change management validity tools.
The decision-making limitation crisis
Perhaps the most damaging limitation of heat maps is their inability to support actual decision-making within enterprise change management. While they might look impressive in executive presentations, they provide no actionable intelligence about what needs to be done differently. A department coded as “high impact” tells you nothing about:
• What specific interventions are required
• When those interventions should be deployed
• What resources are needed for successful implementation
• How this area’s change journey interconnects with others
• What success looks like for this particular context
This lack of actionable insight means that heat maps often become wallpaper real estate – visually appealing but functionally useless for the practical work of managing change through complex initiatives.
The granularity gap that undermines effectiveness
Traditional heat maps operate at the department or business unit level, but modern change rarely respects these organisational boundaries. Consider a digital transformation affecting customer service operations. Within a single “customer service department,” you might have:
• Digital chat specialists (low process change, high technology change)
• Team leaders managing hybrid teams (high people change, moderate process change)
• Quality assurance analysts (moderate process change, high reporting change)
• Training coordinators (high content change, moderate delivery change)
A single colour coding for this department obscures these critical differences, making it impossible to design targeted interventions that address specific needs within your change management methodology.
The granularity problem extends beyond roles to encompass geographic, temporal, and contextual variations. Teams in Melbourne might experience different impacts than those in Brisbane due to local market conditions. Day shift workers might face different challenges than evening shift staff. Customer-facing roles require different support than back-office functions.
Why Excel-based approaches are obsolete in 2025
The credibility challenge of 1980s methodology
Using Excel spreadsheets for change impact assessment in 2025 is equivalent to bringing a slide rule to a data science conference. It signals to stakeholders – particularly senior executives and technology-savvy employees – that your change management approach is fundamentally outdated.
This isn’t about being fashionable with technology; it’s about organisational credibility in change management in business. When your finance team is using sophisticated analytics platforms to forecast revenue, your marketing team is leveraging AI-powered customer insights, and your operations team is using real-time dashboards to monitor performance, presenting change analysis in basic Excel spreadsheets undermines confidence in your entire change management approach.
The credibility problem extends to practical limitations as well. Excel-based approaches typically can’t handle complex stakeholder relationships and dependencies, provide real-time collaboration capabilities for distributed teams, generate automated insights from pattern recognition, integrate with other organisational data sources, support sophisticated filtering and drill-down analysis, or scale effectively across large organisations requiring enterprise change management capabilities.
The mathematical inconsistency problem
From a purely analytical perspective, heat maps violate fundamental principles of data representation. They attempt to multiply likelihood values by impact scores to determine “heat,” but this mathematical operation is meaningless when you’re combining different types of data.
Likelihood is typically represented as a bounded integer (1-5), but impact is represented as an ordinal value. Ordinal values tell you about sequence or ranking, but they don’t tell you about the mathematical distance between categories. An impact of “3” doesn’t communicate how much more severe it is than a “2” or how much less severe than a “5.” Yet the heat map calculation treats these as if they were proper numbers that can be multiplied together.
This mathematical inconsistency undermines any attempt to use heat map results for prioritisation or resource allocation decisions within your change management framework. You can’t meaningfully compare a “9” heat score from one area with a “6” from another when the underlying calculation is mathematically invalid.
The modern requirements for sophisticated change impact understanding
Multi-dimensional analysis capabilities
Contemporary change impact assessment must move beyond simple high-medium-low categorisations to support multi-dimensional analysis that enables measuring change management effectiveness. This means simultaneously examining impacts across temporal dimensions (when do impacts occur?), stakeholder dimensions (how do impacts vary by role, location, team?), impact type dimensions (process, technology, cultural, structural changes?), severity dimensions (magnitude of change required?), and readiness dimensions (change readiness levels of different groups?).
This multi-dimensional approach enables change managers to identify patterns and relationships that aren’t visible in simplified heat map representations. It supports strategic decision-making at multiple organisational levels through location-based analysis of regional variations, role-based analysis of specific competency requirements, team-based analysis of group dynamics, and activity type analysis of operational requirements for successful change management.
Real-time collaboration and predictive capabilities
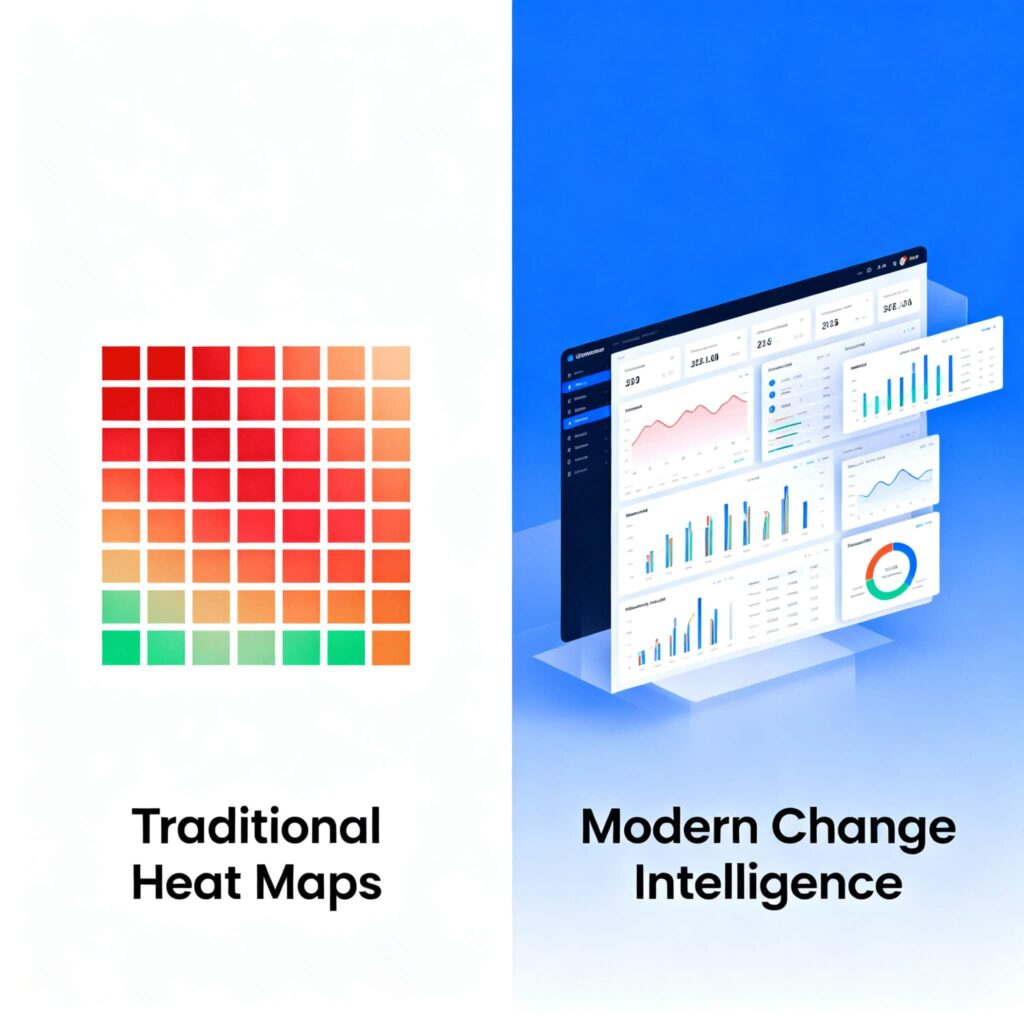
Sophisticated change impact assessment requires platforms that support real-time collaboration, dynamic updating as change initiatives evolve, and predictive analytics to identify risks and opportunities that might not be obvious to human analysts. This represents a fundamental shift in change management tools and techniques.
This includes automated notifications, integration with project management tools, pattern recognition across similar historical initiatives, predictive modelling of adoption rates, and resource optimisation recommendations based on impact patterns. These capabilities enable change management tracking and monitoring change management effectiveness in real-time rather than through static reports.
Advanced metrics and dashboards
Modern change impact assessment platforms can provide sophisticated change management metrics dashboards that go beyond simple traffic light indicators. This includes change management performance metrics that track adoption rates, resistance levels, competency development, and behavioural change indicators across multiple dimensions.
These platforms should support change management success metrics such as time-to-proficiency, intervention effectiveness rates, stakeholder satisfaction levels, and business outcome achievement. The ability to measure change management success through granular data analysis represents a critical advancement over traditional heat map approaches.
To find out more about leveraging change management platforms check out The Change Compass.
Building organisational intelligence beyond artefacts
From assessment tools to strategic capability
The most significant limitation of traditional heat maps isn’t their visual representation – it’s their treatment of change impact assessment as an artefact rather than a capability. Heat maps encourage organisations to think of impact assessment as something you create, present, and file away, rather than as an ongoing intelligence system that informs decision-making throughout the change cycle.
Building sophisticated change assessment capability requires organisations to invest in systematic data collection processes, analytical expertise and tools, decision-making integration, and continuous improvement mechanisms. This represents a fundamental shift from traditional change management approaches to agile change management methodologies that adapt based on real-time intelligence, inline with how other business functions are digitising.
Developing competitive advantage through assessment sophistication
Organisations that develop sophisticated change impact assessment capabilities gain significant competitive advantages in their transformation initiatives. These advantages include faster implementation cycles, higher adoption rates, reduced resistance and conflict, better resource allocation, improved stakeholder confidence, and enhanced learning organisation capabilities.
The future of change management platforms that combine human insight with analytical power, providing change managers with intelligence for informed decisions about complex transformations. This includes artificial intelligence capabilities, predictive analytics, and collaborative capabilities that harness collective organisational knowledge for change management success. And luckily, a lot of these capabilities are already available.
Strategic implementation for modern organisations
For organisations ready to move beyond traditional heat maps, the transition should be strategic and systematic rather than sudden. This involves augmenting existing approaches while building more sophisticated analysis underneath, implementing collaborative platforms that support real-time change management tracking, and building predictive capabilities that model different change management scenarios.
The organisations that master this integrated approach to change impact assessment will find themselves better equipped to handle the accelerating pace of change while maintaining focus on the human experience that ultimately determines change management success or failure. Change impact assessment work isn’t just about assessment – it’s about building the intelligence and adaptability that enables sustainable transformation through effective managing change practices in modern digital organisations.
The choice facing change managers is straightforward: continue relying on tools that provide the illusion of insight while undermining transformation success, or invest in sophisticated assessment capabilities that provide genuine intelligence for complex change initiatives. The red, amber, and green squares have served their purpose, but the future belongs to organisations that can measure change management effectiveness through meaningful, real-time intelligence that drives superior change management outcomes.
When should I still use heat maps instead of more sophisticated assessment tools?
Heat maps remain appropriate for simple changes, initial scoping exercises where you need quick visual communication to executives, organisations with limited change management maturity just beginning systematic impact assessment, and simple changes with clear, departmental boundaries. However, even in these situations, consider heat maps as a starting point rather than a complete assessment solution. For complex change environments, a heatmap may be an initial view, to be supplemented by other visuals.
How do I measure the effectiveness of my new change impact assessment approach?
Establish baseline change management success metrics before implementing new approaches, then track improvements in key areas including change initiative success rates, time-to-adoption for new processes, stakeholder satisfaction with change support, accuracy of impact predictions versus actual outcomes, and reduction in change-related disruptions. A meaningful improvement period is typically 6 to 12 months, as this allows enough change initiatives to progress through the full cycle for valid comparison.
What are the main risks of moving beyond heat maps, and how do I mitigate them?
Primary risks include increased complexity overwhelming stakeholders (mitigate through phased implementation and training), higher initial costs (justify through business case and ROI projections), resistance to new approaches, and over-analysis leading to paralysis. Start with pilot implementations to demonstrate value before organisation-wide rollout.
How do I maintain stakeholder engagement when moving to more comprehensive assessment processes?
Maintain engagement by clearly communicating the benefits of better decision-making, providing simplified executive summaries alongside detailed analysis, using interactive dashboards and visualisations that make complex data accessible, involving stakeholders in defining assessment criteria and success measures, and demonstrating quick wins through improved change outcomes. Focus on how sophisticated assessment leads to more targeted, efficient interventions that reduce disruption for end users.
Video: 5 ways to graduate from change heatmaps
Ready to move beyond basic heatmaps? This short video walks through five practical ways to evolve your change impact analysis — from single-question snapshots to multi-dimensional portfolio views that give you the insight to actually influence decisions.
5 ways to graduate from change heatmaps
Frequently asked questions
What is a change management heat map?
A change management heat map is a colour-coded grid that shows how heavily a change affects different parts of an organisation. Rows are usually business units, locations or roles, and columns are impact types such as process, technology and people, or months. Red marks high impact, amber medium and green low.
How do you create a change management heat map?
Define the organisational areas, impact dimensions and rating scale, then collect input from business leaders, subject matter experts and front-line managers. Build the matrix and record the reasoning behind each rating, validate the draft with stakeholders, and present it with clear recommendations on support and timing.
What are the limitations of a change heat map?
Red is read as bad rather than as high intensity, so ratings invite argument. A colour does not show the evidence behind it or what to do next, and department-level ratings hide large differences between roles and teams. Single-initiative heat maps also miss the combined load when several changes hit the same people.
When is a change heat map most useful?
Heat maps work best for early scoping, quick executive communication, first decisions about where to focus change resources, and structuring conversations with business unit leaders. Treat them as a starting point that shows where to look more closely, not as the analysis itself.
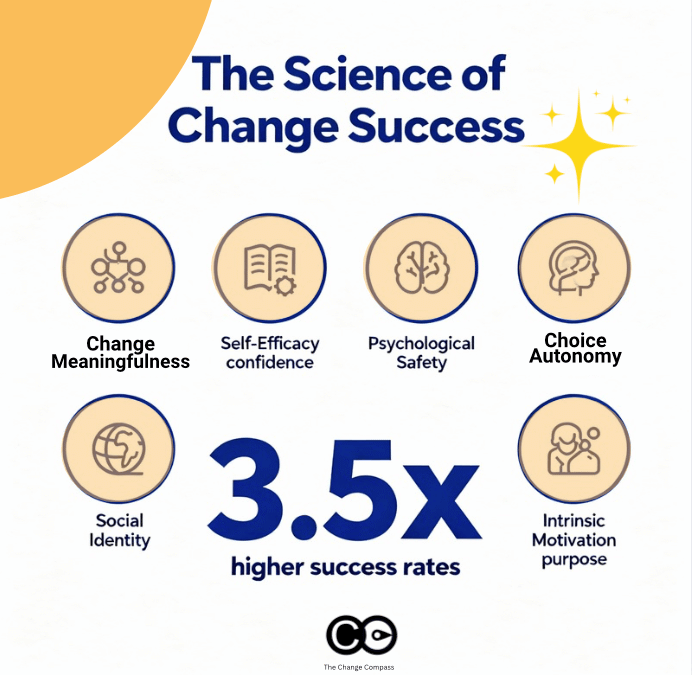
Latest findings from academic studies reveal the real drivers behind successful organisational transformation
If you’re leading organisational change, you’ve probably wondered why some change initiatives take off while others crash and burn despite having similar resources and executive support. The good news is that decades of academic research have cracked the code on what actually drives change adoption success. And the findings might surprise you.
Recent meta-analyses tracking thousands of change initiatives across industries have identified six psychological factors that predict up to 88% of the variance in whether people will embrace or resist organisational change. This isn’t theoretical fluff – these are measurable, actionable insights that can transform your change management approach.
The traditional change management process isn’t enough
Most change management frameworks focus heavily on communication plans, training schedules, and governance structures. While these do matter, research shows they’re not the primary drivers of adoption success. A longitudinal study published in the Journal of Applied Social Psychology found that traditional change management activities only explained about 30% of adoption outcomes.
The real game-changers happen at the psychological level – how people feel about the change, whether they believe they can succeed with it, and if it aligns with their sense of identity and purpose.
What the research reveals about change readiness
The strongest predictor of change adoption isn’t how well you communicate the business case or how comprehensive your training programme is. According to research from Albrecht and colleagues published in Frontiers in Psychology, three psychological conditions together explain 88% of the variance in employee change engagement:
Change-related meaningfulness: Do people understand how this change helps them make a meaningful contribution? When employees see clear connections between the change and their deeper sense of purpose, intrinsic motivation kicks in. This isn’t about vague mission statements – it’s about helping people see tangible ways the change enhances their ability to do work that matters.
Change-related self-efficacy: Do people believe they can successfully navigate and master the change? Confidence in one’s ability to adapt is a powerful predictor of proactive change behaviour. Teams with higher change self-efficacy don’t just comply – they innovate and find better ways to implement changes.
Change-related psychological safety: Can people express concerns, ask questions, and make mistakes without fear? When psychological safety is high, resistance transforms into constructive dialogue. People move from defending against change to collaborating on making it work better.
These three factors work together. You can’t just focus on one and expect miraculous results. But when all three are present, the research shows dramatic improvements in both adoption speed and sustainability.
The autonomy factor that changes everything
Self-determination theory research, with effect sizes sustained over 13-month periods, reveals three autonomy-supportive conditions that dramatically improve change adoption:
• Providing clear rationale: People need to understand not just what’s changing, but why it’s necessary. This goes beyond business cases to help individuals connect the change to broader organisational or societal purposes.
• Offering choices in implementation: Even limited choice in how to implement changes preserves people’s sense of agency. Teams with input into change processes show 65% higher engagement levels.
• Acknowledging feelings and concerns: Counter-intuitively, acknowledging negative emotions about change actually facilitates acceptance. When concerns are heard and addressed, psychological reactance decreases.
This research challenges the traditional “tell and sell” approach to change management. Instead of trying to overcome resistance, successful change leaders create conditions where people can choose to embrace change because it serves their psychological needs.
Social identity: the hidden driver of change success
One of the most overlooked aspects of change management is how changes affect people’s sense of identity and group belonging. Social identity theory research identifies two distinct pathways for successful change adoption:
Identity maintenance pathway: People more readily adopt change when they can preserve core aspects of their existing identity while adapting to new circumstances. This works through continuity mechanisms – maintaining connection to valued aspects of organisational culture and relationships while evolving others.
Identity gain pathway: Alternatively, individuals embrace change when they perceive it will enhance their social identity or provide access to more valued group memberships. This operates through aspiration mechanisms – change becomes attractive when it offers opportunities for growth or alignment with desired characteristics.
The practical implication? Before launching your change initiative, map out how the change affects different groups’ identities (I,e, your change impacts). Then design your approach to either preserve valued identities or provide compelling identity gains.
Rogers’ innovation characteristics still matter
Diffusion of innovation theory, validated across thousands of studies, identifies five characteristics that predict adoption rates and collectively explain 50-90% of adoption variance:
• Relative advantage: The degree to which change is perceived as better than existing approaches • Compatibility: How well change aligns with existing values and experiences • Simplicity: The perceived ease of understanding and implementing change • Trialability: The ability to experiment before full commitment • Observability: The visibility of change results to others
These factors operate through different psychological mechanisms. Relative advantage works through comparison processes, compatibility through cognitive consonance, and observability through social proof. Smart change leaders deliberately design their initiatives to optimise these characteristics.
Measuring what matters: change adoption metrics that predict success
Traditional change management metrics often miss the mark. Tracking training completion rates or communication reach tells you about activities, not outcomes. Research-based change assessment focuses on measuring the psychological conditions that predict adoption:
Early indicators of success: • Meaningfulness ratings: Do people see how the change connects to their purpose? • Self-efficacy scores: How confident are teams about succeeding with the change? • Psychological safety levels: Can people express concerns without fear? • Autonomy support perception: Were rationale, choice, and concerns adequately addressed?
Behavioural indicators: • Proactive change behaviour: Are people finding ways to improve implementation? • Help-seeking behaviour: Are teams asking questions and sharing challenges? • Innovation around the change: Are people adapting the change to work better in their context?
These metrics give you leading indicators of adoption success, allowing you to intervene before problems become entrenched.
The intrinsic motivation advantage
Research consistently shows that intrinsic motivation produces more sustainable change adoption than external incentives. Studies on intrinsic motivation in workplace change show it operates through three fundamental psychological needs:
Autonomy: The need to feel self-directed rather than controlled. Changes that preserve or enhance autonomy see higher sustained adoption rates.
Mastery: The desire to develop competence and skill. Changes that provide growth opportunities tap into learning motivation, making adaptation engaging rather than threatening.
Purpose: The need to contribute to something meaningful. Changes that enhance sense of purpose leverage powerful intrinsic motivators.
Organisations that cultivate intrinsic motivation during change see 83% higher likelihood of innovation, improved retention, and more positive cultures that become self-reinforcing for future changes.
Loss aversion: People psychologically weight potential losses twice as heavily as equivalent gains. This means change communications focusing only on benefits may be insufficient to overcome perceived risks.
Status quo bias: The tendency to prefer current conditions even when alternatives might be superior. This operates through familiarity preferences and psychological comfort with predictability.
Confirmation bias: Selective processing of information that confirms existing beliefs while dismissing contradictory evidence. This particularly affects how people interpret change communications and early experiences.
Successful change initiatives address these barriers directly rather than trying to overpower them with rational arguments. Research shows that change programmes acknowledging and working with psychological barriers have significantly higher success rates.
• Create psychological safety through their own vulnerability and openness to feedback • Provide clear rationale that connects to employees’ values and sense of purpose • Offer genuine choices in how changes are implemented at the team level • Acknowledge the emotional impact of change rather than dismissing concerns • Model the mindset and behaviours they want to see in others
Putting it all together: a psychological systems approach
The most significant finding from this research is that these psychological mechanisms aren’t individual preferences – they represent universal human needs. When addressed systematically, they can dramatically improve change outcomes. Organisations that invest in understanding and supporting these psychological processes see 3.5 times higher success rates in change initiatives.
This research fundamentally challenges traditional change management practice. Instead of an engineering mindset focused on processes and structures, successful change requires a psychological science approach that prioritises human motivation, meaning, and social dynamics.
Practical steps for change leaders:
• Start with meaningfulness: Help people understand how the change enhances their ability to contribute meaningfully • Build confidence: Provide skills, support, and early wins to develop change self-efficacy • Create safety: Establish norms where concerns can be expressed and mistakes are learning opportunities • Preserve autonomy: Provide rationale, offer choices, and acknowledge feelings throughout the process • Consider identity: Map how the change affects group identities and design accordingly • Optimise innovation characteristics: Make changes obviously beneficial, compatible, simple, testable, and visible
The future of change management
Recent studies on the evolution of change management suggest we’re moving toward more psychologically informed approaches. Organisations that integrate these research findings into their change management frameworks are seeing:
• 40% faster adoption rates • 60% higher employee satisfaction during change • 50% lower resistance and turnover • More sustainable behaviour change that persists beyond formal change programmes
The evidence is clear: successful change is fundamentally a human psychological phenomenon. When we address the underlying needs for autonomy, meaning, competence, and social connection, people don’t just comply with change – they embrace it, improve it, and become advocates for future transformation.
As you plan your next change initiative, remember that the most sophisticated project plans and communication strategies won’t overcome basic psychological resistance. But when you create conditions that support human psychological needs, change adoption becomes not just possible, but inevitable.
Understanding what research shows about predicting change adoption isn’t just about improving success rates – it’s about creating more humane, engaging, and sustainable approaches to organisational transformation. And in today’s rapidly changing business environment, that might be the most important competitive advantage you can develop.
If you are looking for a way to easily track change readiness and eventual change adoption leveraging the science of what works through a digital platform, reach out and get in touch.
Most change practitioners fall into the trap of thinking that change impact work begins and ends with the change impact assessment – that single exercise conducted before the midway of a project to determine who’s affected and how. This narrow view fundamentally misunderstands the role of impact work in successful change management. Change impact assessment isn’t a one-off activity; it’s the backbone that runs through every phase of your change initiative, from initial scoping through to post-implementation adoption. Incorrect change impact assumptions means your change approach is incorrect and you may never reach adoption.
The reality is that understanding and managing change impact is an evolving change management process that should inform every decision you make throughout the lifecycle of change. It’s about building a comprehensive picture of how your initiative will affect people, processes, and the broader organisational ecosystem – and then using that understanding to craft interventions that actually work.
When we limit ourselves to a single impact assessment, we’re essentially taking a snapshot of a moving picture. Change impact assessment is dynamic, and our change management approach needs to be equally adaptive. This means starting impact work from the moment we begin understanding what the change entails, and continuing through to ensuring sustainable adoption long after go-live.
Understanding change impact as continuous discovery
Early discovery: mapping the unknown
The journey begins much earlier than most practitioners realise in any effective change management framework. As soon as you start gathering initial information about the proposed change, you’re already conducting preliminary change assessment work. This early phase is about understanding the fundamental nature of what’s changing and beginning to piece together who might be affected.
During these initial conversations with stakeholders, you’re not just collecting requirements – you’re starting to build a picture of potential impacts through systematic change analysis. When a sponsor describes needing to “improve our customer service response times,” you’re already thinking about which teams handle customer enquiries, what systems they use, and how their daily work might shift. This isn’t formal assessment yet; it’s intelligent reconnaissance that will inform everything that follows.
The key at this stage is to remain curious and avoid jumping to conclusions. This foundational change management activity helps you understand not just what’s changing, but why it’s changing and what success looks like. This understanding will shape how you approach every subsequent phase of impact work and serves as a critical component of managing change effectively.
Scoping the scale: from broad strokes to focused planning
As you gather more information through your change management process, you can begin to scope out the size and complexity of the change at a high level. This is where impact work transitions from discovery to strategic planning within your broader change management methodology. You’re now able to make informed decisions about the resources required for change management and how different stakeholder groups will need to be involved.
This phase is crucial because it directly influences your change management approach and resource allocation. A change initiative that affects five people in one department requires a fundamentally different methodology to one that touches every business unit across multiple locations. Understanding the levels of change helps you determine whether you need a small, focused change team or a comprehensive change network with champions across the organisation.
The impact scoping also informs critical decisions about timing and sequencing within your enterprise change management strategy. If your change affects multiple interconnected systems or processes, you need to understand these dependencies early enough to plan a logical rollout sequence that minimises disruption and maximises change success.
Developing your strategic impact lens
High-level impact assessment for approach design
With sufficient detail gathered, you can conduct a more structured high-level change assessment. This forms the foundation of your change management approach and helps you make strategic decisions about how to manage the transformation using proven change management techniques.
This assessment goes beyond simply identifying who’s affected. It examines the nature and depth of impacts across different dimensions: how people’s roles will change, what new skills they’ll need, how processes will be modified, what systems will be different, and how the organisational structure might shift. Each of these dimensions requires different types of change management activities and represents various levels of change management intervention.
The strategic value of this phase lies in its ability to inform your overall change management framework. If your assessment reveals that the change primarily affects processes rather than technology, your approach will emphasise process training and workflow redesign. If it shows significant cultural shifts are required through behavioural change management, you’ll need to plan for longer timelines and more intensive change management leadership engagement.
Detailed impact analysis: the precision phase
Eventually, you have sufficient detail to conduct a comprehensive change impact assessment. This is the phase most practitioners are familiar with, but it’s important to understand that this detailed analysis builds on all the previous impact work rather than starting from scratch as part of implementing change management effectively.
The detailed assessment examines specific impacts at the individual and team level. It identifies exactly how each role will change, what new competencies people will need, and what barriers they might face in adopting new ways of working. This granular understanding enables you to design targeted interventions that address specific needs rather than generic solutions, representing change management best practices in action.
This phase also involves creating detailed stakeholder maps that go beyond simple influence-interest matrices. You’re looking at change readiness levels, change capacity, potential sources of resistance, and opportunities for leveraging natural change champions within the organisation as part of your broader change management strategy.
Seeing the whole picture: landscape assessment
Understanding the broader change ecosystem
One of the most overlooked aspects of impact work is understanding the broader change landscape that your stakeholders are navigating. To truly take a human-centric view of managing change, you need to see the experience from the perspective of impacted individuals and teams within change in organisations.
This means mapping out all the other change initiatives and business-as-usual challenges that your stakeholders are dealing with simultaneously. Are they also implementing a new performance management system? Have they just been through a restructure? Are they facing increased compliance requirements? All of these factors influence their change readiness and capacity to absorb and adapt to your change.
The landscape assessment often reveals insights that fundamentally alter your change management approach. You might discover that your planned June rollout coincides with the busiest period for your target audience, or that they’re already experiencing change saturation with three other major initiatives. This intelligence enables you to make informed decisions about prioritisation, sequencing, and resource allocation.
Using the right change metrics to assess impacts within the change landscape or within your change initiative is critical to help you piece together a picture of what the impacts mean and if there are risks and opportunities due to impacts within your overall delivery.
Strategic decision-making from landscape insights
The landscape assessment doesn’t just inform timing decisions; it shapes your entire change management framework. If you discover that your stakeholders are experiencing change fatigue, you might decide to emphasise the benefits more strongly or invest more heavily in leadership support. If you find that they’re excited about innovation but wary of technology, you can frame your change accordingly using appropriate analogy or reference points.
This broader view also helps you identify risks and opportunities that aren’t visible when looking at your change initiative in isolation. Perhaps another initiative has already built change capability in your target audience that you can leverage, or maybe there’s a risk of conflicting messages that you need to coordinate through effective change monitoring.
The landscape assessment should inform decisions about whether to proceed as planned, adjust timing, or modify your approach. Sometimes it reveals that the organisation simply doesn’t have the capacity for your change right now, and the most strategic decision is to delay or rescope the initiative based on change readiness factors.
Testing and adapting: impact work in execution
Pilot testing your impact assumptions
When you move into execution, your change impact assessment work shifts from assessment to validation through systematic change management tracking. Your pilot implementation becomes a critical test of all the assumptions you’ve made about how the change will affect people and operations.
This is where the theoretical meets the practical in your change management process. You might have assessed that people will need two days of training to become proficient with a new system, but the pilot reveals they actually need four days plus ongoing coaching. Your impact assessment predicted resistance from middle managers, but it turns out they’re actually champions once they understand the benefits.
The pilot phase is your opportunity to gather real-world evidence about the accuracy of your impact predictions and the effectiveness of your interventions through measuring change management outcomes. This evidence should directly feed into refinements of your rollout strategy and overall change management methodology.
Adapting based on stakeholder feedback
Effective change impact assessment work during execution involves creating robust feedback loops that allow you to continuously refine your understanding and approach through change management monitoring. This means going beyond simple satisfaction surveys to gather meaningful insights about how people are experiencing the change.
Are your readiness activities actually preparing people for the level of change and nature of the impacts they’re experiencing? Are people confident about using new processes, or are they struggling with aspects you hadn’t anticipated in your change analysis? Is the support you’re providing sufficient, or do they need additional resources or different types of assistance?
This ongoing change assessment during execution often reveals gaps in your original analysis or changes in the organisational context that require adjustment. The key is to remain agile and responsive while maintaining the overall integrity of your change management approach.
Sustaining change through continued impact focus
Maximising adoption through ongoing assessment
Even after go-live, change impact assessment work continues to play a crucial role in ensuring successful adoption and measuring change management effectiveness. This phase focuses on validating whether your impact assumptions were correct and whether your interventions are achieving the desired behavioural changes.
This is where you assess whether people are actually doing what they need to do differently, not just whether they know how to do it. Are they using new systems as intended? Are they following revised processes? Are they demonstrating the mindset shifts that the change requires? This ongoing change management tracking helps ensure sustainable change success.
The adoption phase often reveals the difference between compliance and genuine adoption through measuring change outcomes. People might be going through the motions of change without truly embracing new ways of working. This insight helps you determine whether additional change management activities are needed to reinforce desired behaviours and fully embed the change.
Reinforcement and continuous improvement
The final phase of impact work involves ensuring that changes stick and continue to deliver value over time through systematic change management monitoring. This requires ongoing assessment of whether the organisation is sustaining new behaviours and achieving the intended change management objectives.
This phase might reveal that while initial adoption was successful, people are gradually reverting to old ways of working, or that new challenges have emerged that require additional support. Understanding these longer-term impacts enables you to design reinforcement mechanisms that ensure lasting change management success.
The sustainability phase also provides valuable insights for future change initiatives. What worked well in terms of impact management? What would you do differently next time? How can the organisation build on the change capability it has developed through this experience as part of enterprise change management maturity?
Making impact work practical
Building impact work into your change methodology
The shift from treating impact as an activity to embedding it as a continuous process requires some practical adjustments to how you structure change management activities. Rather than having a single “impact assessment” deliverable, consider how impact considerations can be woven throughout your change management framework.
This might mean adding impact review checkpoints to every phase of your project, ensuring that impact considerations inform key decision points, and creating mechanisms for continuously updating your understanding based on new information. This represents one of the key change management best practices for modern organisations.
Developing organisational impact capability
For organisations that undergo frequent change, developing systematic capability around impact work pays dividends as part of enterprise change management maturity. This involves training change managers in comprehensive impact methodologies, creating templates and tools that support continuous change assessment, and building organisational memory about what works.
The most mature organisations develop integrated approaches that combine impact work with broader change portfolio management, ensuring that individual change initiatives are planned and executed with full awareness of the broader organisational context and change in organisations dynamics.
The shift to treating change impact assessment as continuous, strategic work rather than a discrete assessment activity represents a fundamental maturation in change management practice. It recognises that change is complex, dynamic, and inherently human – and that our change management approaches need to reflect this reality.
By embedding impact work throughout the change management process, we create more responsive, effective change management frameworks that better serve both change management objectives and the people who make change happen. This holistic approach doesn’t just improve change success rates; it builds organisational capability for navigating an increasingly complex and change-intensive business environment.
The organisations that master this integrated approach to change impact assessment will find themselves better equipped to handle the accelerating pace of change while maintaining focus on the human experience that ultimately determines change management success or failure. Change impact assessment work isn’t just about assessment – it’s about building the intelligence, logic and adaptability that enables sustainable transformation through effective managing change practices.
We use cookies to improve your experience and understand site use. Marketing cookies stay off until you accept, and in the EU, UK and Switzerland analytics does too. Cookie Policy.
Strictly necessary
Required for the site to work: security, load balancing, and remembering your choices. These cannot be switched off.
Always active
Analytics
Google Analytics and similar, so we can see which pages are useful and where visitors get stuck. Aggregated, never sold.
Marketing
Used to measure campaigns and show relevant content on other platforms such as LinkedIn.