Change Management Reports: The Ultimate Guide to Reports Your Executives Want To See
Change management reports are the structured outputs that translate portfolio-level change activity, adoption progress, readiness signals and operational impact into the language and timeframes that executive sponsors, programme boards and senior leaders need to make decisions. The strongest reports combine four data layers: portfolio view (what is in flight and when), impact view (which groups are absorbing what), adoption view (whether new ways of working are sticking) and risk view (where saturation, sponsorship or capacity gaps threaten outcomes). Effective reporting cadences are tied to decision rhythms (monthly executive meetings, quarterly portfolio reviews) rather than producing data for its own sake.
Why Nailing the Right Change Management Metrics is Critical and Can Make or Break Your Reputation
As organizations strive to adapt and thrive in dynamic environments, how the change management process is tracked has become a strategic imperative. However, the success of any change initiative hinges not only on effective planning and execution but also on the ability to measure and communicate its impact accurately. After all, without the right measures how do we know that we are moving in the right direction? In this article, we explore critical change management reports that executives value in shaping organizational understanding and decision-making. We delve into the metrics that may compromise your credibility and, more importantly, highlight the metrics that executives truly value, providing a roadmap to creating reports that resonate with leadership.
Reading your executives and where they are
Prior to designing the right change management reports and metrics it is absolutely essential that you understand where they are coming from. Understanding their key concerns and perspectives will help you design the right content to engage them. Key questions you may want to delve into include:
- What issues are top of mind for executives when it comes to managing change?
- What has worked or not worked well in the past for change (within what timeline) that should be taken into account?
- How experienced are these executives in driving complex change?
- Putting your strategic hat on, what are the key business performance challenges that executives are facing into? What are the people and change connections to these?
- What are the top key organisational risks that executives are focused on? What are the people and change connections to these?

- Vanity Metrics – Metrics That Don’t Connect to Business Outcomes
One of the pitfalls in change management reporting is the reliance on vanity metrics—superficial measures that may look impressive but lack a direct connection to tangible business outcomes. Metrics such as the number of training hours delivered, numbers of stakeholder groups who received communications or the volume of communication materials distributed might seem impressive and easy to measure, but they provide little insight into the real impact of the change on the organization.
Executives are not interested in surface-level data; they want to understand how the change contributes to the achievement of strategic objectives and positively influences key performance indicators. To enhance credibility, change management reports must move beyond vanity metrics and focus on indicators that align with broader business goals.
- Activity Metrics – Counting Without Context
Measuring the sheer volume of activities related to a change initiative can be misleading, or worse, meaningless, if not accompanied by context and relevance. Activity metrics, such as the number of workshops conducted, numbers of impact assessment activities conducted, number of deliverables worked on, or emails sent, might create an illusion of progress. However, these metrics fail to provide insights into the quality of engagement, the depth of understanding among employees, or the actual impact on work behaviours. Operational managers may find these interesting, but less likely for executives.
Instead of focusing solely on activities, change management reports should emphasize the effectiveness of these activities in driving desired outcomes. Metrics should, instead, highlight the quality of engagement, the level of understanding, and the behavioural shifts observed within the organization.
- Cost-Focused Metrics – Counting Dollars Without Value
While cost-related metrics are important for financial stewardship, solely focusing on cost without considering the value generated by the change can undermine the perceived success of the initiative. Metrics such as the budget spent or the cost per participant may provide financial insights but do not necessarily convey the broader impact on organizational performance.
To read more about how cost-focused metrics may be less valuable, check out our article Why using change management ROI calculations severely limits its value.
Change management reports should focus more on value metrics than cost metrics. Focusing purely on cost is restricting the value of managing change as another cost to the business. However, focusing on the value created in maximising business performance and achieving greater adoption can significant extend the understanding of change management value. Executives are interested in understanding what business value is created through managing change. Value includes how the targeted benefits are better realised and how the business performance is protected or maximised during the implementation of change.
- Intra-Practice Metrics – Metrics That Only Change Management Cares About
It’s a common misstep to develop metrics that only resonate within the change management function and key project milestones but fail to capture the attention of other business units or executives. Metrics that focus exclusively on communication buzz generated, training satisfaction rates, or employee satisfaction with change processes might be valuable for internal assessments but lack the relevance needed to engage executives.
Even the focus on change maturity, that is often the single most critical focus for change management functions, may or may not appeal to a lot of executives. Unless you have already taken the executives on the journey of why focusing on change maturity is critical and you have them fully onboard with this, treat carefully in reporting on change maturity metrics.
At executive level, change management reports should transcend departmental boundaries and speak to the broader organizational impact. This means that your focus should be on reporting at a portfolio level and key strategic initiatives as relevant. Focus on generating insights of what the totality of changes mean to the organisation, and what employee experiences are across multiple initiatives. Metrics should also align with strategic goals and showcase how the change initiatives contributes to overarching business objectives.
The Right Metrics
I. Change Readiness Metrics – Assessing the Pulse of the Organization
Change readiness metrics serve as a barometer for understanding how prepared an organization is for a change initiative. To provide meaningful insights, these metrics should delve into the engagement journey, capturing key elements such as awareness, involvement, and participation.
- Engagement Journey: Awareness, Involvement, Participation
- Awareness: Measure the level of understanding and awareness of the upcoming change across different employee segments.
- Involvement: Assess the degree to which employees are actively engaged in the change process, seeking their input and involvement.
- Participation: Evaluate the extent to which employees are actively participating in change-related activities and initiatives.
- Data Collection Methodology
- Utilize a mix of quantitative and qualitative methods to gather data, including surveys, focus groups, and feedback mechanisms.
- Ensure a representative sample across different organizational levels and functions to capture a comprehensive view of readiness.
- Change Readiness Topic Areas
1. Awareness Assessment:
This section evaluates the extent to which employees are aware of the impending changes across initiatives. It includes an analysis of communication effectiveness, the clarity of messaging, and the overall visibility of the change initiatives. Metrics may encompass the percentage of employees who understand the change purpose and the reach of communication channels.
2. Involvement Evaluation:
Involvement is a key factor in gauging how actively employees are participating in the change process. This explores the degree to which employees feel engaged and have opportunities to contribute to the planning and decision-making aspects of the change. Employees may not have the opportunities to contribute to all types of change initiatives but for those that are relevant this can be quite insightful. Metrics include participation rates in change-related workshops, the number of submitted suggestions, and levels of engagement in feedback sessions.
3. Perceived Impact:
This area delves into employees’ perceptions of how the changes will affect them personally and professionally. It includes an analysis of perceived benefits, risks, and the overall impact on day-to-day responsibilities. Metrics may encompass the percentage of employees who feel well-informed about the impact of the change and qualitative insights from open-ended survey questions.
4. Change Champions performance:
Identifying and nurturing change champions can be crucial for successful change implementation, especially across the change portfolio. The presence of key business change champions who actively support and advocate for the changes within their teams and business units can shed light on how the change is performing. Metrics include the presence of key change champions across business areas, their engagement levels, and the effectiveness of their engagement strategies within their respective departments.
5. Learning and Development Readiness:
Learning and development play a vital role in equipping employees with the skills necessary for the upcoming changes. This section evaluates the organization’s readiness to deliver learning programs effectively, including the availability of resources, the alignment of learning content with change objectives, and the accessibility of learning materials. This can be outlined not just at initiative levels, but from business unit perspectives. Different business units may have different processes and channels from which to deploy learning and development across initiatives. The readiness and maturity of these can make or break the adoption of changes.
6. Resource Allocation and Availability:
Change initiatives often require additional resources, and this section examines the organization’s capacity to allocate and provide the necessary resources for a smooth transition. Metrics include the allocation and availability of SME resources, business representatives, the availability of technology and tools, and the overall preparedness of support functions for the myriad of change initiatives. Is there adequate allocation of these resources? For example, for digital transformation is there still reliance on manual work processes that should be upgrade to drive efficiency and effectiveness?
7. Leadership Alignment:
Leadership alignment is a critical factor influencing change readiness. This section evaluates the extent to which various leaders are aligned with the change vision and actively communicate their support. Metrics encompass leadership messaging consistency, visibility, and the perceived commitment of leaders to the success of the change.
8. Employee Feedback Mechanisms:
Establishing effective feedback mechanisms is essential for continuous improvement during change initiatives. This section assesses the availability, content and effectiveness of channels through which employees can provide feedback, ask questions, and express concerns. Metrics include response rates to feedback requests, the variety of feedback channels used, and themes of responses from targeted employee groups.
Change Readiness Data Collection Methods
Collecting data on change readiness is a crucial step in understanding an organization’s preparedness for a change initiative. Various approaches can be employed to gather relevant information. Here’s a list of key approaches:
- Surveys and Questionnaires
- Focus Groups
- Interviews
- Observation
- Benchmarking
- Document Analysis
- Readiness Workshops
- Network Analysis
- Online Platforms and Social Listening
- Pulse Surveys
- Interactive Assessments
II. Change Journey Analytics – Navigating the Transformation Landscape
Change journey analytics provide a view of what key employee change experience highlights are, including insights on any behavioural changes, attitudinal changes, the volume of changes and how changes are being driven against key business performance challenges.
- Change Volume Risks – Change volume risk measures highlight key change impact volumes across the business over time, with key call outs on any risks on heightened change periods.
- Change Activity Design – The totality of change management activities across initiatives from the lens of impacted employee groups should be analysed with potential risks highlighted.
- Single View of Change of BAU and Strategic Initiatives – Provide a consolidated view of ongoing business-as-usual (BAU) changes alongside strategic initiatives.
- Business Performance – Link change activities to business performance metrics. Demonstrate how the change initiative contributes to key performance indicators and strategic goals.
Nurturing Lasting Transformation: The Role of Adoption Analytics in Sustainable Change
Adoption Analytics Unveiled: Beyond Implementation
When we discuss adoption analytics, we transcend the traditional boundaries of project management. While implementation marks the beginning of change, adoption analytics guide us through the more profound stages, measuring the extent to which the organization has embraced and embedded the change.
1. Business Performance Metrics: Gauging Impact on Organizational Vital Signs
To truly understand the success of change initiatives, one must look beyond the surface and delve into its impact on key business performance metrics. This involves a holistic examination of factors such as productivity, efficiency, and customer satisfaction.
- Productivity: Assessing the changes’ effects on productivity involves measuring the organization’s output and efficiency post-implementation.
- Efficiency: Changes often aim to streamline processes and enhance efficiency.
- Customer Satisfaction: In many cases, change initiatives are driven by a desire to improve customer experience.
By examining these metrics, organizations can gauge the real impact of the change on their vital signs, ensuring that the intended improvements manifest in tangible and measurable ways.
2. Benefit Realization: From Anticipation to Tangible Outcomes
Anticipated benefits form the backbone of any change initiative, but true success lies in the tangible realization of these expected outcomes. Benefit realization assessment through adoption analytics involves tracking key performance indicators (KPIs) directly influenced by the change.
- Tracking KPIs: Identify and monitor KPIs that are closely tied to the specific objectives of the change.
- Tangible Outcomes: Work hand-in-hand with initiative benefit owners to ensure clear ownership and tracking of benefits.
- Continuous Improvement: Benefit realization is an ongoing process. Regularly review and adjust strategies based on the data collected.
Collaboration with Initiative Benefit Owners: A Crucial Element
A vital aspect of successful adoption analytics is collaboration with initiative benefit owners. Establishing clear ownership ensures accountability and facilitates a more targeted and effective approach to tracking and optimizing outcomes.
Crafting Compelling Change Management Reports
In the fast-paced world of change management, the ability to convey the impact of initiatives through well-crafted reports is a skill that cannot be underestimated. Executives require more than superficial metrics; they demand a nuanced understanding of how change aligns with strategic goals and influences organizational performance.
By steering clear of vanity metrics, activity-focused measurements, and overly cost-centric reporting, change management professionals can elevate their credibility and influence within the organization. Instead, a focus on change readiness, journey analytics, and adoption metrics provides a holistic perspective that resonates with executives.
To read more about change management metrics check out The Ultimate Guide to Measuring Change.
Frequently Asked Questions
A change management report for executive audiences should include: overall change programme status (on track, at risk, or off track); adoption and readiness metrics with trend direction; the top three risks with recommended mitigation actions; decisions required from the executive; and a summary of the change portfolio load on the most affected employee groups.
Portfolio-level change management reports should be produced monthly, aligned to the organisation’s governance calendar. Reports for active, high-risk change programmes should be produced fortnightly.
Credibility comes from data, not opinion. Reports that include quantitative adoption rates, readiness scores, and specific risk assessments are significantly more credible than reports that describe activities or use subjective language.
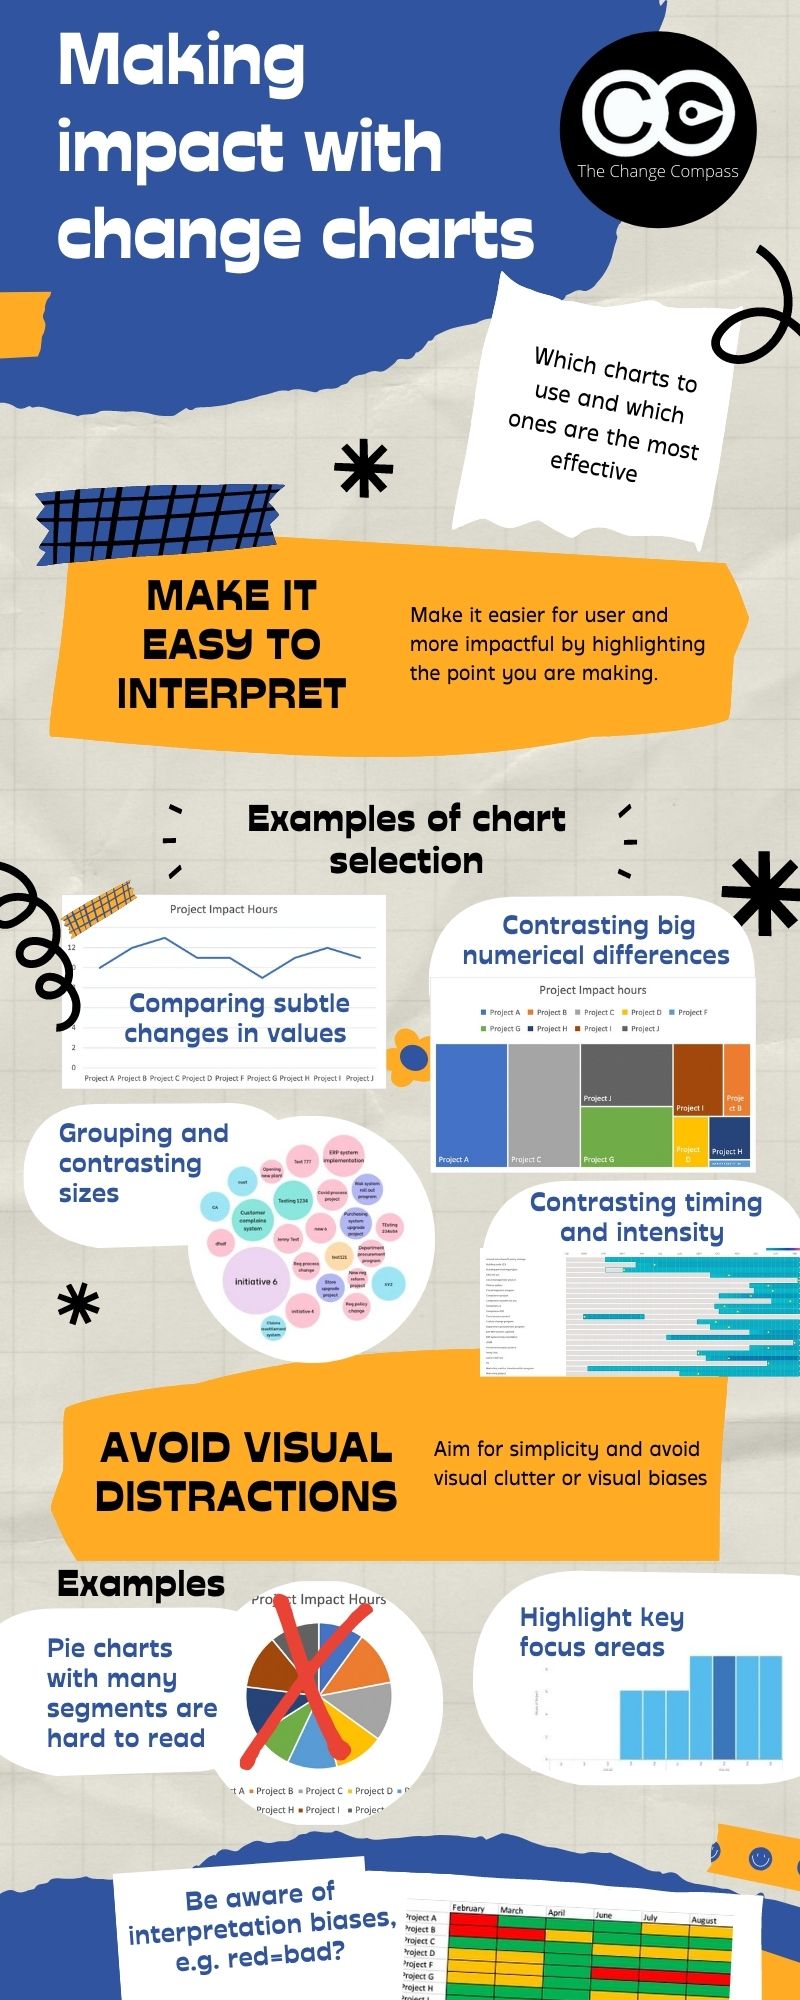
Infographic: Making impact with change management charts
Choosing the right chart type is as important as having the right data. This infographic summarises the key principles for selecting and designing change management charts that make an immediate impact with your audience.