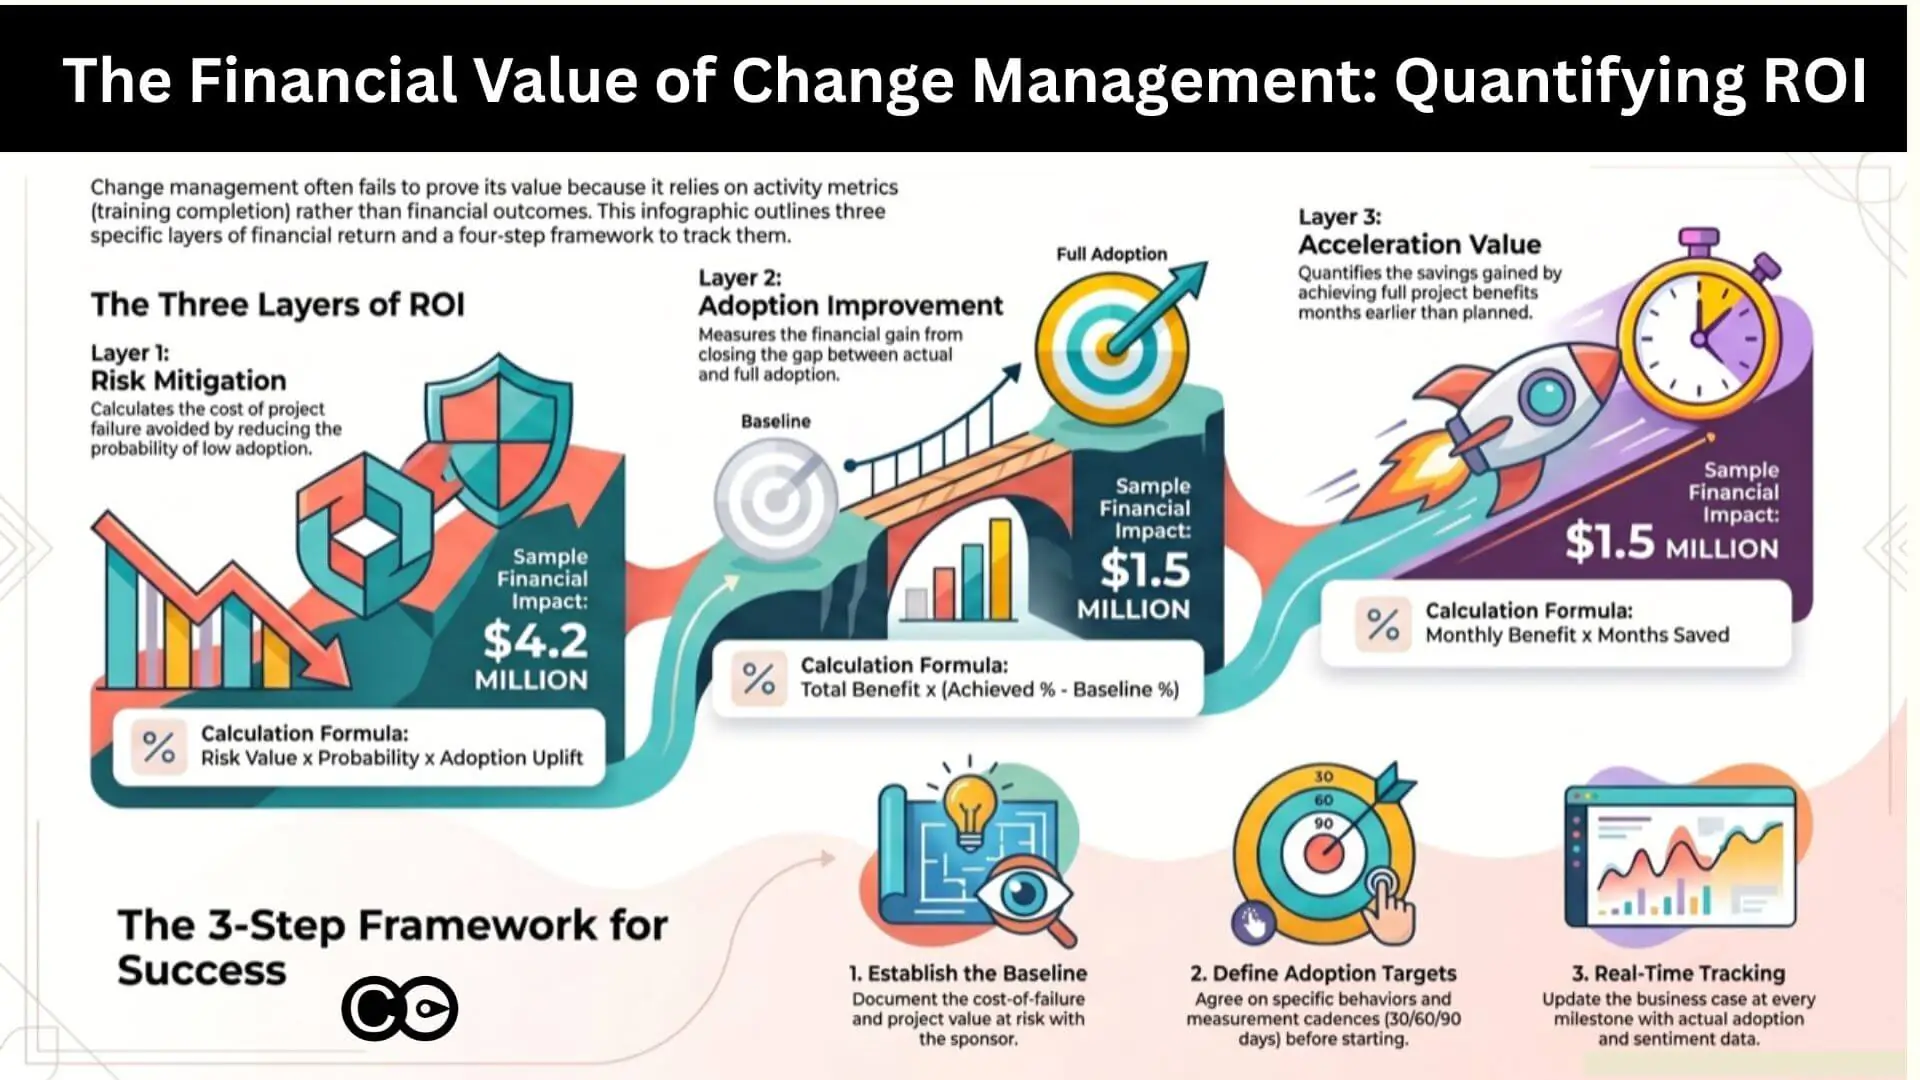


Measuring change management is the practice of capturing whether an organisation’s change activities are landing as intended across a portfolio of initiatives. It covers three distinct layers: project-level metrics that show whether individual initiatives are on track, business-level metrics that show whether the outcomes promised in the business case are being achieved, and enterprise-level metrics that show whether the organisation as a whole is becoming more capable of absorbing change. A complete framework reports on all three. Without measurement at each layer, change management becomes a series of activities with no defensible link to business value.
Most organisations can tell you how many people attended the training and how many emails the project sent. Far fewer can show that the change they paid for is happening in daily work. That gap is now visible at the top of the house: Prosci’s 2026 analysis of ERP programmes found that activity measures such as training completion and communications sent say little about whether people can actually use the new system, and that organisations with poor metrics succeeded less often than those with no formal metrics at all.
This guide is for the senior change, HR and transformation leaders who have to answer the question “is it working?” in a steering committee, not a workshop. It argues for one layered measurement system instead of a pile of surveys, sets out the six project-level methods most teams already use (and where each one breaks), walks through the measures that belong at project, business and enterprise level, and gives you a five-step framework and a reporting cadence. It is also the hub for our measurement cluster: each sub-topic gets a short answer here and a link down to the guide that covers it in full.
In this guide: Why change can be measured | Six project-level methods | Leadership and maturity | The three-level model | The measurement system | Which guide for which question | FAQ
Why change can be measured
Change can be measured because behaviour, readiness, capacity and benefits all leave evidence in data your organisation already collects; the real question is which of that evidence you choose to look at, and whether it measures activity or outcomes.
A lot of change practitioners are comfortable saying that change management is about attitudes, behaviours and feelings, and therefore cannot be measured. That “soft” framing extends into areas such as leadership and employee engagement, where tracking is certainly harder. But harder to measure and less black and white is not the same as less worth measuring. The old maxim that you cannot improve what you do not measure, often attributed to Peter Drucker, applies as much to how people move through a change as it does to inventory or cash.
Data is already changing everything around us
The reason so much industry change happens now is that data has become a central part of how the world runs. We rely on the internet for information, and the data collected through our digital interactions drives decisions about us. A home assistant such as Amazon’s Alexa recognises our voices and answers what we ask. Street cameras can identify us. Our Google usage shapes the advertisements and product promotions we see, and our Facebook usage builds a detailed picture of our preferences and lifestyles, so that we are targeted with what the platform’s algorithms think we will value.
So if our world is surrounded by data, why are we not measuring it when managing change? To answer that, it helps to look at what is, and is not, being measured today.
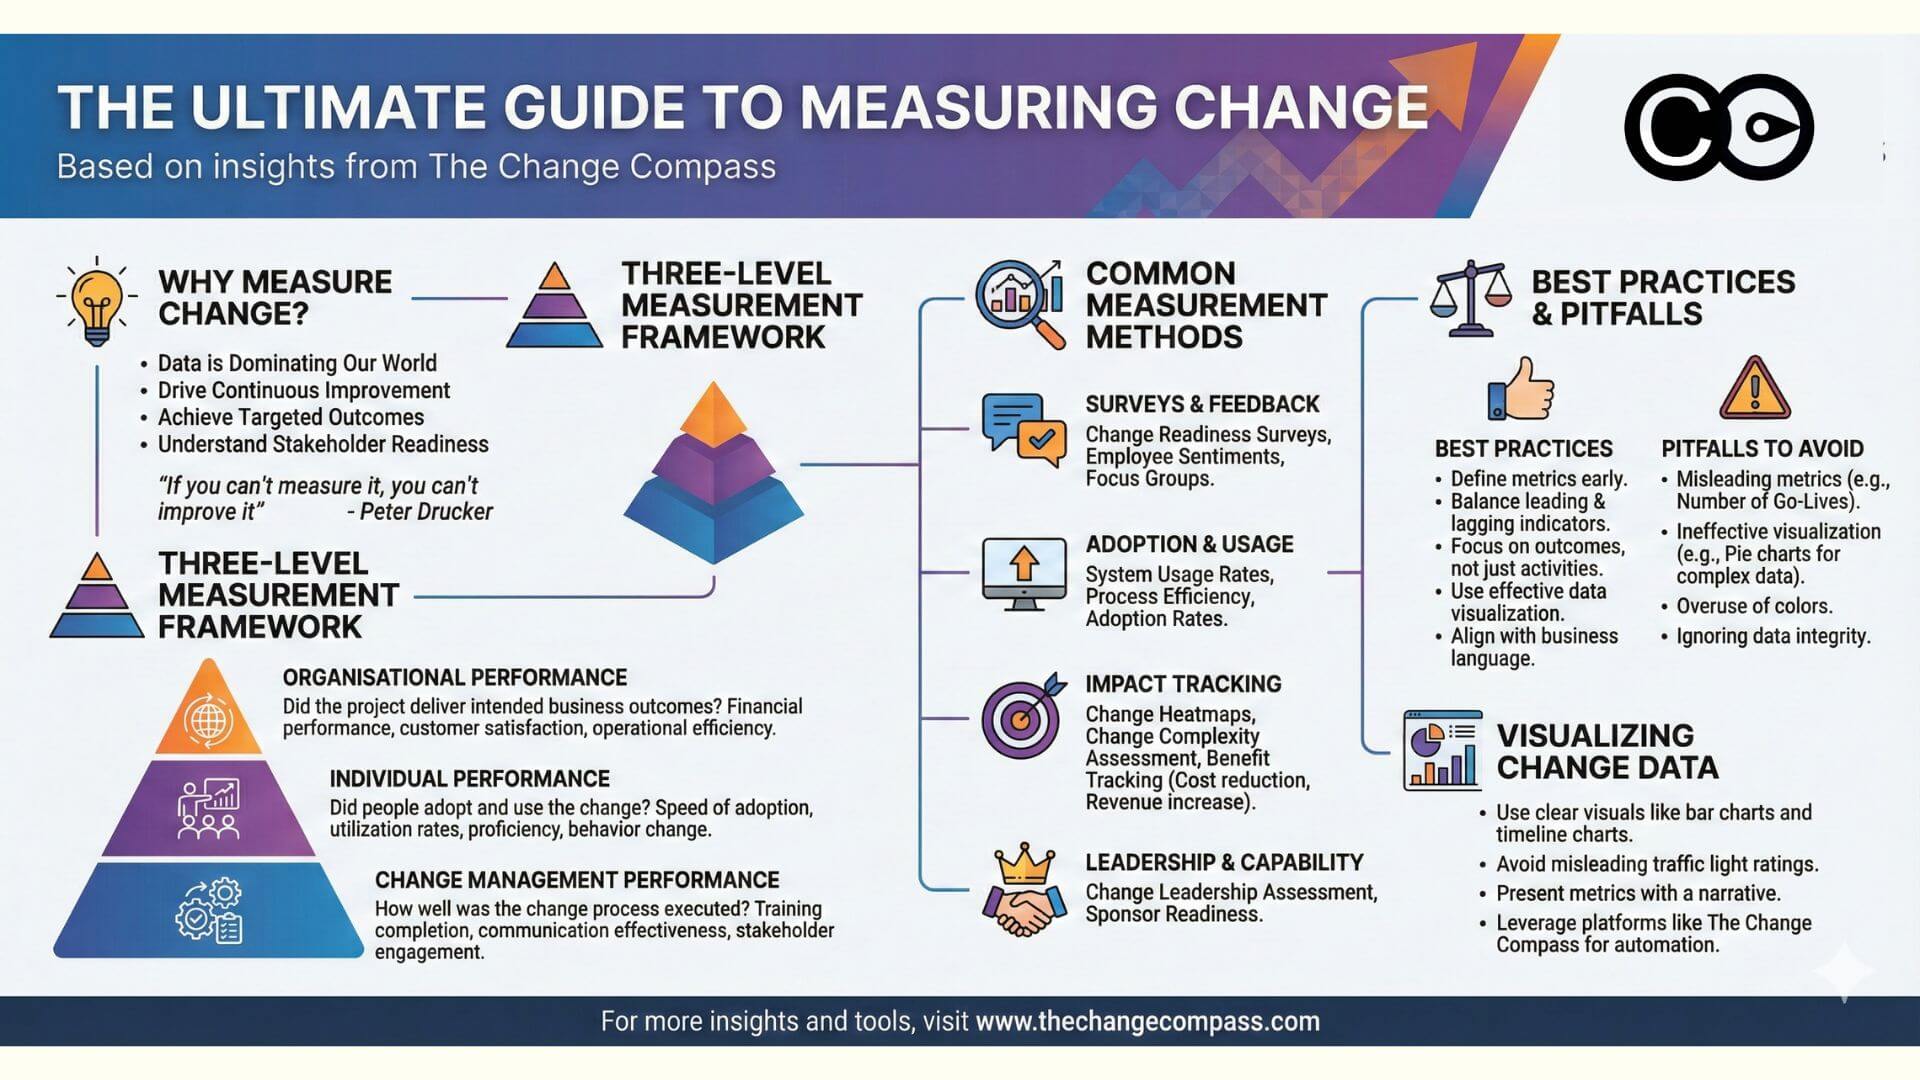
Activity metrics versus outcome metrics
The most common weakness in change reporting is a dashboard built from activity metrics. Training completion, newsletter opens and workshop attendance are easy to collect, which is why they dominate. They tell you what the change team did, not what the workforce did as a result.
Prosci’s current guidance is to measure what it calls the human factors of return on investment: speed of adoption, ultimate utilisation (whether the people who should use the new process actually do) and proficiency (how well they perform afterwards). It also recommends three to five metrics per initiative, each with a purpose, an owner and a threshold that triggers action. Our guide to five metrics leaders actually use goes deep on that short list. As a working rule:
- Activity metrics (sessions run, emails sent, pages viewed) manage the change team’s own workload.
- Outcome metrics (speed of adoption, proficiency, sustained use, benefit delivered) show whether the change is landing.
- Report both, but never let the first stand in for the second in front of a steering committee.
Six common ways to measure change at project level
Most projects measure change with a mix of six methods: readiness surveys, training evaluations, communications metrics, sentiment or culture surveys, change heatmaps and benefit tracking. Each is useful, and each has a known blind spot that the three-level model later in this guide is designed to cover.
1. Change readiness surveys: What do they actually measure?
Change readiness surveys are short pulse assessments, usually a handful of Likert-scale questions plus a free-text box, sent at pre-launch, mid-execution and post-launch. They benchmark how prepared each stakeholder group feels. They work best when combined with behavioural observation, and when repeated at set points so scores are comparable over time.
In practice, readiness surveys are online surveys sent by a project owner to understand how stakeholder groups feel about the change at different points in the project, in the form of a Likert scale or free text. Most results are summarised into a quantitative scale showing the degree to which a group is ready for change. A simple survey built in SurveyMonkey or Microsoft Forms is enough to start measuring stakeholder readiness. ChangeTracking is a more comprehensive online tool that measures the change journey and the readiness of stakeholder groups throughout an initiative. For the full method, including how to go beyond the survey, read our guide to measuring change readiness with data, not just surveys.
2. Training evaluation surveys: How do you prove training return?
Training evaluations capture participant satisfaction across categories such as content, instructor effectiveness and usefulness. They are the cheapest measure to collect and the weakest proof of change, because satisfaction is not capability and capability is not behaviour.
These evaluations are normally based on participant satisfaction across those categories. In a face-to-face format they are often paper-based to lift the completion rate. For online or virtual training, ratings are completed by the learner at the end of, or shortly after, the session. To turn training from a satisfaction exercise into evidence, add a knowledge check at the end and an on-the-job application check a few weeks later (covered under learning tracking below).
3. Communications metrics: Which ones matter most?
The most useful communications metrics show reach and attention rather than volume. The simplest is the “hit rate”, the number of users in the audience who view the article, material or page, tracked alongside the time of day and week they viewed it.
This is easy to track using Google Analytics, which reports views per page as well as viewership by time of day, day of week, audience demographics and location. Treat reach as a floor, not a finish line: a message that was opened has not necessarily been understood, and a message that was understood has not necessarily changed anyone’s behaviour. Pair readership data with a short comprehension check in your pulse survey.
4. Employee sentiment and culture surveys: What reveals resistance early?
Organisation-wide sentiment and culture surveys are a catch-all yardstick: they reveal broad trends in how people feel, and can surface resistance early, but they are rarely specific to any one initiative.
Some organisations measure employee sentiment or culture across the year, and there are often questions linked to change. These surveys tend to be short and Likert-based, with few open-ended questions for qualitative feedback. Because they go across the entire organisation, they cannot isolate the effect of a particular programme. The stakes of the underlying engagement are real, though: Gallup estimates that low engagement cost the world economy roughly US$10 trillion in lost productivity, about 9% of global GDP. Use the annual survey as a trend signal, and add two or three change-specific pulse questions for each major initiative so the signal is attributable.
5. Change heatmaps: When do they fail, and what works better?
A change heatmap shows how much change each business unit is absorbing, and it starts useful discussions about capacity. Its weakness is that it is usually rated by one or two people, so it carries their judgement and is hard to defend in a decision forum.
Some organisations build heatmaps in Excel to map the extent to which different business units are affected by change. The artefact speaks to the amount of change and often leads to discussion of the capacity the business has to handle and digest it. The problem with most heatmaps is that they are categorised and rated by the creator of the artefact (or a limited number of people making judgements), and are therefore subject to bias. Data based on one person’s opinion also tends not to carry much weight in a decision-making forum. The case for moving to quantified impact over time is made in The death of the change heatmap.
6. Change benefit tracking: How do you track post-launch value?
Benefit tracking measures whether the targeted outcome of the change has actually happened. It is the only one of the six methods that connects directly to the business case, which is why it deserves the most rigour.
Beyond typical change management measures, there are initiative-specific measures that focus on the actual outcome and benefit of the change, with the goal of determining the extent to which the change has taken place. Examples include:
- System usage rates
- Cost reduction
- Revenue increase
- Transaction speed
- Process efficiency
- Speed of decision making
- Customer satisfaction rate
- Employee productivity rate
- Incidents of process violation
Define each benefit, its baseline, its owner and its measurement date before launch. The change management ROI guide shows how to turn these benefits into a business case executives accept.
Measuring change leadership and change maturity
Two measures sit outside any single initiative: change leadership assessment, which looks at the people who drive change, and change maturity assessment, which looks at the organisation’s overall capability to manage it. Both are used at business and enterprise level rather than inside one project.
Change leadership assessment
Change leadership is measured by assessing how well the sponsors, influencers and change agents around an initiative carry out their roles. The evidence is strong that this is worth the effort: in Prosci’s 12th edition benchmarking data, projects with extremely effective sponsors met their objectives 79% of the time, against 27% for projects with extremely ineffective sponsors.
David Miller of Changefirst wrote about three types of change leader:
- The sponsor, whose role is to drive the initiative to success from beginning to end. This involves competencies in rallying and motivating people, building a strong network of sponsors and communicating clearly to different stakeholder groups.
- The influencer, whose role is to use their network and influence to market the change and build the traction required for success. Changefirst identifies four types of influencer:
- Advocates, who are great at promoting the benefits of the change.
- Connectors, who link people across parts of the organisation to support the change.
- Controllers, who control access to information and people, and can include administrators and operations staff.
- Experts, who are viewed by others in the organisation as technically credible.
- The change agent, who is tasked with supporting the overall change in various ways, including promotional activities, engaging different parts of the organisation on the change and influencing up, down and sideways across the organisation to drive a successful outcome.
There is no single industry standard tool for assessing change leadership competencies and capabilities. Changefirst and various smaller consulting firms offer change leadership assessments. One of the most comprehensive is ChangeTracking’s Change Capacity Assessment, a self-assessment organised around four broad categories: Goal Attainment, Flexibility, Decision Making and Relationship Building. Both Prosci and Changefirst also offer sponsor competency assessments.
Pagon and Banutal (2008) called out the key competencies critical in change leadership:
- Goal attainment
- Assessing organisational culture and climate
- Change implementation
- Motivating and influencing others
- Adaptability
- Stakeholder management
- Collaboration
- Building organisational capacity and capability for change
- Manoeuvring around organisational politics
A practical way to use the list is as a short self-assessment and 360 for sponsors and champions at the start of a major programme, then to target support at the two or three competencies where the gap is widest.
Change maturity assessment
Change maturity assessment measures how well the organisation manages change as a repeatable capability, across dimensions such as project change management and change leadership, so that capability gaps can be found and closed in a structured way.
Organisations increasingly recognise that managing change initiative by initiative no longer cuts it, because it does not build organisational learning. Initiatives come and go, and organisations that rely on contractor change managers often find their ability to manage change does not mature across initiatives. Prosci’s data points to the value of consistency: 59% of participants using a structured methodology reported good or excellent change management effectiveness, against 26% of those without one.
Two major change maturity assessment models are widely used in the market: one from Prosci and one from the Change Management Institute. To read more, see our article A New Guide for Improving Change Management Maturity, where we outline how to improve change maturity across business units. At enterprise level, maturity is lifted through programmes, networks and shared tools, which we cover in the enterprise section below.
The three-level model: Project, business and enterprise measures
A comprehensive model of change management measures organises every metric on two axes: the phase of the initiative lifecycle (Plan, Execute, Realise) and the organisational level the metric speaks to (project, business, enterprise). Each layer answers a different question for a different audience, which is why reporting the same metric to all three audiences is the reason so many change dashboards are ignored.
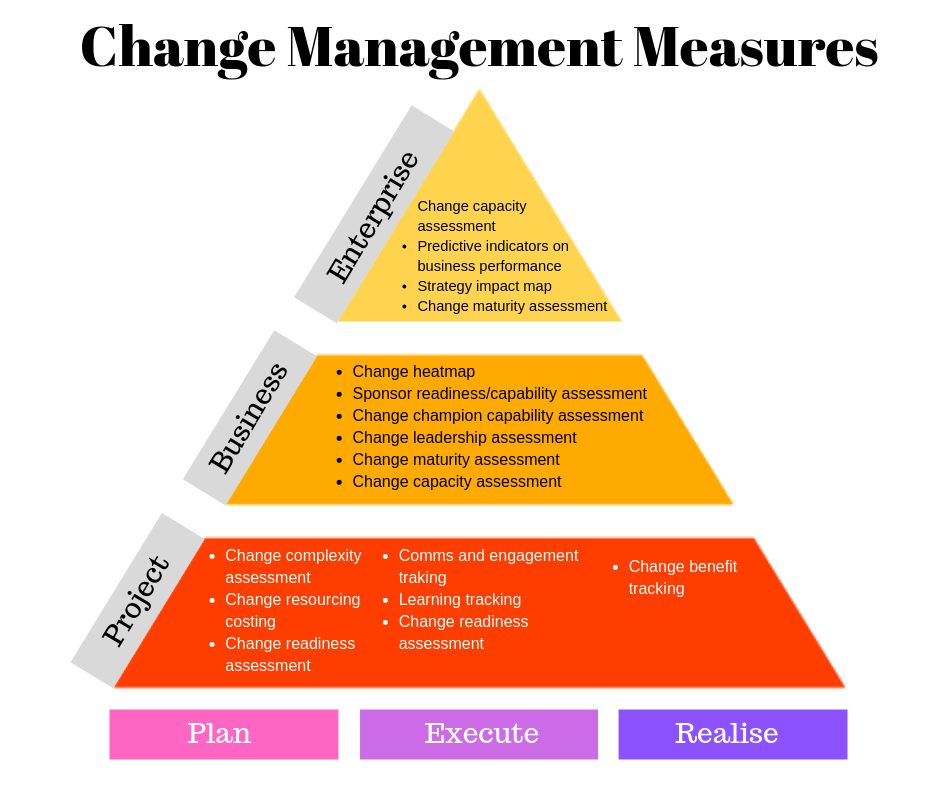
In the diagram, change management measures are plotted along two axes: the different phases of the initiative lifecycle, and the organisational levels of project, business and enterprise into which the measures fall. A project manager needs to know whether stakeholders are ready ahead of go-live. A business unit head needs to know whether a team has room for another change this quarter. A CEO needs to know whether the portfolio of change is pointed at the strategy.
Project-level measures
Project-level measurement answers whether one initiative is on track to land: it measures complexity and cost during planning, readiness, engagement and learning during execution, and benefits after go-live.
‘Plan’ phase
In this phase the team is discovering and scoping the project and the change, so details are not clear at the start. Later in the phase the scope sharpens and the team starts planning the activities needed to implement the change. Measurement here is about sizing:
- Change complexity assessment. Evaluates how complex the project is: how many people could be affected, the size of the impact, how many business units are involved, and whether multiple systems and processes are touched.
- Change resourcing costing. During planning, the cost of the change management stream is established. This includes contractors, communication campaigns, learning costs, travel and administration, to name a few.
- Change readiness assessment. Usually conducted before and during the change. The same set of questions is asked of each stakeholder group to assess readiness. A baseline taken after launch cannot show movement, so the first reading belongs here.
‘Execute’ phase
The execute phase is one of the most critical parts of the project. Activities are in full flight and the team is iterating on the change to achieve project goals. Four measures carry most of the weight:
- Communication and engagement tracking. Effective engagement of stakeholders is critical. Stakeholder interviews, surveys and communication readership rates are all ways of tracking engagement.
- Learning tracking. Measuring learning tracks the extent to which new competencies and skills have been acquired through learning interventions. Typical measures include course tests or quizzes in addition to course evaluations. On-the-job performance can also be used to track learning outcomes and the extent to which learning has been applied at work.
- Change readiness assessment. It continues to be critical during execution. Re-measure at fixed points: at kick-off, 30 to 60 days before go-live and at go-live, using the same questions for each group.
- Sponsor activity. A short check of visible communication, barrier removal and reinforcement is among the cheapest measures to run, and the Prosci data above shows how much sponsor effectiveness matters.
‘Realise’ phase
In this phase the change has gone live and most project activities have been completed. It is anticipated that the change occurs and that benefits can now be tracked and measured.
Change benefit tracking measures and tracks the extent to which the targeted benefits and outcomes have been achieved. Some of these measures are hard quantitative measures; others are soft measures that are more behavioural, such as process compliance, workarounds and incident rates.

Business-level measures
Business-level measurement shows whether a part of the organisation has the right ability, capacity and readiness for the change, and whether the changes landing on it are being adopted.
- Adoption. Adoption is where change management is either proved or exposed. Gartner HR research published in July 2025 found that just 32% of business leaders reported that the last change they led achieved healthy change adoption by employees. Good adoption measurement draws on more than one source: system data on usage and feature depth, process compliance, error and rework rates, team leader observation and customer feedback, tracked over time rather than as a single post-launch snapshot. Two companion guides carry the detail: how to measure change adoption covers the method, including the shape of the adoption curve, and the change adoption metrics framework lists which metrics suit system implementations, compliance programmes and restructures.
- Change heatmaps. Heatmaps help to visualise which part of the business is most affected by one project or by several, and to compare relative impact across businesses. As the number of initiatives increases, so does the complexity of change, and organisations need to graduate from spreadsheets to more capable data visualisation tools to support data-based decisions. To read more about why a heatmap is not the only way to understand business change impact, go to The death of the change heatmap.
- Sponsor readiness and capability assessment. A critical tool for identifying capability gaps in the sponsor so that support can be provided. A strong and effective sponsor can make or break an initiative, so early engagement and support are essential. Both Prosci and Changefirst offer sponsor competency assessments.
- Change champion capability assessment. Change champions and change agents are critical nodes for driving and supporting change in the organisational network. Many champions are appointed for one initiative only. A business-focused champion network means capability can be developed over time and used across multiple initiatives, and assessing and supporting champion capability translates directly into better change outcomes.
- Change leadership and change maturity assessment. Covered in the previous section.
- Change capacity assessment. Where significant change is happening concurrently, careful planning and sequencing of change against existing capacity is critical.
Change capacity and saturation in more detail
Capacity is the business-level measure most often guessed rather than measured. Three aspects should be called out in the measurement process:
- Different parts of the business have different capacity for change. Areas with better change capability, and perhaps better change leadership, are often able to receive and digest more change than businesses without the same capability.
- Some businesses are far more time-sensitive and so their capacity needs to be measured with more granularity. Call centre staff capacity, for example, is often measured in minutes. To plan effectively for their capacity, the impacts of change need to be quantified in a precise, time-bound way so resourcing can be planned in advance, in hours per role rather than “high, medium, low”.
- Change tolerance or saturation level needs careful measurement in combination with operational feedback. Say that last month a part of the business experienced significant change impact across several initiatives at once, and the operational indicators showed an impact on customer satisfaction and productivity, with staff reporting that there was too much change to handle. The change tolerance level may have been exceeded. With the right measurement of change impact levels for that part of the business, the lesson can be used to plan for the same volume of change next time.
Use measurement and data visualisation tools such as the Change Compass to track change capacity. See also our saturation measurement method and the guide to building a change capacity model.
Enterprise-level measures
Enterprise-level measurement compares change across business units and initiatives to show whether the total load and direction of change match strategic intent, and whether the organisation is getting better at absorbing it.
At enterprise level, many of the business-unit measures still apply. The focus shifts to comparing across business units, to make sense of what each part of the business is going through and whether the overall picture is aligned with the organisation’s intentions and strategic direction. Typical questions include:
- Is it surprising that one part of the business is undergoing significant change while another is not?
- Is there a reason one business unit is focused on a few very large changes while others carry a larger set of changes with smaller impacts?
- Is the overall pace of change right for the strategic intent? Does it need to speed up or slow down?
- What process governs, reports and makes decisions on enterprise-level change prioritisation, sequencing and benefit realisation?
- Is one business unit managing change more effectively, faster and with greater outcomes? How can other business units adopt its internal best practices?
Gartner’s October 2025 research found that fewer than half of employees achieved the change goals set by their organisation, a reminder that portfolio-level oversight cannot be left to individual project teams. As the measures diagram shows, the enterprise-level measures include the following.
Change capacity assessment at enterprise level
Does one business unit’s capacity limit mean the organisation cannot execute a critical strategy in the allocated time? If so, how do you create more capacity? Options include more resources such as staff, additional initiative funding, more time, or more talent to lead initiatives.
Change maturity assessment at enterprise level
At enterprise level the concern is the overall change maturity of the organisation. The question is how to implement enterprise-level interventions that build maturity through programmes, networks and exchanges, such as:
- Enterprise change capability programmes
- Enterprise change analytics and measurement tools
- Enterprise change methodology
- An enterprise network of change champions
Strategy impact mapping
Change management need not focus only on project execution or business-unit capability. It can also demonstrate value at enterprise level by focusing on strategy execution, which by definition is change. A strategy impact map visualises how different strategies exert impact on business units, so stakeholders can see which initiatives within which strategic intent affect which business units. In the example below, each of the organisation’s strategies is displayed with its initiatives branching out. The width of each initiative reflects the level of impact it has on the business over a pre-determined period, so the width of each strategy also shows its overall relative impact.
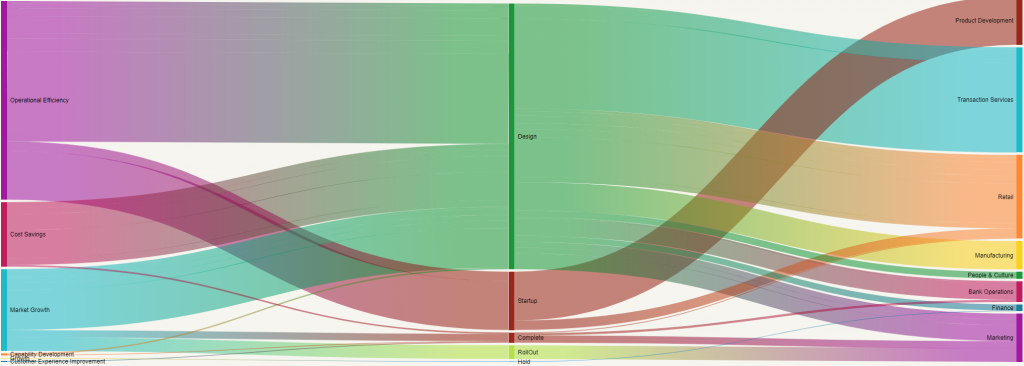
This data visualisation can be valuable for business leaders and strategic planning functions because it shows how the implementation of different strategies is affecting business units. It helps planners understand strategy implementation impacts, potential risks and opportunities, and balance the pace of change against strategy goals at various points in time.
Predictive indicators on business performance
We started this guide by noting that data is all around us and that we should use it to manage change better. With quantitative data on change impact, it is possible to test for correlations with operational business indicators such as customer satisfaction and service availability. Where a significant correlation exists, predictive reporting can forecast the trend of those performance indicators given planned change impacts.
In the graph below, historical data is used to establish correlations and forecast future impact on business indicators. The example focuses on the customer contact centre, with average handling time as the key business indicator. If heavy change periods consistently coincide with longer handling times, the business can adjust sequencing before the next peak.
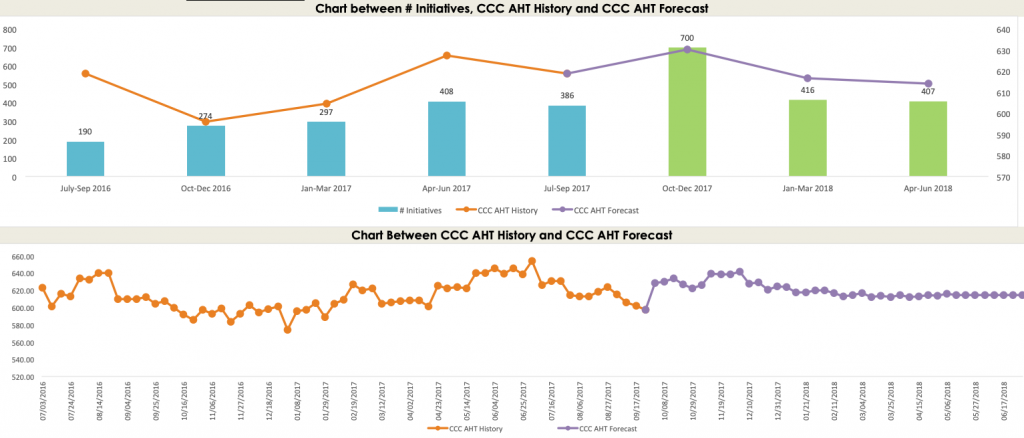
This type of predictive performance forecasting is extremely valuable for organisations undergoing significant change that want to understand how it may affect business performance. By demonstrating the impact on business indicators, it puts the importance of managing change at the front and centre of the decision-making table. At The Change Compass we are developing this type of measurement and reporting function. It is the frontier for change management: being established as a business-driving function rather than a standard back-office one.
Building the measurement system: A five-step framework
A measurement system is a short list of defined metrics, a baseline, a reporting rhythm and an owner for each number; without all four, the data does not change any decision. The five steps below cover the full lifecycle, from pre-change baseline through to sustained adoption tracking, and reflect the approach used by experienced change practitioners and data-driven change teams.
- Establish a change measurement framework. Define what you are measuring and why before selecting metrics. A framework should cover three kinds of metric: activity metrics (what the change team is doing), readiness metrics (how prepared people are) and adoption metrics (whether people have actually changed their behaviour). Choose a short list across the three levels, three to five per initiative plus a few portfolio measures.
- Set a baseline before the change. Measure the current state before the change is implemented. Without a baseline it is impossible to demonstrate the impact of the change management effort or to identify where readiness is lowest.
- Track readiness at key milestones. Conduct readiness assessments at defined points, typically at the start of the programme, 30 to 60 days before go-live and at go-live. Assessments should cover awareness, understanding, capability and commitment for each affected stakeholder group.
- Measure adoption after go-live. Track adoption in the weeks and months after go-live. Key indicators include system usage rates, process compliance, error rates, workaround behaviour and performance recovery back to baseline.
- Report and act on the data. Use measurement to drive decisions, not just to report status. When adoption lags in a specific group, use the data to identify the barrier and target an intervention.
Cadence and governance
Match the cadence to the decision. Readiness is measured at milestones; adoption weekly, then monthly after go-live; capacity and change load monthly or quarterly alongside planning forums. Name who owns each metric, who reviews it and what happens when a threshold is crossed. Every chart on a dashboard should have a question, a threshold and an owner. Our guide to designing a change adoption dashboard shows how to build the view itself.
Data integrity before you present
A single visible error in a change dashboard is enough for a steering committee to discount the rest. Reconcile counts to source systems, state the sample size and response rate for any survey, keep definitions stable between reporting periods and flag where a figure is an estimate. It is better to show fewer metrics you can defend than many you cannot.
Telling the story
Numbers move decisions when they are framed against something leaders already care about: a milestone, a benefit, a risk. Lead with the decision you need, show the two or three numbers that justify it, and keep the detail one click away. A number plus an action (“adoption in the claims team is 20 points behind, and the barrier is the approval step”) is a briefing; a number alone is a report. Our follow-on guide, measuring change management outcomes, extends this reporting approach.
Where digital tools fit
Manual measurement stops scaling when the number of concurrent initiatives grows: survey results sit in one place, impact assessments in a spreadsheet and adoption data in a third system, and nobody can see the portfolio. Survey tools such as SurveyMonkey and Microsoft Forms, and web analytics such as Google Analytics, remain useful for the project-level methods above. A purpose-built change intelligence platform such as Change Compass brings impact, capacity and adoption data into one model, so the business and enterprise measures (load by business unit, saturation, predictive links to operational indicators) become routine reporting rather than a quarterly analysis project.
Which guide to read for which question
This page is the map; the guides below are the depth. Each answers one question completely, and between them they cover every sub-topic summarised above.
- “Which five metrics should I put in front of leadership?” How to measure change management success: five metrics leaders actually use
- “What adoption metrics suit my type of initiative?” Change management adoption metrics: the complete tracking framework
- “How do I actually measure adoption over time?” How to measure change adoption
- “How do I report outcomes and build executive trust?” Measuring change management outcomes
- “Are people ready?” Change readiness assessment
- “Is the business overloaded?” How to measure change saturation
- “How mature is our change capability?” A new guide for improving change management maturity
Start with the decision, then pick the number
The best measurement systems begin with a single question that a senior leader is already asking, such as “will this go-live hold our service levels?” or “which division cannot take another change this quarter?”. Pick the three to five numbers that would answer it, set a baseline this week, and put the first reading in front of the sponsor within a month. A small set of metrics with owners and thresholds beats a comprehensive scorecard that nobody acts on.
From there, extend upward. Add business-level capacity and adoption views once the project metrics are stable, then portfolio and strategy views as the enterprise starts asking comparative questions. Change can be measured, and the methods in this guide show operational and strategic ways in which measurement demonstrates real value. Most corporate functions cannot exist without data and analytics. Human Resources relies on people and pay data. Marketing cannot function without measurement of channel and campaign effectiveness. For Information Technology, almost everything is measured, from system usage to cost to efficiency. It is time to use data to visualise change, plan better and make business decisions with the same standing.
Frequently asked questions
What is change management measurement?
Change management measurement is the practice of tracking whether change activities are producing the intended behaviour and business results. It works at three levels: project metrics (readiness, engagement, learning), business metrics (adoption, capacity, benefits) and enterprise metrics (portfolio load, strategy impact, maturity). Reporting on all three lets you link change effort to the outcomes in the business case.
What are the most important change management metrics to track?
Focus on adoption rates, readiness scores, communication engagement and benefit realisation, tailored to the project phase and the business unit’s capacity. Prosci recommends three to five metrics per initiative, each with a purpose, an owner and an action threshold, with a handful of portfolio measures added on top.
How do you measure change readiness effectively?
Combine pulse surveys with behavioural indicators and sponsor assessments, and repeat the same questions at fixed milestones so results are comparable. Balance frequency with depth so that the results are actionable. Read our guide to measuring change readiness with data, not just surveys for the full method.
Why replace change heatmaps with other visuals?
Heatmaps introduce subjectivity bias because they are usually rated by one or two people. Timeline charts and capacity dashboards built from quantified impact give clearer, more defensible data for decisions. See The death of the change heatmap.
What role does AI play in change measurement?
AI supports sentiment analysis of free-text feedback, predictive capacity planning and automated risk detection across initiatives, and some platforms offer natural-language queries for instant answers. Its value depends on the quality of the underlying data: it speeds up analysis of well-defined metrics, but it cannot compensate for a missing baseline or unclear definitions.
What enterprise-level change metrics matter most?
Strategy impact mapping, cross-business capacity analysis and predictive performance forecasting that links change volume to operational outcomes. Together they show whether the pace and direction of change match strategic intent, and whether the organisation is getting better at absorbing it.
How often should change be measured?
Match the cadence to the decision. Readiness is usually checked at the start, before go-live and at go-live. Adoption is tracked weekly or fortnightly in the first months after launch, then monthly. Portfolio measures such as change load and capacity are reviewed monthly or quarterly alongside planning and governance forums.
References
- Miller, D. (2011). Successful Change: How to implement change through people. Changefirst Ltd.
- Pagon, M. and Banutal, A. (2008). Leadership Competencies for Successful Change Management. Study report, University of Maribor.
- Prosci (2026). Built to Change: Measuring what actually predicts ERP success
- Prosci (2023, 12th edition data). Change management best practices
- Gartner (8 July 2025). Gartner HR Research Finds Just 32% of Business Leaders Report Achieving Healthy Change Adoption by Employees
- Gartner (9 October 2025). Gartner HR Research Finds Less Than Half of Employees Achieved the Change Goals Set by Their Organization
- Gallup (7 April 2026). Global engagement falls for the second time since the pandemic
This guide focuses on the complete measurement framework, design, run, and report change measurement end-to-end. Three closely related guides on this site each cover a distinct angle, pick the one that matches what you need now:
- If you want proving overall change success to leadership → How to Measure Change Management Success: 5 Metrics That Prove Impact
- If you want tracking adoption specifically → Change Adoption Metrics: What to Track and How to Report It to Leadership