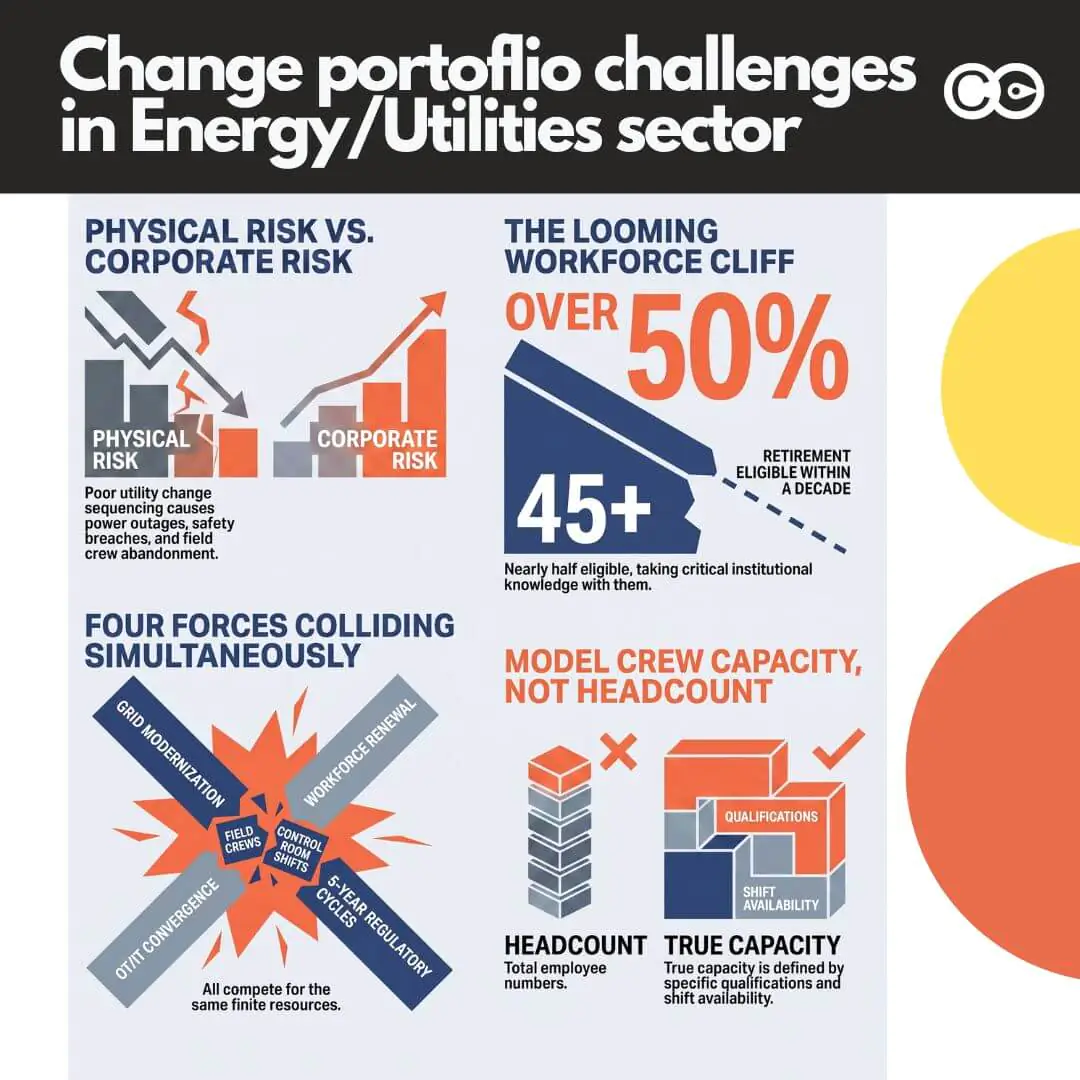
How transformation leaders in energy and utilities sequence grid modernisation, workforce renewal, OT/IT convergence and AI using change portfolio management.
How transformation leaders in energy and utilities sequence grid modernisation, workforce renewal, OT/IT convergence and AI using change portfolio management.
Financial services transformation refers to the structured programmes through which banks, insurers, wealth managers and capital markets firms reshape how they deliver value, manage risk and operate at the front, middle and back office. It is not a single category of...
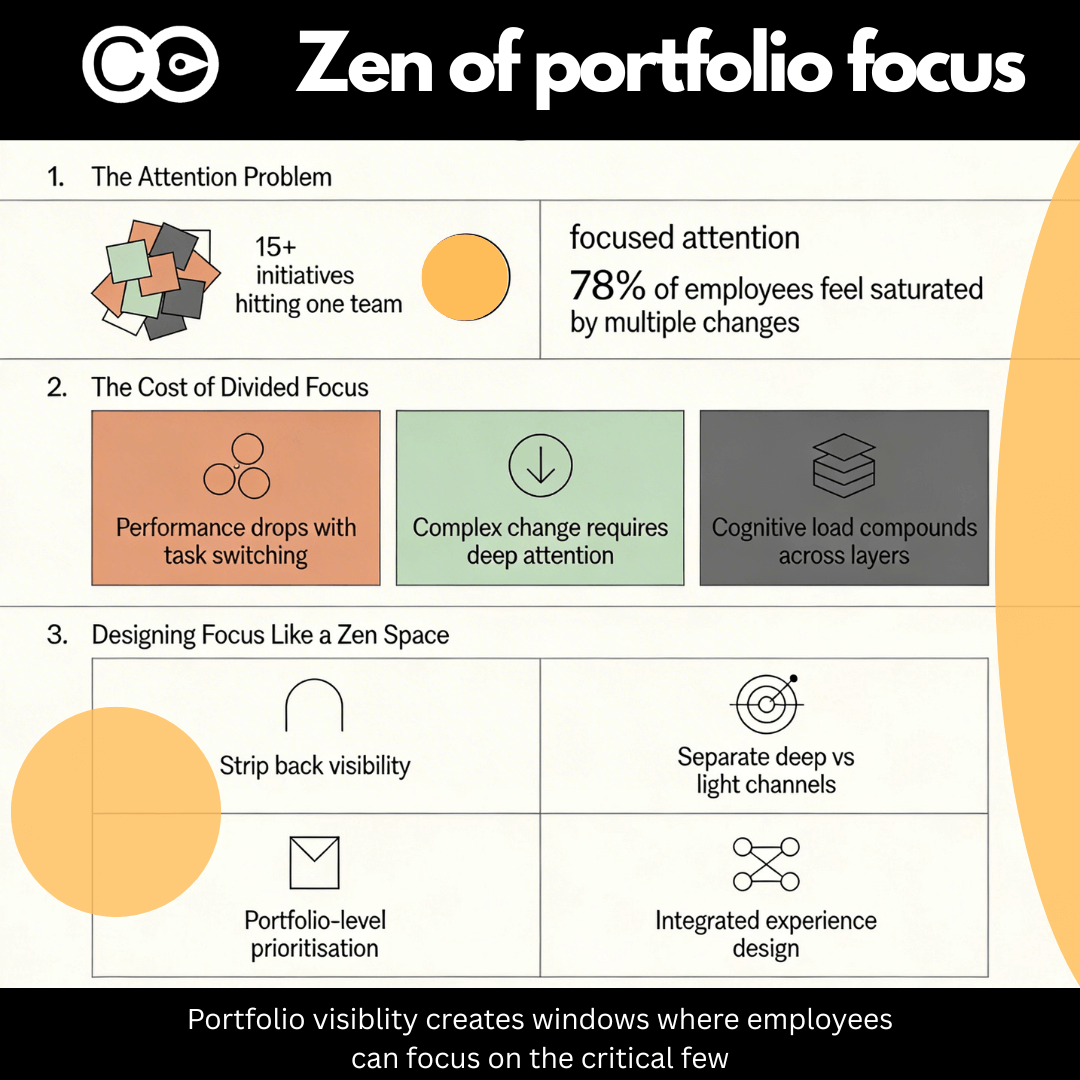
Most organisations now compete on how much change they can push through the system. Very few compete on how well they design focus. Travelling through Japan, visiting zen temples and the art islands of Teshima and Naoshima, I was struck by how intentional design...

Most organisations anticipate disruption around go-live. That's when attention focuses on system stability, support readiness, and whether the new process flows will actually work. But the real crisis arrives 10 to 14 days later. Week two is when peak disruption hits....
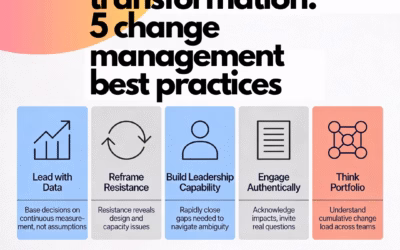
Managing organisational change at scale is the systematic application of methodology, leadership behaviour and operational discipline to take large groups of people from current ways of working through to new, embedded ways of working. The best practices that...
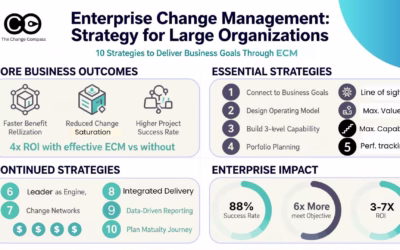
An enterprise change management strategy is the deliberate, multi-year plan that determines how an organisation will build and apply change capability at scale across every business unit, programme and transformation initiative. It covers the operating model...

Change saturation is the operational condition where the volume, pace and concurrency of initiatives demanded of an organisation's workforce exceeds the capacity those teams have to absorb new ways of working. Symptoms include declining adoption rates, missed go-live...
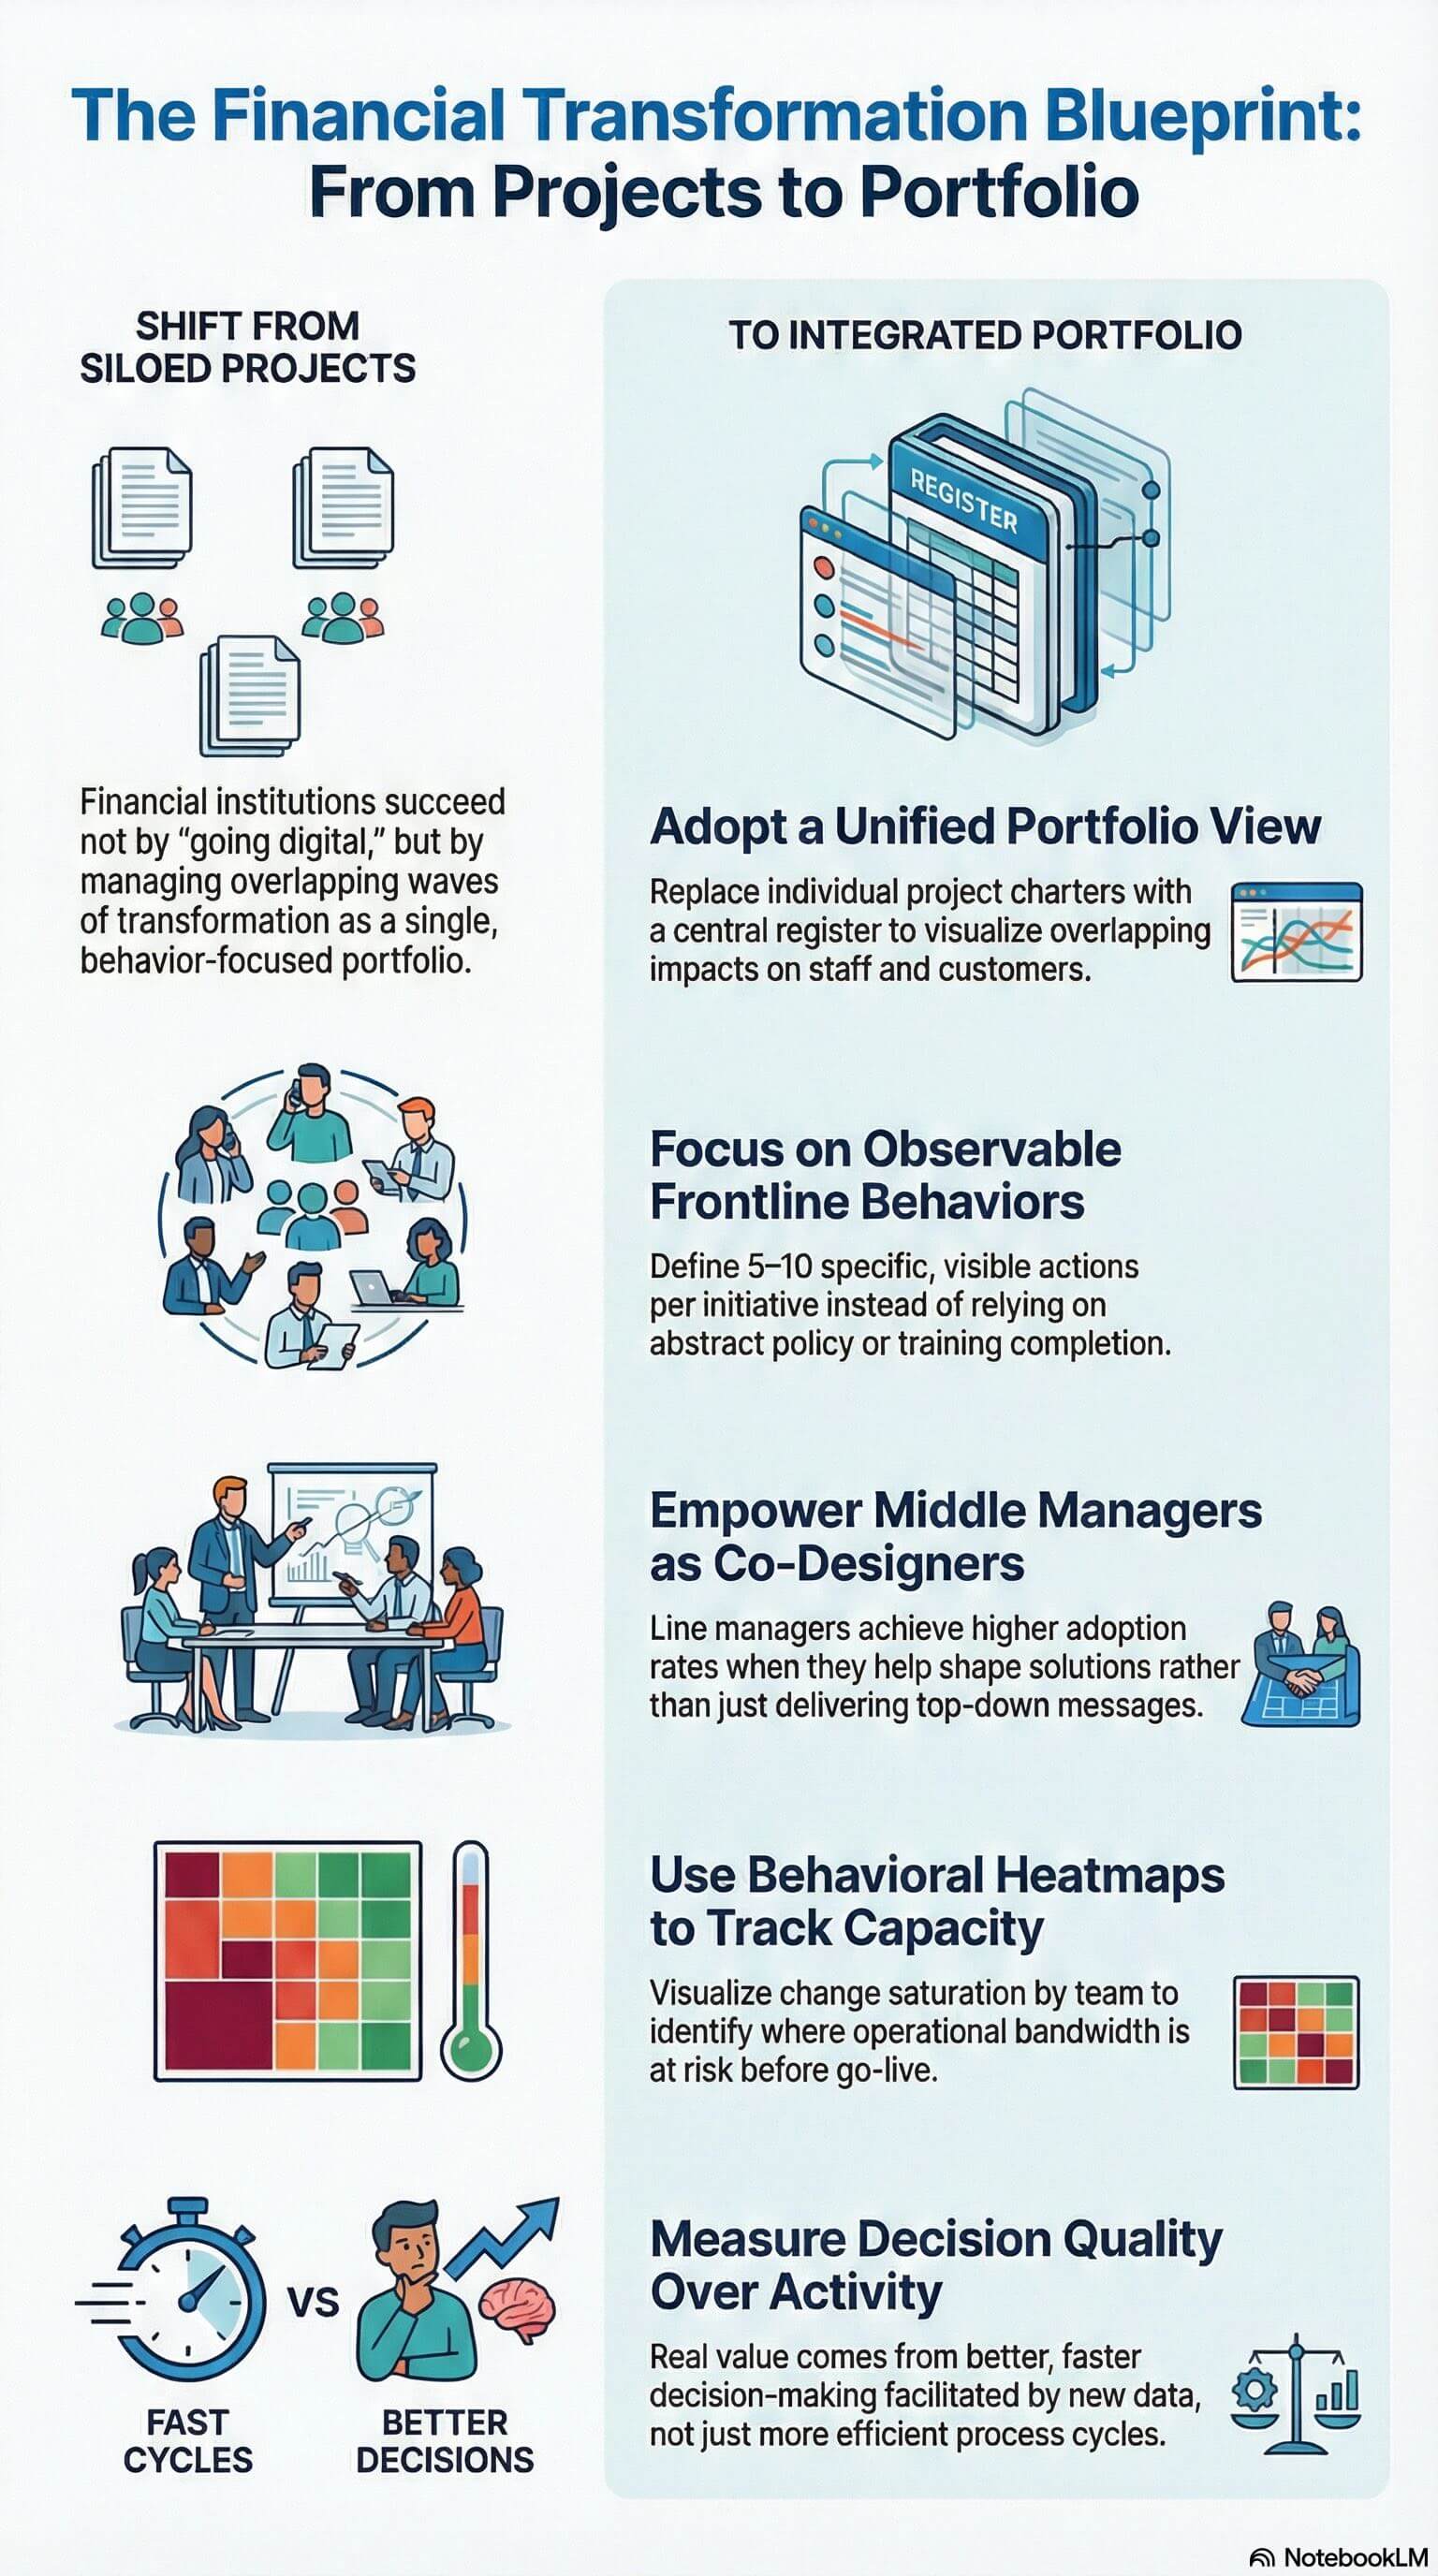
What is enterprise change management? Enterprise change management represents a fundamental evolution beyond traditional project-based change approaches. Rather than treating change as a series of isolated initiatives, enterprise change management (ECM) establishes...

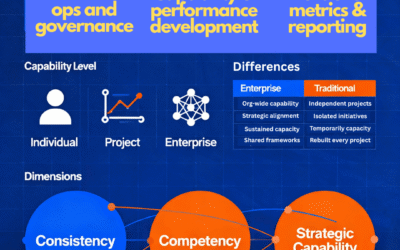
Understanding the real distinction between traditional, project-focused change management and the practice of enterprise change management (ECM) opens the door to a structured approach to genuine organisational agility and resilience. While project-based...

When navigating the complexities of organizational change, leaders often rely on analogies to communicate the journey and keep their teams motivated. One common analogy used in traditional change management is the “light at the end of the tunnel,” which portrays the...
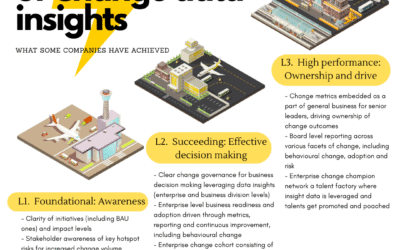
Why Change Data is the Hidden Superpower Every Business Leader Needs The Untapped Potential of Change Data For years, many senior leaders have viewed organisational change as an art, a blend of communications, stakeholder engagement, and leadership sponsorship. While...

In today’s fast-paced business environment, most organizations are engaged in numerous change initiatives, including organizational transformation, simultaneously. These initiatives might range from digital transformation efforts to restructuring, new product...