From the beginning of civilizations, storytelling is a way to help us understand what is happening. In caveman paintings, the pictures reveal a lot about the significance of the pictorial story and the message being conveyed. Cave art is considered to have symbolic or religious purposes. Even oral stories can be passed down from generation to generation for thousands of years. The bible is an example of how stories can be passed down and documented. Children’s fairy tales are also examples of powerful stories.
Stories are easily remembered and inspire understanding and belief. This is why the industry of influencers is such a large market. We connect to influencers because we associate with them, find them interesting, or aspire to be them. Influencers share their everyday stories with us and through this, we grow increasingly connected and engaged with the messages they are conveying.
Here is an example of powerful storytelling. The Australian Broadcast Corporation which is a public TV channel aired a show called ‘War on Waste’. The purpose was to inspire the public to change personal habits to reduce waste. The show was hugely powerful.
A report by the University of Technology Sydney’s Institute for Sustainable Futures found that the show triggered 452 high-impact waste reduction initiatives. These include supermarkets and hospitality businesses deciding to remove plastic straws from their stores in Australia and New Zealand, and states banning single-use plastic bags. Almost half of the 280 organisations surveyed in the report based their waste reduction ideas from the show. These were all just 6 months after the show had aired.

Imagine using the power of storytelling with change management data?
Yes, we’ve all been there. Remember the last time that you were at a meeting where there were lots of figures and data thrown around. With each PowerPoint slide, the presenter aimed to cover as much information as possible. An hour later, what did you remember from all the various data points shared? Probably not much beyond one or two points at the most.
This illustrates the power of storytelling. Rather than flashing lots of data at the audience, telling stories is a much more powerful way of conveying messages. In this guide, we will cover various facets of how to convey powerful messages through storytelling with change management data.
1. Types of change management data
Collecting and sharing change management data is critical throughout the implementation of the change process. It tells the impacted stakeholders where the change is taking them and is also essential to help stakeholders understand whether things are on track or not.
In this guide, we will not cover in-depth the various types of change management data. However, the key types of change management include:
- Change readiness surveys
- Training assessments & evaluation surveys
- Communications metrics
- Employee sentiments/culture survey
- Change adoption tracking
- Change leadership assessment
- Change maturity assessment
- Change management heatmap
- Other capability assessments (e.g. sponsor, change champion)
- Various change impact charts
For a comprehensive article on change management data visit The Ultimate Guide to Measuring Change.
2. How to tell change-data-based stories
1) Providing solid context
A. History
In any business meeting context is critical. Whether you are in a meeting to make a key decision, to brainstorm ideas, to critique an idea, or to track team progress, the context of the meeting is critical. Without a strong and clear context, participants will not understand what the meeting is about nor why they are there.
When I was at Intel, in every meeting room there is a poster listing key meeting effectiveness etiquette points. One of the most important points listed is having a clear meeting agenda prior to the meeting starting. Even before you walk into the meeting, ensure that you have already communicated to participants what the context of the meeting is and what you will be discussing. This could be as simple as listing this clearly in the meeting invite agenda or sending a clear email to participants prior to the meeting.
If the subject matter is particularly complex it may be helpful to send an email of any ‘pre-read’ materials so that audience has time to digest various content prior to the meeting. This is particularly important if the subject area is complex and requires a lot of information context-setting prior to the meeting.
When you first enter the meeting it is also important to once again establish the context of the meeting in case your participants did not read the agenda or are not clear.
B. Crafting the story
Crafting a meaningful and compelling story that resonates with your audiences is not difficult. However, it follows a logical flow. The challenge is to craft the story in a way that achieves the balance of painting the storyline that gives the user sufficient ‘colour’ of the plot, without having too much detail and overwhelming the audience. On the other hand, storylines that have too few details are may not be compelling or impactful.
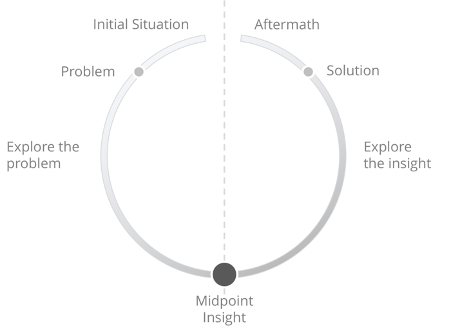
Here is a useful structure to follow – The story structure ring by Tomas Puego.
This structure can be applied to any story and is particularly suited to business settings.
If you are making a presentation to managers to senior managers who are often impatient and have little time you will need to tweak your storyline and flow accordingly. Whilst the bulk of the storyline structure ring can still apply, it is better to add to this an initial step on the key takeaway right at the beginning of the presentation.
- Initial situation. This is when we show what the situation was like when everything was normal and prior to the problem occurring. This is an important part before it reminds the audience what the situation was like before the problem started.
- Problem. Here we explore what the problem is and what happened. Go into what this means for various characters and their lives. What’s the result of the problem and what pains did it cause? What has the characters tried to do to resolve the problem? What has or has not worked?
- Midpoint insight. This is a key reflection of the story when there is a particular revelation or insight that changes the storyline. With the new insight characters realise something they did not previously.
- Explore the insight. Explore what lead to the insight, and what the insight meant to the characters. How do the characters see the problem in the new light? Did the characters approach the problem incorrectly and now with the new insight they are able to see what was wrong?
- Solution. The character(s) finally realise how to apply the solution using the insight. It could be a series of struggles of trial and error. It could be using data-based insights.
- Aftermath. After implementing the solution the characters are able to address the problem and resolve the pain. If you are making recommendations in a business context, this may not have happened yet. Instead, you can use this step to outline what will be the aftermath after applying the solution.
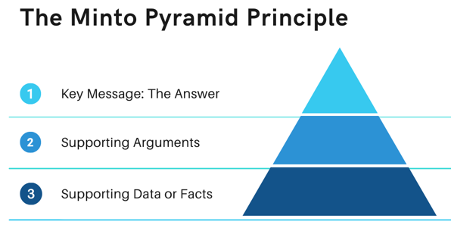
3. Presenting to managers or within limited time
This is proposed by the Barbara Minto Pyramid model whereby there is a pyramid of information that is recommended using a top-down presentation structure. It starts with the end or the conclusion first to satisfy the informational needs of those impatient managers and also to create curiosity from which to engage the audience and present through the rest of the storyline.
In this way, the audience does not get flooded with a myriad of information, data, and arguments and is able to clearly understand where the story is going from the outset.
The other highlight of using the model is to summarize key points at a high level first before going into the details of each point. This way you’ve already provided a structure of the storyline of what the top-level points are before you start diving into each point. This is critical because without the structure it is easy for your audience to get lost in the details.
The Minto model is very useful for those who rely on PowerPoint or document-based presentations where they walk the audience through the materials. This is common practice and it may be easier from a preparation perspective since the content prompts the presenter on what to say. A better way of storytelling is always to rely on verbal storytelling at least in the beginning to engage the audience and fully connect with them before launching a series of slides.
If you are only relying on slides to make your points there is a big risk that your audience is spending more attention looking at the words and details of what you have shown in the slides and this may conflict with what you are talking about. If what you are saying is not what the audience is reading into on the slide content this may create confusion. Slides are good at the right time with the right content to complement what you are saying, not the other way around.
In presenting to managers you also need to be very summarised in your overall presentation. Err on the side of talking at a high level with some illustrations of details. Prepare more detailed data and information as needed so that if asked to elaborate you’re able to dive into the details. However, the flow of the presentation should be fairly succinct and to the point. Often, your presentation may be shortened due to other agendas running longer than expected. It pays to be focused and summarised in your presentation.
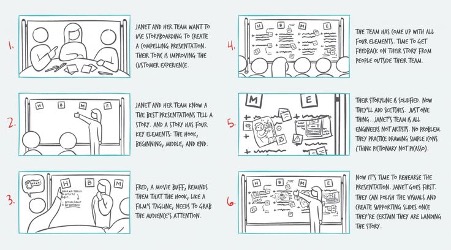
4. Storyboarding
Storyboarding is a way to graphically show the flow of the story. Whilst it is a common technique in product development or learning content development, it originated from film/play development.
For screenplays, storyboarding is about physically drawing out each key scene to outline the overall story. Stick figures are sufficient and the drawings do not need to be artworks. They are simple depictions of what key scenes would visually look like.
Think about the angle of each scene, what the main characters are, what happens, and where it happens. Then for each scene, write brief short bullet points describing what happens in each scene. Use quotes as needed to portray what characters are saying.
In business, a lot of people don’t visually depict the storyboard, instead, reply on comments for each scene. More visually explicit stories will be more powerful, so it is better to practice to visually draw out scenes along with written notes. It helps you to picture clearly and visually the characters you are centering on, how they are behaving, and what situations or environments they are in.
You also don’t necessarily need to make the story a long and drawn-out one. A storyboard can be as simple as 3 scenes. A more rich story outlining the setting and context can be longer. Try to stick to no more than 6 scenes when you work on your storyboard. This will enable you to have ample content to outline the development of the story, the climax, and the outcome of the story.
To learn more about crafting different change stories read our article on How to tell stories of change.
2. Visualisation
A.Simplicity with visuals
After you’ve crafted a story, it’s time to work on what data visualisation to show in your presentation or discussion.
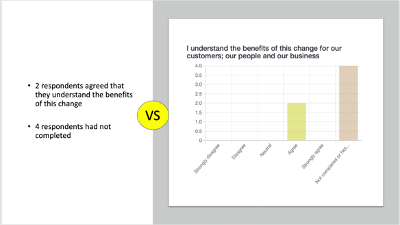
Principle 1: Visual charts
The first principle to remember is to always error on showing charts versus raw numbers. Charts are inherently more memorable and in general more impactful for most people. Of course this depends on exactly the point you are trying to make. Even if you are comparing the data across two areas of the business it’s still a better idea to show a simple bar chart with the 2 data points, versus just quoting the raw numbers. The simple bar chart will visually show the difference between the 2 numbers visually, and you can still show the actual numbers in addition.
Principle 2: Less is more
There is a tendency for business people to show lots of charts in meetings. The thinking is that the more information that is shown, there will be greater clarity and fewer questions. In fact, the reverse is true. The more data you show, often this leads to confusion and lack of clarity. It is harder to stick to a simple storyline when the audience is overwhelmed by lots of data.
The charts are only there to illustrate and support your storyline. The immediate reading of the chart should relate directly to the point you are making. If the chart is conveying lots of other information, be careful. This can launch other questions and discussions and therefore lead the flow of the story away from what you had intended.
Where possible, stick to 2 or 3 charts for your presentation. You can always have a few backup charts if your audience wants to dive into further details. Again, the key focus is on you telling the story and the key medium of communication. The charts are a supporting medium to make things visual, and easier to understand and remember.
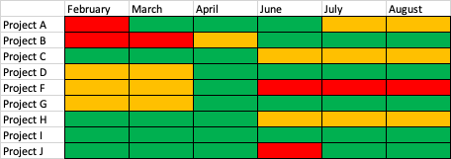
Principle 3: Avoid visual distractions
This principle is about the chart is focused on the message being delivered and avoiding any visual distractions that could create ‘noise’ and distraction for the audience. These include any graphic design, use of colour, lines, sizing, etc.
Below is an example of a typical change heatmap table chart used to depict the level of change impact across different projects. Let’s take a closer look.
3. Using different charts
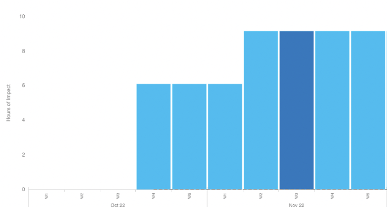
A. Focusing attention on the right part of the chart
To help the user zoom in on the point that you are making, your data visualisation should also draw attention to the point that you are making. Use colour highlighting to draw your audience’ attention to the data point you are focused on.
For example, to draw attention to the particular week that you wanted to highlight to the audience, use a darker shade of the same colour to the rest of the charts to draw the focus. But be aware that using too many different colours may end up confusing the audience instead. This is preferrable than using a circle to highlight the same data point, since this may also be another source of visual ‘noise’ in distracting the user.
B. Using pie charts
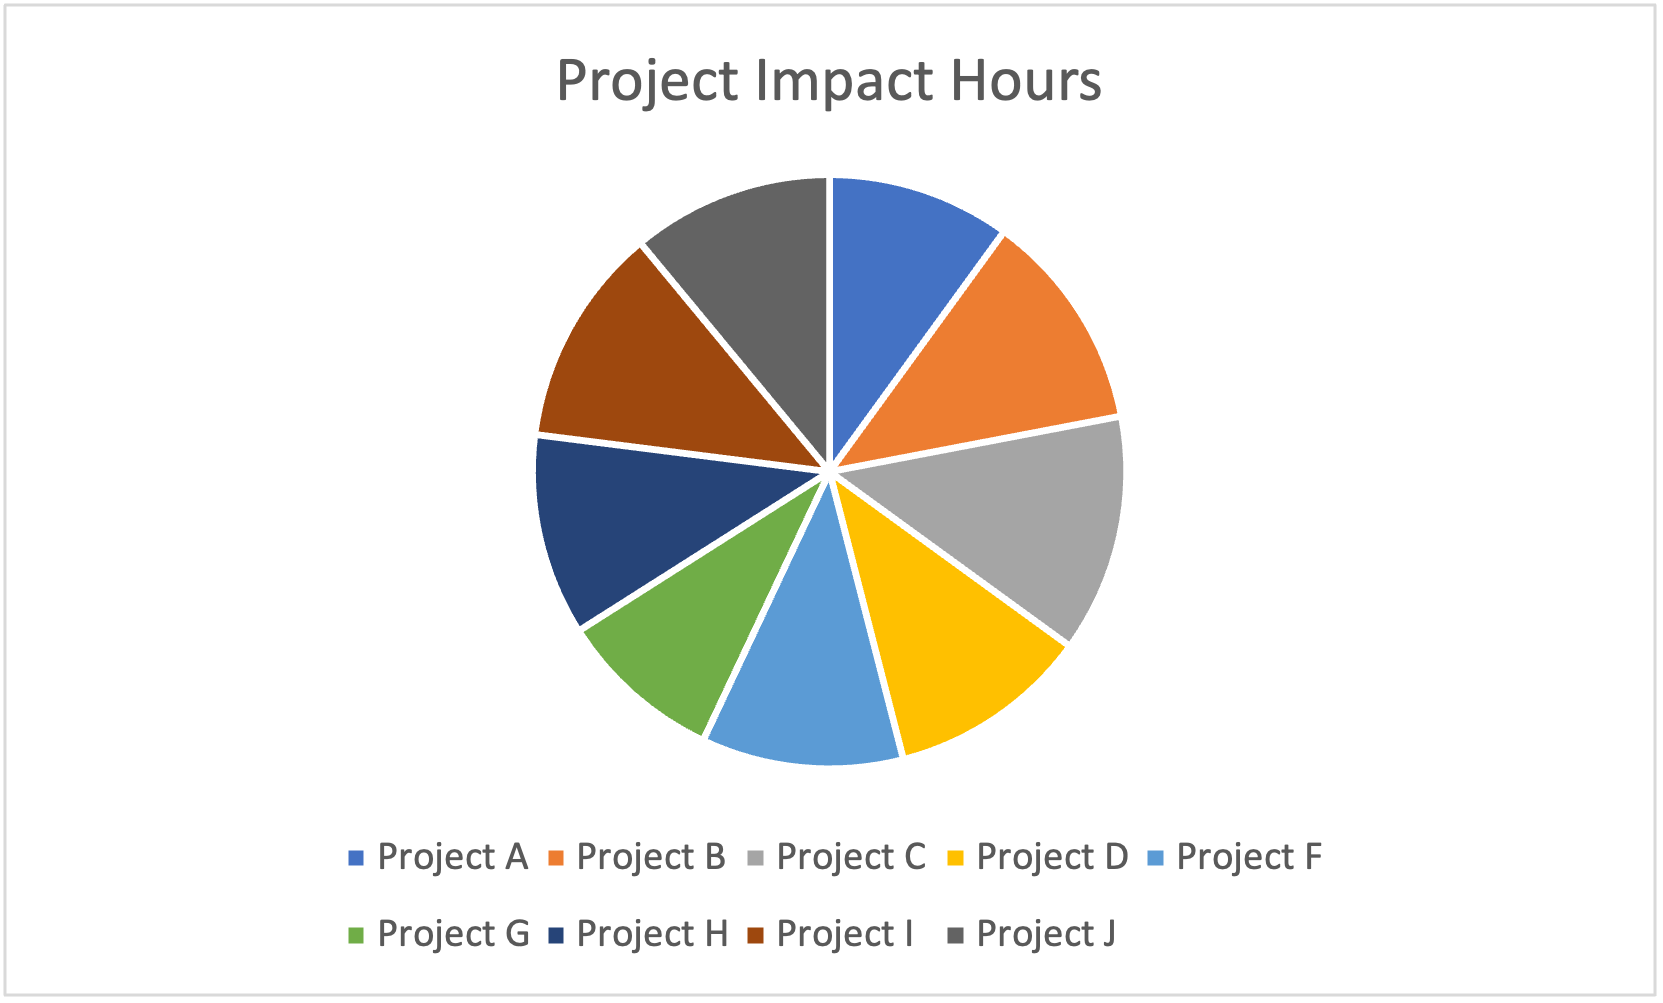
Pie charts are very popular with business users. They are useful and effective in comparing different data points. However, when there are too many data points, it becomes quite hard for the user to read and compare the different data points. For this reason, be very careful in using pie charts. When you are using more than three to four data points in the same pie chart, it may be better to use other charts such as bars charts or line charts. This is particularly when the data points in the chart are similar in value.
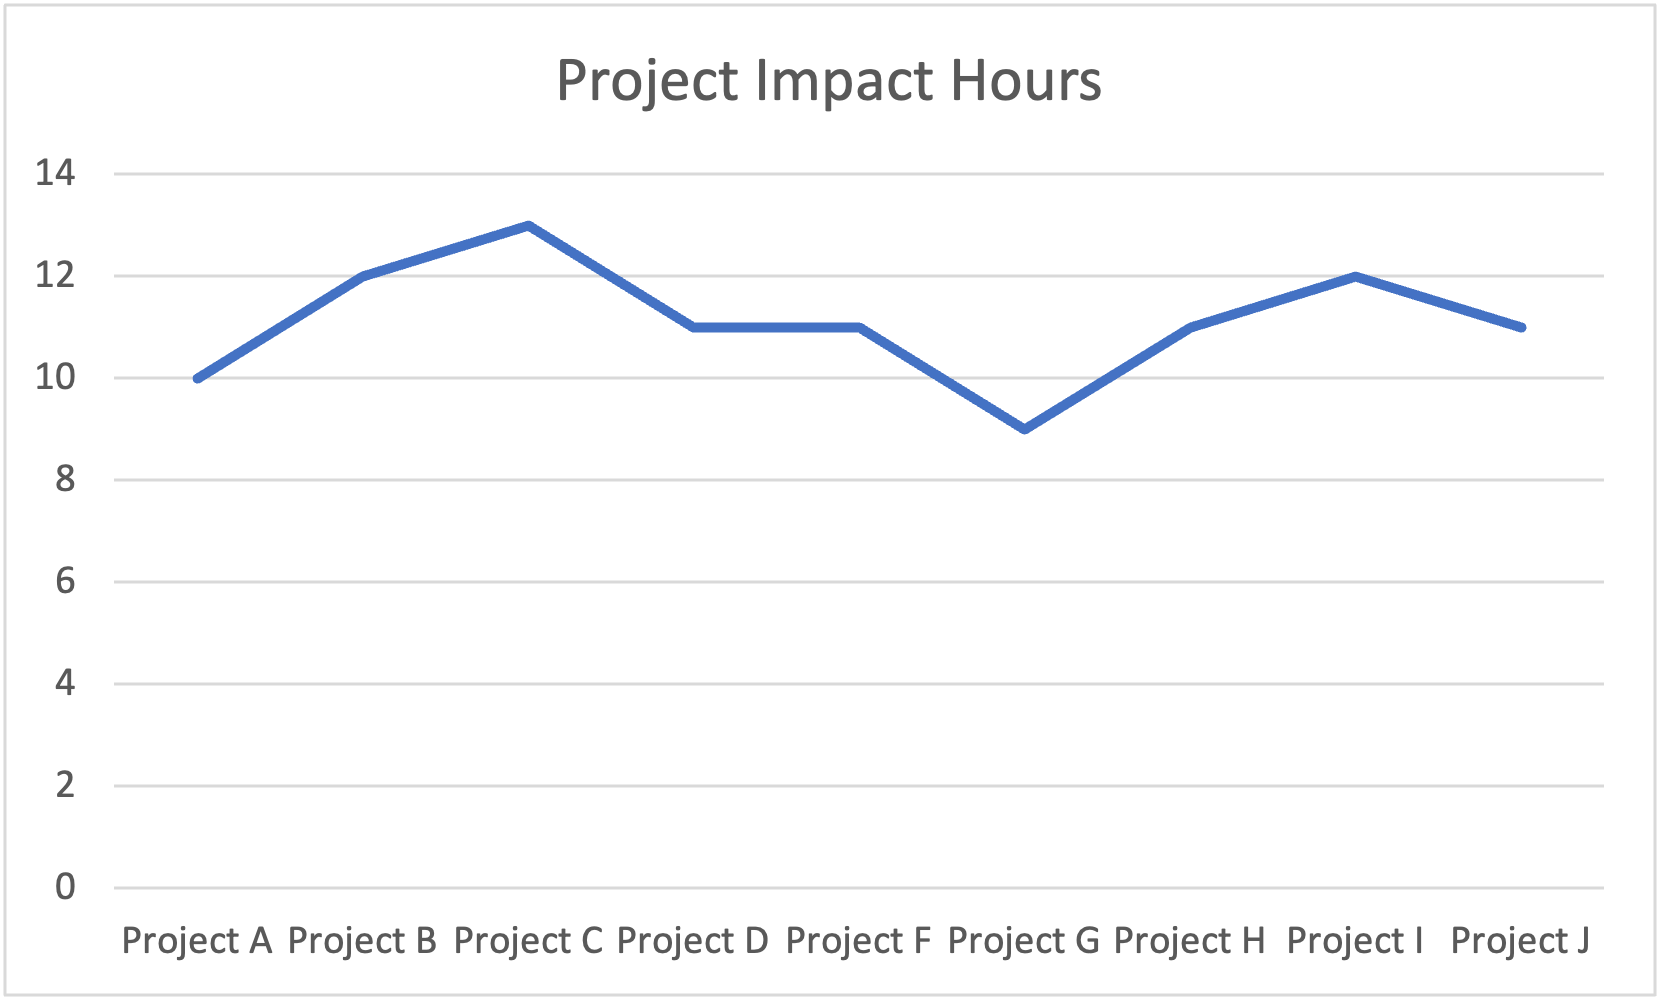
Have a look at the below 2 charts. One created using a pie chart and the other using a line chart. Both are exactly the same data. You can see that with the pie chart it is almost impossible for the audience to tell which Project has more impact hours than the others. Comparing the data points within the pie chart is extremely difficult. On the other hand, looking at the line chart it is significantly easier to decipher the data difference across the projects.
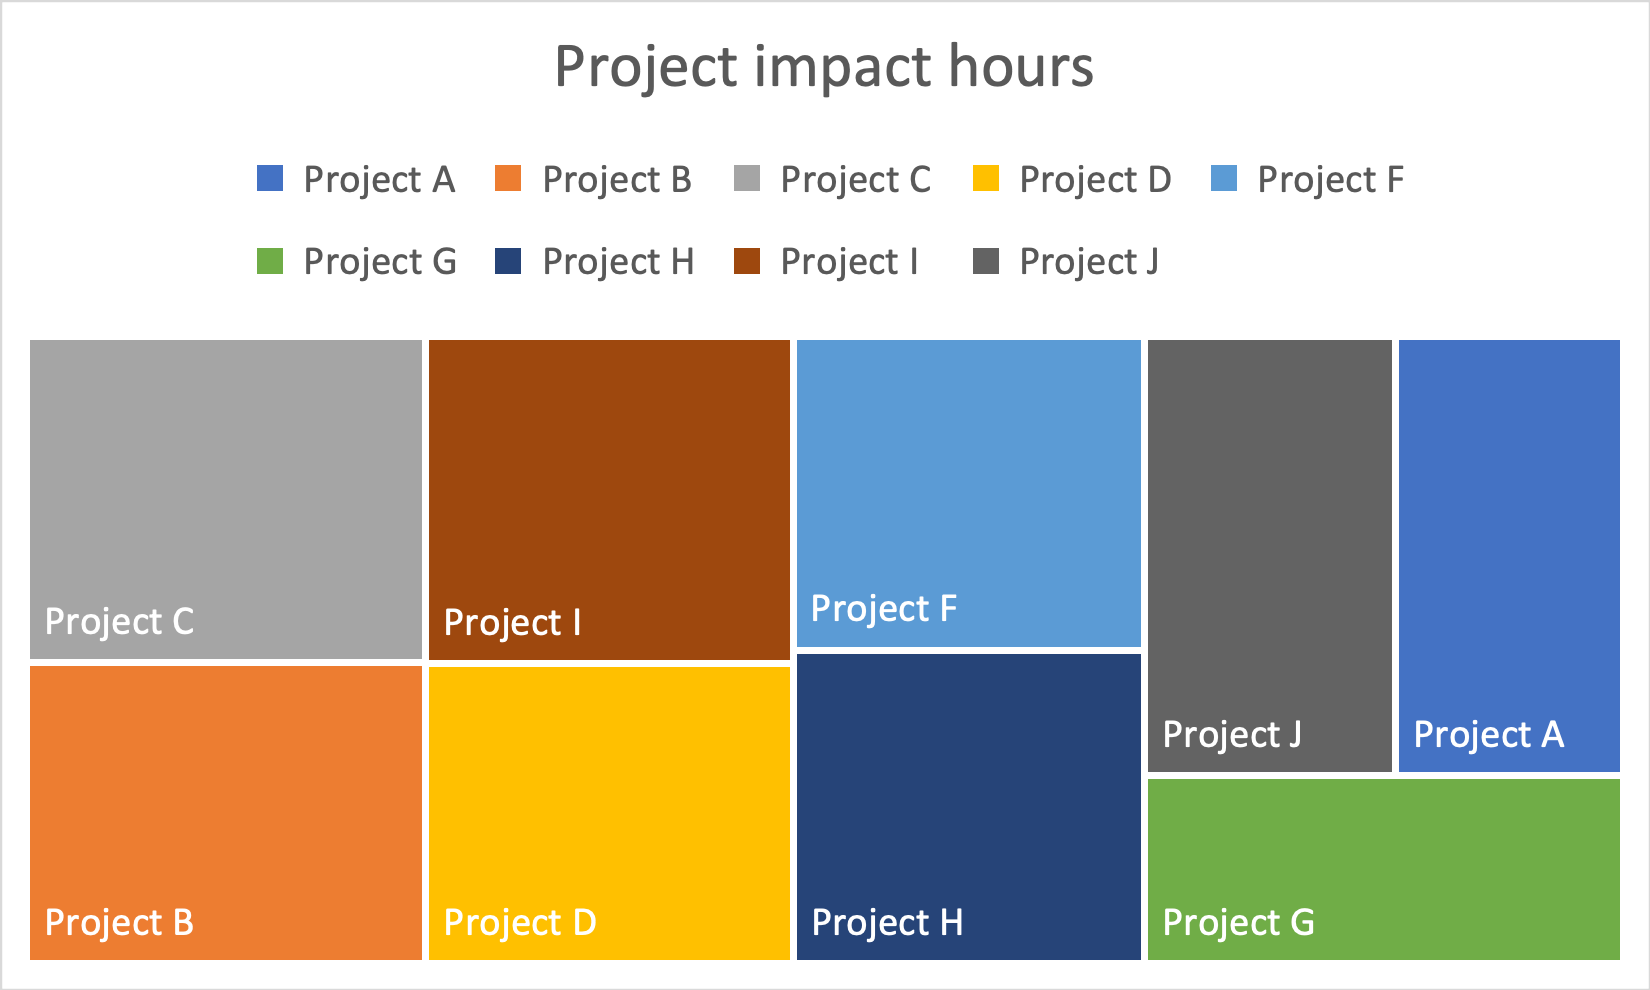
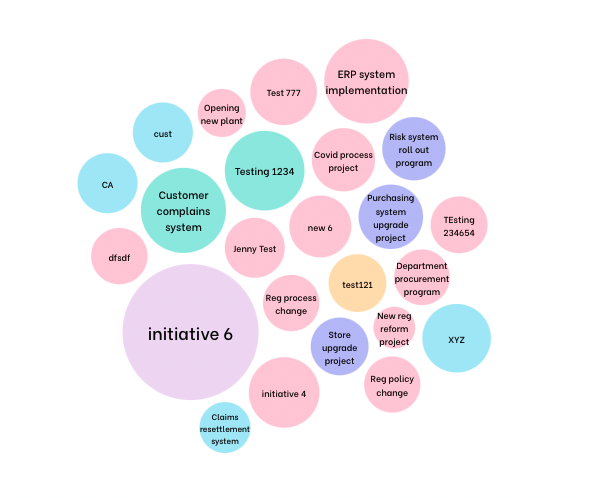
C.Treemap charts
Treemap charts are a great way to show, in a neat and tidy way, the relative data value across a number of data set. Ideally, the data set is not so great that it becomes too complicated to read (i.e. over 20 data points). This chart is a great visual when you want the user to see and compare the size differences of data points.
Now have a look at the below chart. Once again this is using the same data. If you would like your audience to compare the different hours of impact across each project it is very difficult for them to decipher which one has more impact than others. What this chart may be good at is when there is a big range of differences in data points and you want to be able to show the range of the different hours. However, when the range in differences are not great, which is the case here, it is better not to use this chart.
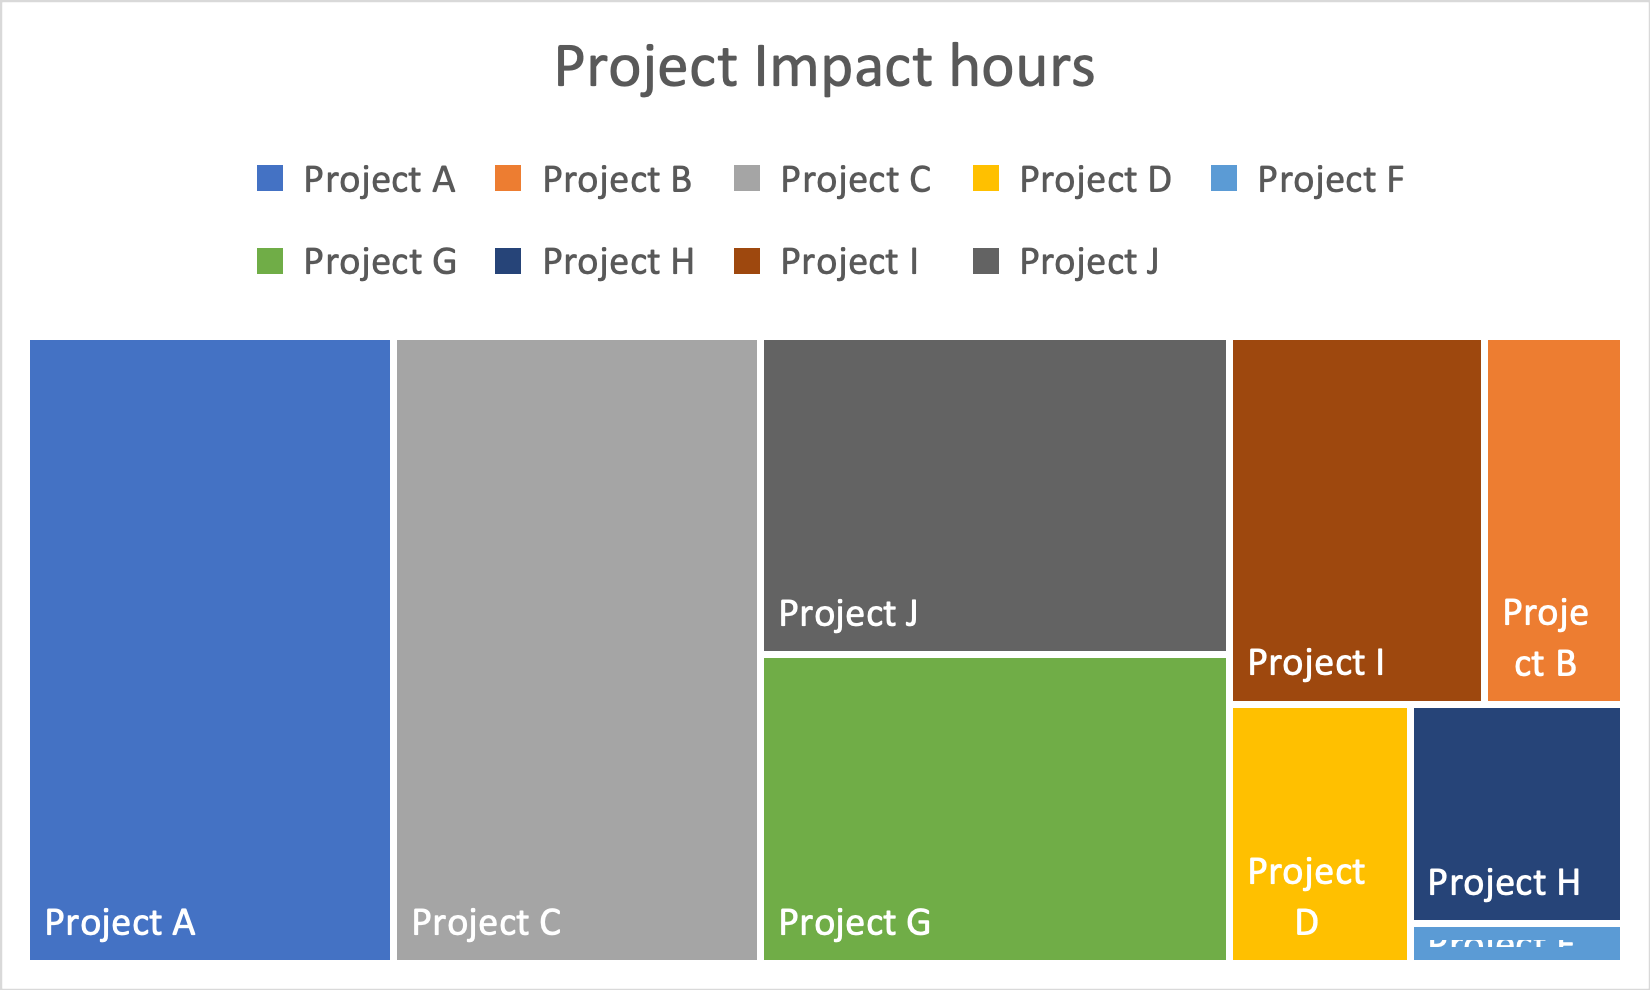
Now have a look at the below chart. You’ll see that it is much easier to see the data size differences because the sizes are quite significantly different. For example, if you want your audience to visually just how much the impact difference is, then this is a good chart. If you want to, you can always show the numerical values, if you would like your audience to see the numerical differences as well.
D. Using bar charts
Bar charts are one of the most common forms of data charts. There is a very good reason for this. Humans are very good at comparing lengths when they are aligned neatly next to each other. We can naturally see the beginning and end of each bar chart and be able to easily decipher the comparative differences across the bars.
There are many different types of bar charts including:
- Vertical bar chart
- Horzontal bar chart
- Clustered bars
- Stacked bars
- 100% stacked bars
- Waterfall chart
Some of the tips in using bar charts effectively include:
- Avoid using too many colours since the audience may be overwhelmed and focus on the colours instead what the chart is trying to show in terms of comparative differences
- Ensure labels are clear and easy to read
- Use a zero-baseline so that the audience only focuses on the difference at the other end of each bars
E. Using bubble charts
The bubble chart is a very visual chart and easy for people to compare across data points. The bubble chart is a good chart to use when there is a number of data points, but no more than 20. If there is over 20 data bubbles it starts to get too overwhelming for the audience. There are many different types of bubble charts
- Standard bubble chart where there are no axes, with each bubble representing the different sizes (e.g. impact size, completion rate, etc.)
- Scatterplot with 2 axes and changing bubble size. This chart shows 2 dimensions of data, i.e. the 2 axes and the bubble size. For example, bubble size could represent number of people impacted, with impact size and change readiness rating on the 2 axes
- Scatterplot with 2 axes and no changing bubble size. This type of chart is useful to show the differences along the axes. The ‘bubbles’ or dots are simply representations of different data points since they do not have bubble size differences. For example, the horizontal axis can show time, and the vertical axis can show change readiness, with each dot showing a different project.
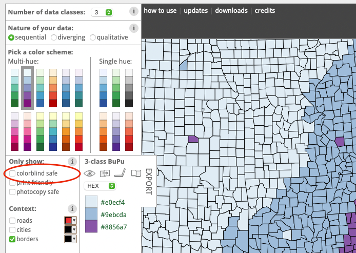
4. Colour blindness
Approximately 8% of men have colour blindness. The percentage is less for women. So, it is important to note that you will likely come across audience members who may not be able to see certain colours. Most business people do not make a point of designing charts that take into account colour blindness. However, you do not want to risk making a blunder with critical stakeholders who may not be able to see what you are referencing.
To check that you are using colours that are not going to disadvantage colour-blind audience, use ColorBrewer and select the colour-blindness safe box to come up with the right colours.
5. Examples of story flows
What are some of the examples in which change practitioners can use data-based storytelling to influence stakeholders? In this section, we look at a few examples.
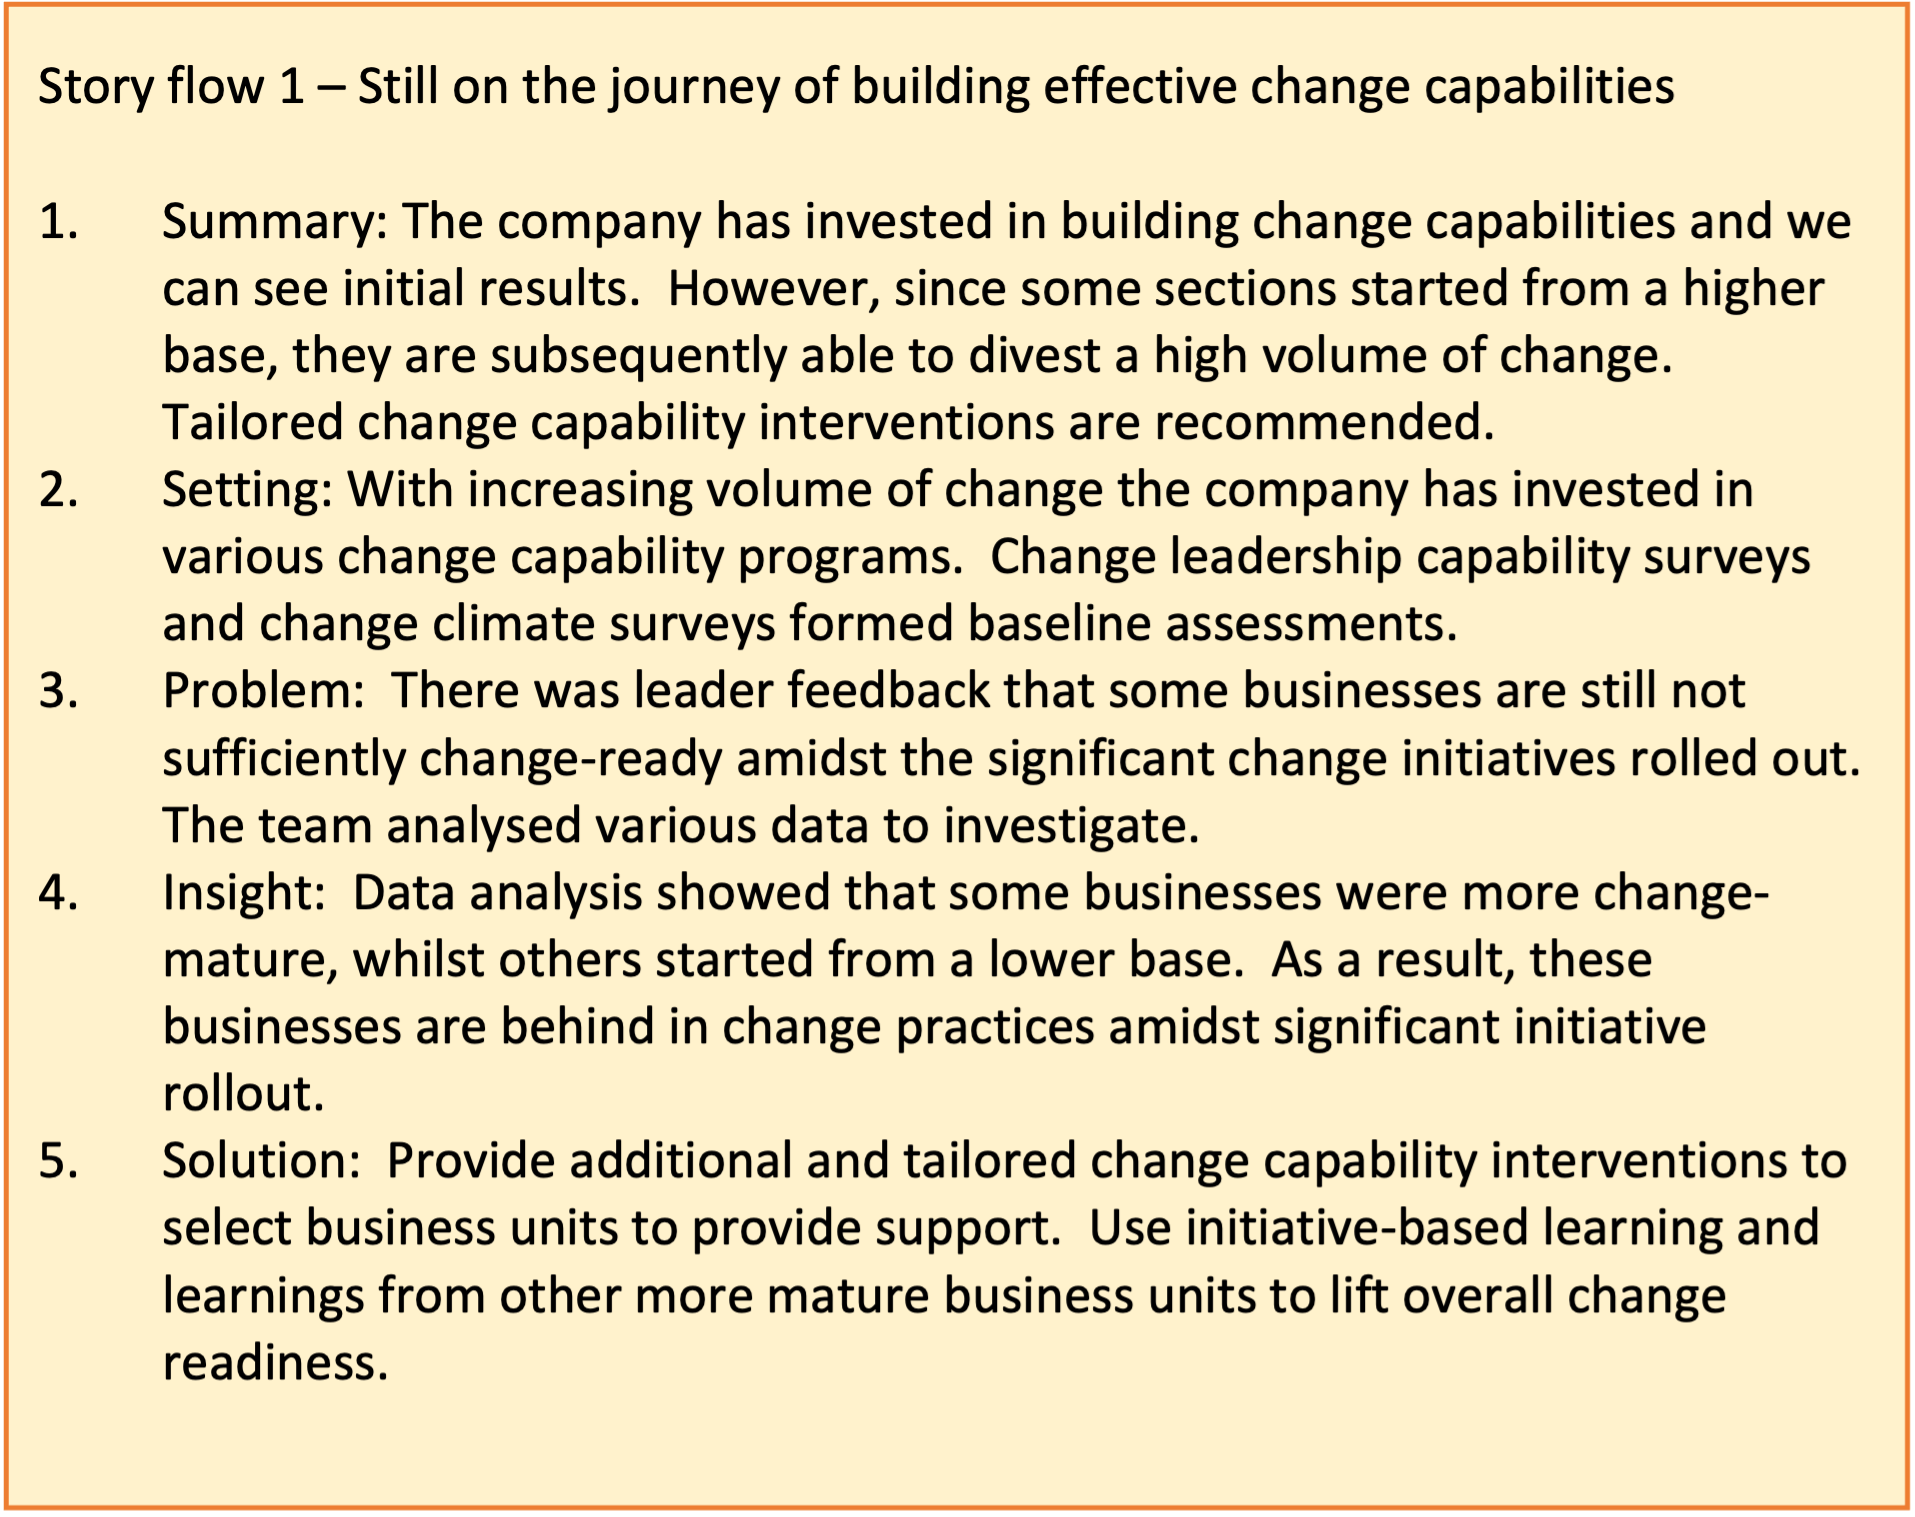
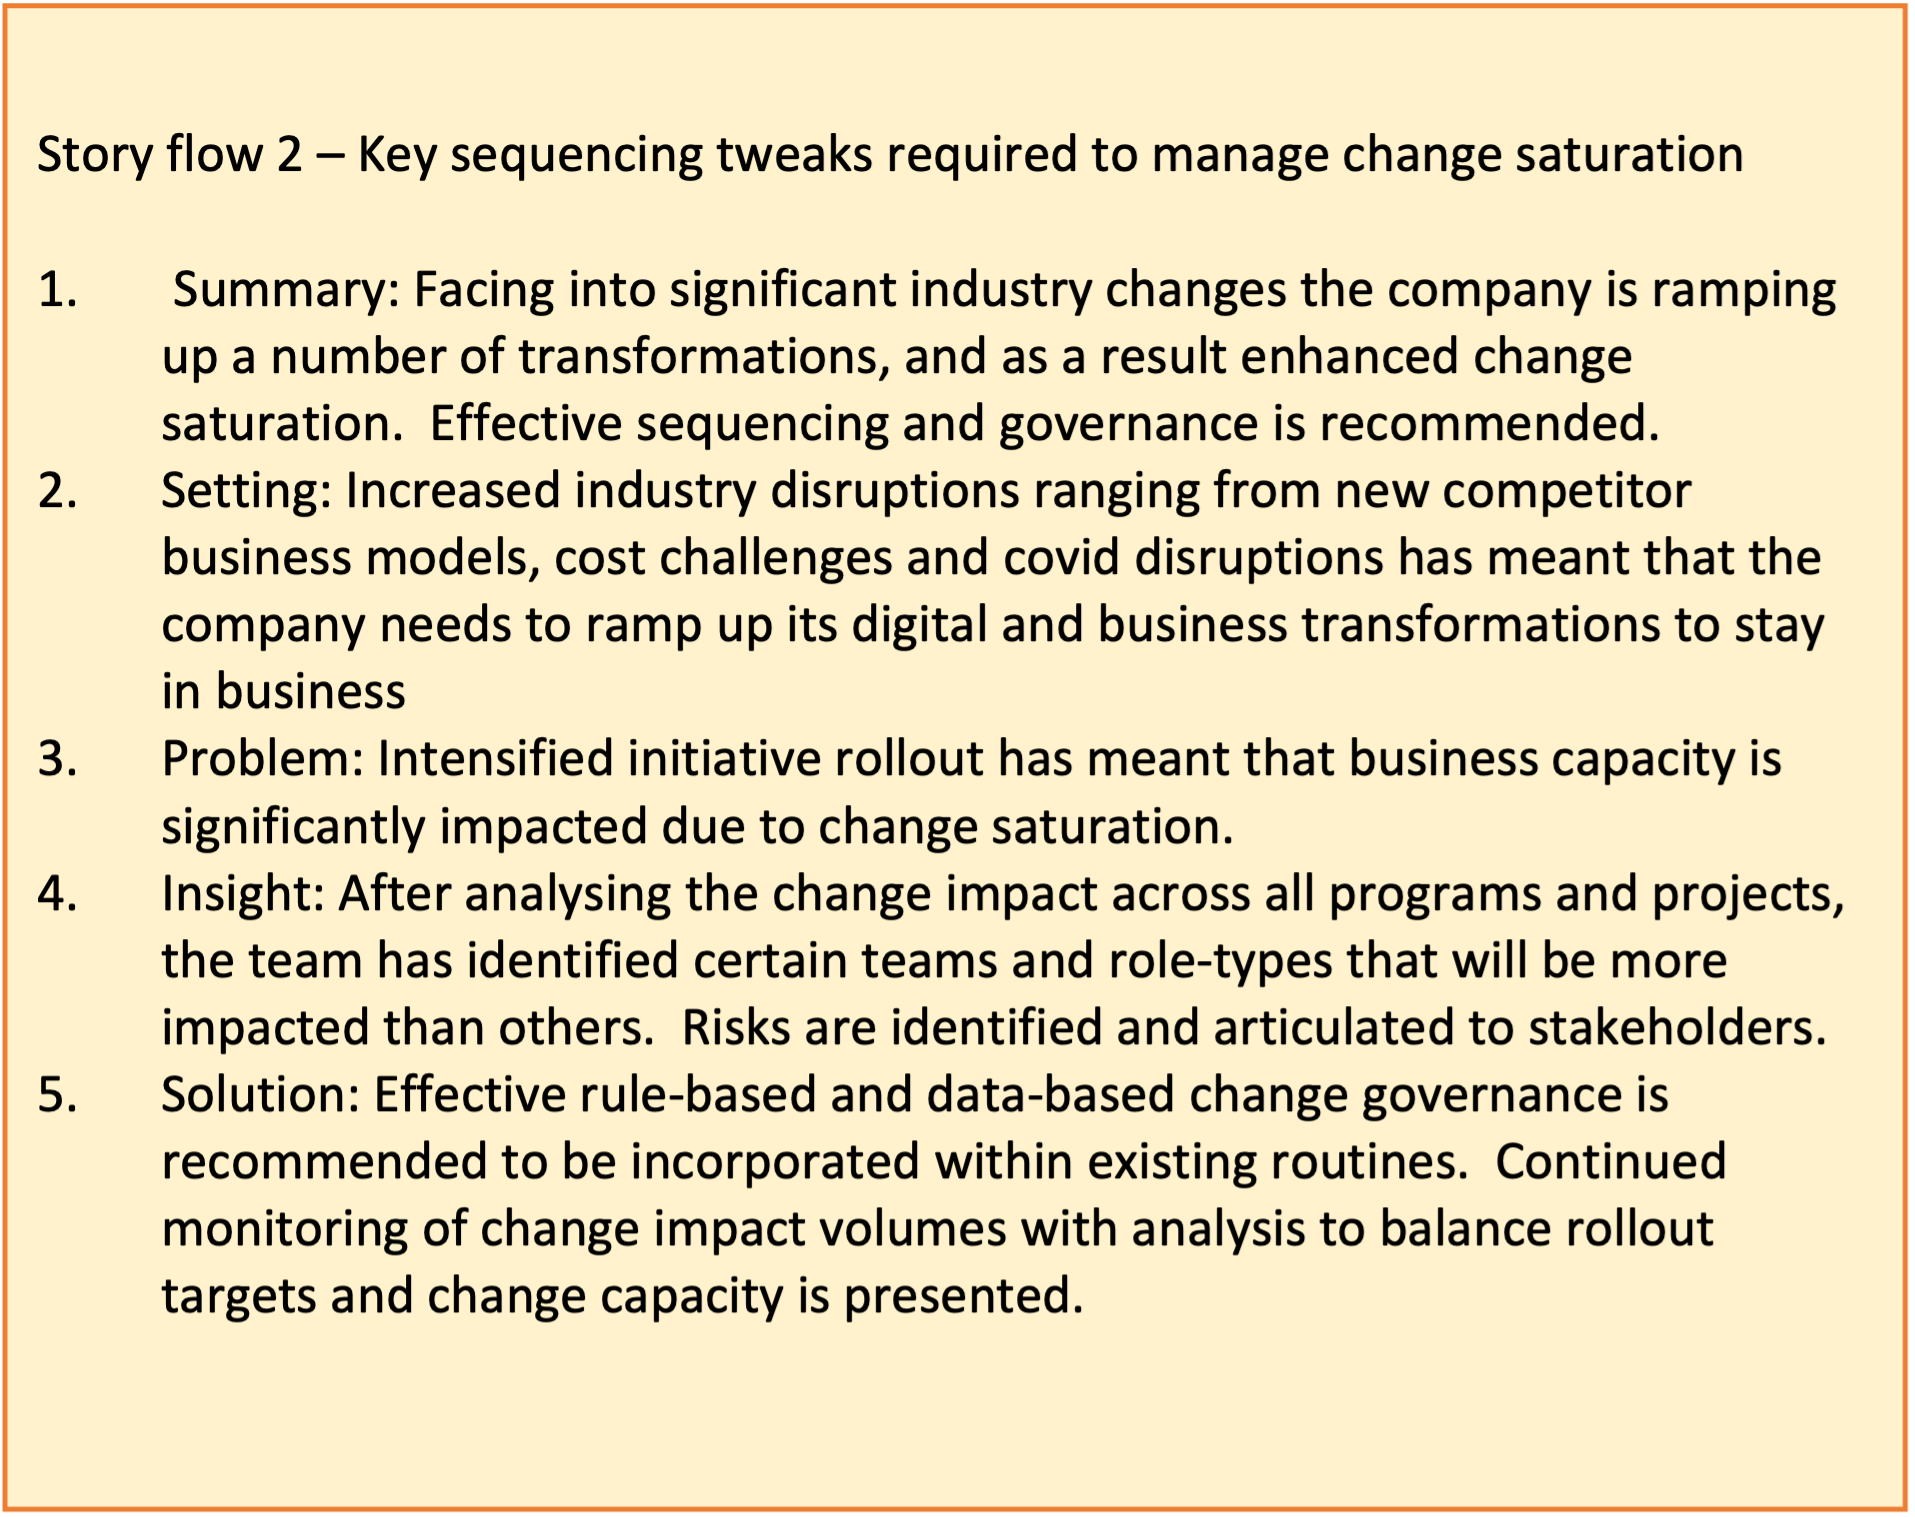
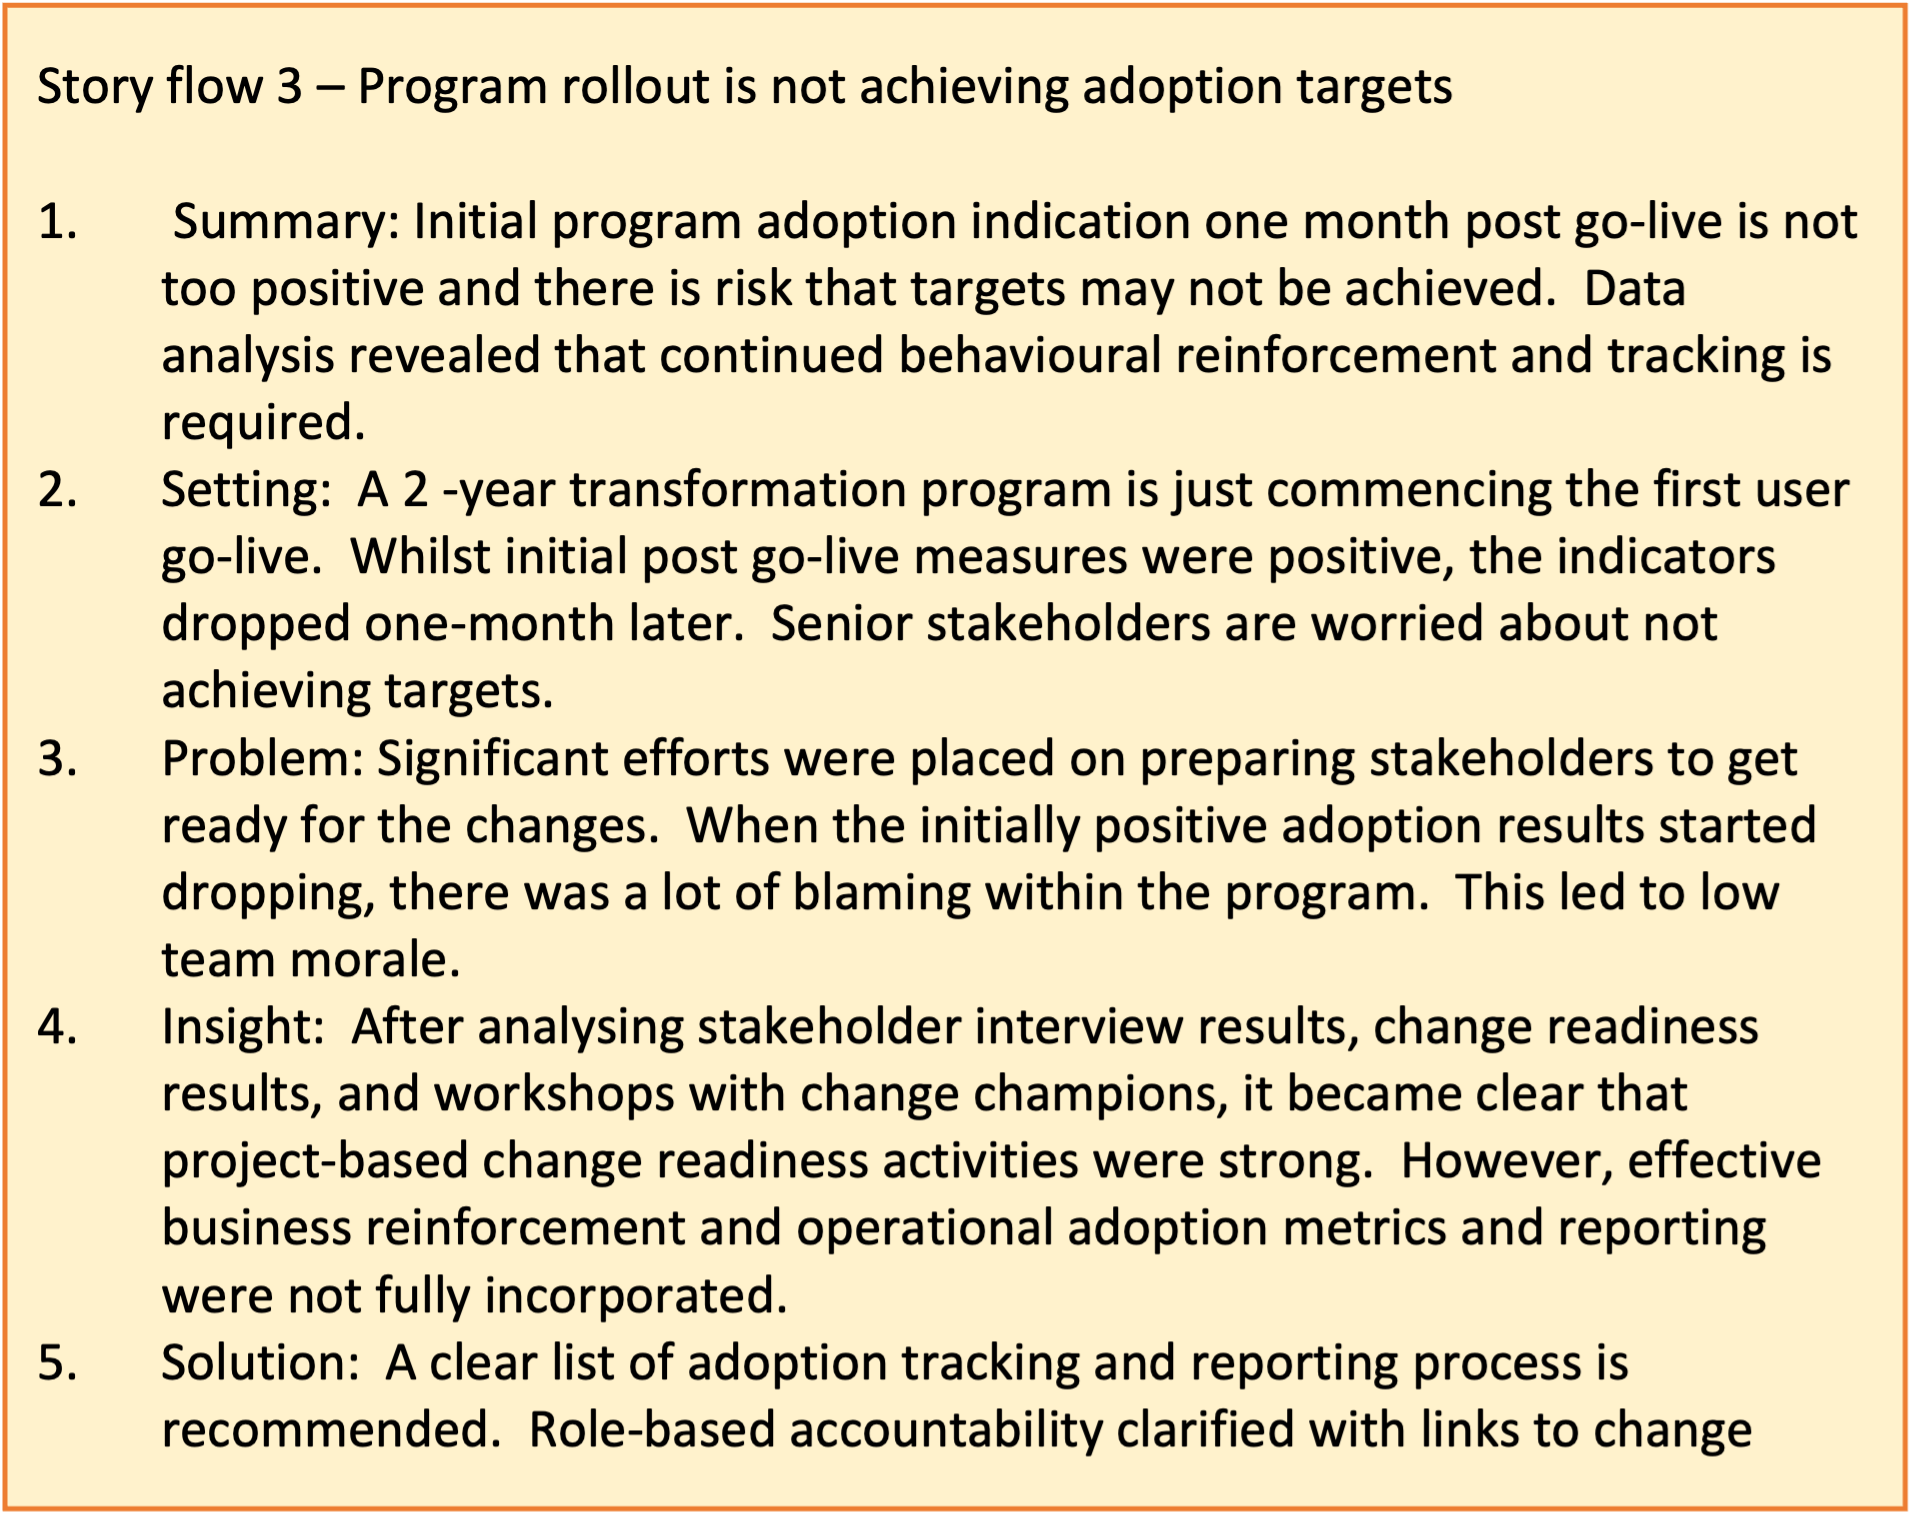
A key ingredient in all of these story flows is that they all contain a logical sequence of stories. A good way to add ‘colour’ and bring the story to life is to add quotes, and observations to support the data. This balance of quantitative and qualitative data can be very powerful and persuasive.
The other call out is that in each of the 5 steps, data may be used to support the story flow. The use of data does not need to only be injected in the steps of ‘Problem’ and ‘Insight’. It can be every or any single step of the story flow. In this way, the story becomes even more powerful and convincing. However, note again that having too much data may overwhelm the audience and create confusion. So, achieving a balance is key.
6. Making recommendations
Essentially, data-based storytelling is not just about informing the business of what is going on or what is going to happen. The value comes when you use it to make recommendations. Recommendations are hard to dispute when the story sequence is backed by data. When you make a sequence of logical deductions backed by data, the audience is naturally convinced by the recommendation proposed.
It is also a good idea to come up with options when recommending a solution. Ideally, create two scenarios for your stakeholders to select from, or a maximum of three scenarios or choices. Describe clearly what each scenario could look like and supplement the recommendation with the advantages and disadvantages of each scenario option.
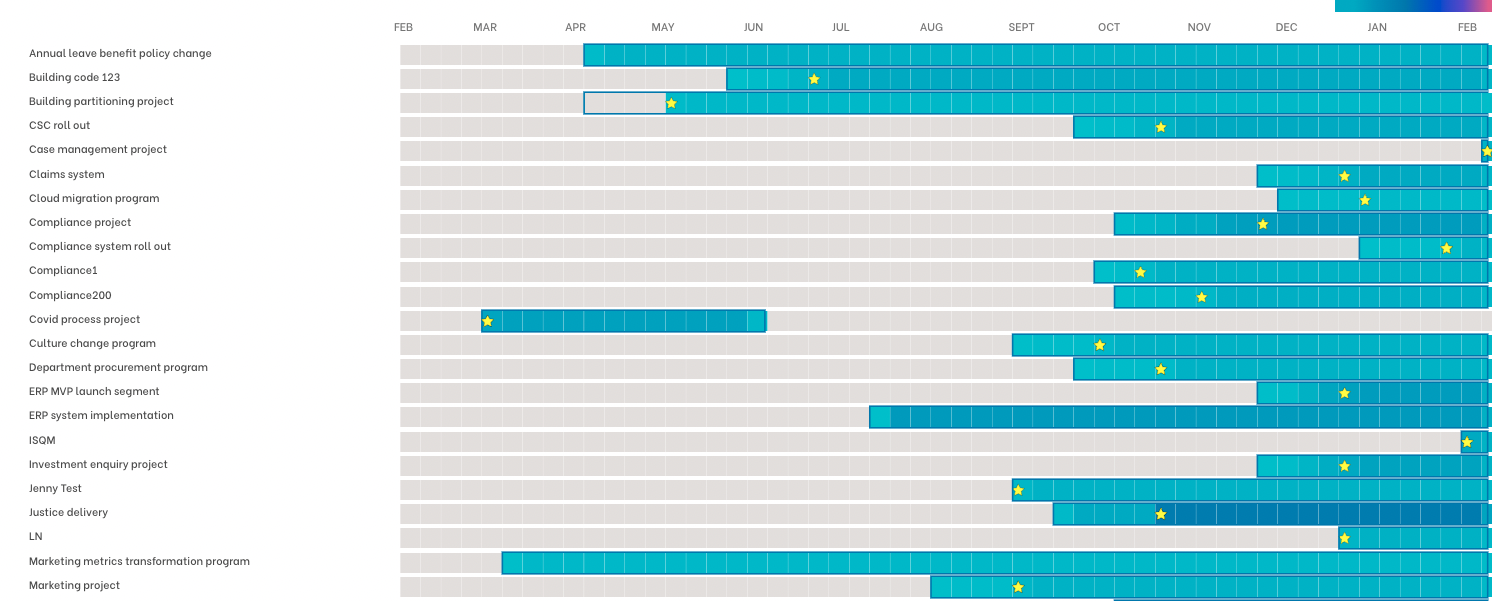
Below is an example of a chart from The Change Compass where an alternative delivery sequence is proposed. It illustrates what the alternative change impact looks like for impacted business stakeholders across projects. The star indicates planned go-lives.
Telling compelling and persuasive stories using change data takes practice. Through regular practice, you will discover what your stakeholders resonate with and what they find challenging to understand. Tweak your presentation accordingly. Note any individual stakeholder differences. Also, note any commonalities of preferences across your stakeholder groups.
Don’t forget to visit The Ultimate Guide to Measuring Change for more detailed practical information about using change data.
For a range of articles on change data and change analytics visit our Knowledge Article Page.