


What are the key components of an agile change management plan?
An agile change management strategy process includes key components such as a clear vision for change, stakeholder engagement strategies, iterative feedback loops, and adaptable processes. These elements ensure effective communication, continuous improvement, and responsiveness to evolving needs, helping teams navigate transitions smoothly while maintaining alignment with organizational goals.
The agile approach of implementing major changes has been popular for quite several years among a range of companies across the business environment, from small startups to large corporations. Most agile processes and methodologies do not explicitly address the role of change management as a function. However, at the same time, most agile practitioners and project practitioners agree that applying agile project management principles, including agile principles, to managing change management approaches is a critical skill set, especially when transitioning from traditional project management approaches used in software development. Surveys conducted by the Project Management Institute consistently found that change management is rated as one of the top skills for a project manager.
To find out more about agile methodology and embedding change management within it, please read our Ultimate Guide to Agile for Change Managers.
In this article, we will delve into a variety of toolkits that support agile methodologies in an agile environment, providing not only an overview of agile change management practices but also in-depth explanations and practical examples to help change managers, team members, and software developers, including the core development team, implement change effectively. Gone are the days when the agile team and change manager, sometimes guided by an agile coach, need to work on large presentations and slides detailing every aspect of the plan. It was not uncommon to see more than 100 slides for a change plan. In the agile world, documentation is important, but more important is the conversation and working with stakeholders.
Toolkit 1: Change Canvas: A Summarized Approach to Change Planning
The Change Canvas, also known as ‘change-on-a-page,’ serves as a condensed version of the change plan. While previous iterations leaned towards a project plan format, the current version focuses on key questions that change practitioners must answer. Previous versions of the change canvas are often designed with more of a project plan slant. In the current version, we focus on a core set of questions that the change practitioner needs to answer in creating a change plan. To download the canvas click here.
Example: “Imagine a technology company undergoing a major software upgrade. The Change Canvas was employed to create a concise summary of the change plan. This one-page document effectively communicated the essence of the software upgrade, outlining key aspects such as the purpose, stakeholders involved, and the approach to implementation. This simplified overview, along with the terms of service, became a valuable reference point during stakeholder meetings, fostering clearer communication and understanding.”
Example: “Imagine a technology company undergoing a major software upgrade. The Change Canvas was employed to create a concise summary of the change plan. This one-page document effectively communicated the essence of the software upgrade, outlining key aspects such as the purpose, stakeholders involved, and the approach to implementation. This simplified overview became a valuable reference point during stakeholder meetings, fostering clearer communication and understanding.”
Toolkit 2: Change Experiment Card: Iterative Approaches for Effective Change
A core part of agile is about experimenting and iterating through a series of changes, versus planning one change. The idea is that each small change is an experiment with a hypothesis that can be tested and proven to be true or false using data. When the overall change becomes a series of smaller changes, each change iterates on the previous change. The overall risk of failure is reduced and each change is one step closer to the ultimate successful end state.
Applying this concept in change management – The change experiment card is a template to help you design, plan, and test your change experiment. To download the template please click here.
Change experiments can range from:
- Project message positioning to stakeholders
- Learning design effectiveness
- Effectiveness of a communications channel in engaging with stakeholders
- Change readiness tactic
- Effectiveness of the change vision artifact
Example: “In an educational institution implementing a new learning management system, the Change Experiment Card was utilized to plan and test various change experiments. One experiment focused on refining the messaging strategy to engage faculty members effectively. By treating each adjustment as an experiment, the change team gathered valuable data on the impact of messaging changes, allowing for continuous refinement and ultimately ensuring a smoother adoption of the new system.”
Toolkit 3: Behavior Over Time Graph: Anticipating and Tracking Stakeholder Experience
The Behavior Over Time Graph is a powerful tool for anticipating and tracking stakeholder behavior throughout the change process. Explore a specific case where stakeholders’ reactions were plotted over time, providing significant insights into the need for additional interventions, obstacles faced, and alignment with anticipated timelines.
Here is an example of a behavior over time graph.
Example: “During the rollout of a new performance management system in a corporate setting, the Behavior Over Time Graph was employed to track employee sentiments. As the system was implemented, the graph revealed an initial dip in engagement, prompting the change team to introduce targeted communication and training interventions. The subsequent rise in positive sentiments demonstrated the effectiveness of these interventions, showcasing the power of anticipating and responding to stakeholder behavior over time.”
Toolkit 4: Connected Circles Analysis: Unveiling Stakeholder Dynamics for Successful Collaboration
The Connected Circles Analysis chart is indispensable for understanding the influencing powers of various stakeholders in an agile project. Through a practical example, discover how this analysis unveiled power dynamics, aiding the change manager in resolving relationship issues, mitigating risks, and leveraging the network for improved outcomes within the stakeholder group. A range of stakeholders are thrown together within the same project from the beginning and there is a high expectation of successful collaboration and teamwork across the board. This analysis helps you to visualise the power dynamism and influence mechanisms amongst different stakeholders.
With the insight gained from this, the change manager can better focus on how to resolve any relationship issues, risks, and leverage the network to achieve better relationships and outcomes within the group.
Example: “In a cross-functional agile project within a large organization, the Connected Circles Analysis chart was used to understand the influencing powers of various stakeholders. By visualizing the dynamics, the change manager identified potential conflicts and areas of collaboration. This insight facilitated proactive measures to enhance relationships, resolve conflicts, and leverage the collective influence of stakeholders for a more cohesive and collaborative project environment.”
Toolkit 5: Causal Loop Diagram: Systems Thinking for Agile Projects
Systems thinking is critical in agile projects, emphasizing the need to understand how different components interact. The Causal Loop Diagram helps analyze key factors and their causal relationships within the system.
The below example shows employee sentiments toward a system change. This is a very simplified version of what happens since in real scenarios there could be various factors that are reinforcing each other, leading to lots of arrows pointing at different directions. At a more sophisticated level, you may assign points in terms of the strength of the causal relationship. At a basic level even plotting the causal relationship between a few key factors may generate key insight into the ‘why’ of the dynamics of a situation.
Example:
“In a manufacturing company implementing agile practices across departments, the Causal Loop Diagram was applied to understand the dynamics of employee sentiments toward process changes. By mapping out the causal relationships between factors such as training effectiveness, leadership communication, and workflow adjustments, the change team gained a holistic view. This enabled them to address root causes, leading to a more systemic and sustainable improvement in employee sentiments over time.”
In the dynamic landscape of organizations undergoing numerous agile changes, the ability to capture and visualize these transformations becomes paramount for informed decision-making. Data visualization emerges as a powerful tool, offering stakeholders a comprehensive understanding of the organizational change landscape. It enables them to navigate through various changes, identify key capacity challenges, recognize crunch periods, understand the velocity of changes over time, and pinpoint areas requiring additional support.
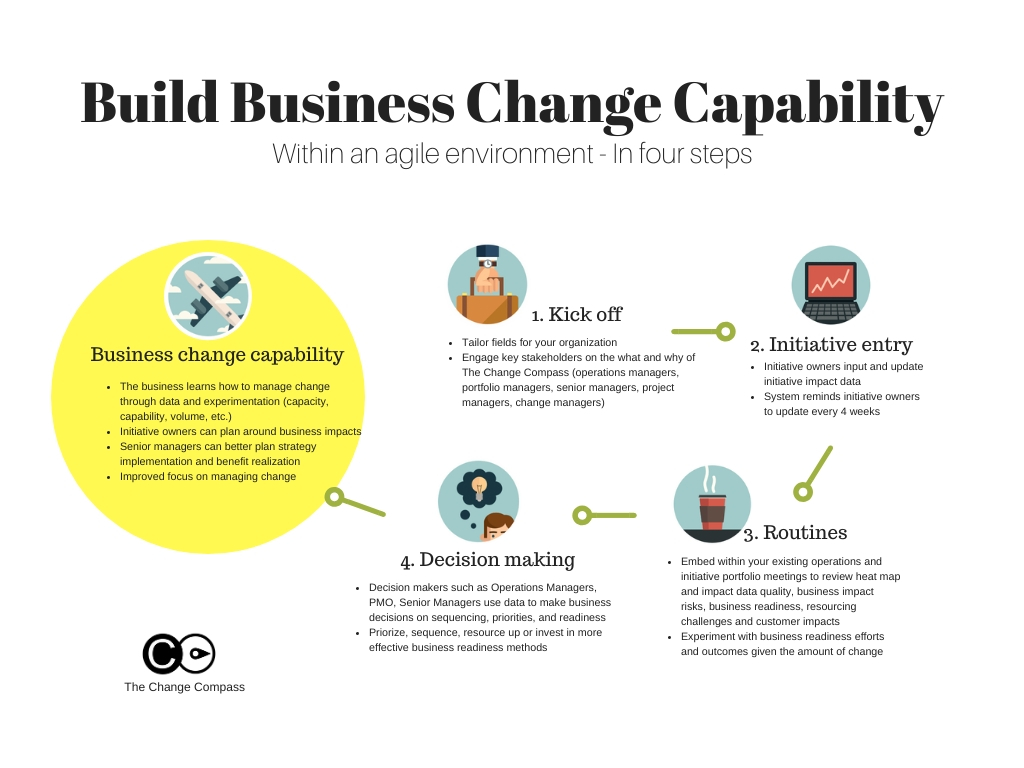
To effectively navigate this complex terrain, organizations can leverage advanced tools such as The Change Compass. This tool provides a consolidated view of change, facilitating improved planning and implementation strategies. By integrating operational routines that consistently focus on change data alongside other business and project information, organizations can systematically enhance their change capability. This process involves regular reviews, engaging stakeholder discussions, iterative refinement of change tactics, and adaptive adjustments to plans in anticipation of evolving change dynamics.
In adopting such a holistic approach, organizations not only streamline their change management processes but also foster a culture of constant improvement and adaptability. The use of tools like The Change Compass becomes instrumental in creating a unified vision of change, aligning stakeholders, and ensuring that the organization remains agile and responsive in the face of ongoing transformations.
To download this diagram click here.

