There are many steps in getting from collecting change management data to making business impact. Data does not equal business impact.
Is the data you’re showing presented in the right graphics, timelines or templates and contain the right key information for the right audience group?
Do you have a compelling story you are telling using the data? Without the story and context the data could be meaningless.
What recommendation are you providing to the change management process and what action are you prompting your stakeholders to make?
For more on change management metrics as a part of agile change management visit our Ultimate Guide for Measuring Change
For more clarity on storytelling as a part of your change management toolkit visit our Ultimate Guide to Storytelling with Change Management Data
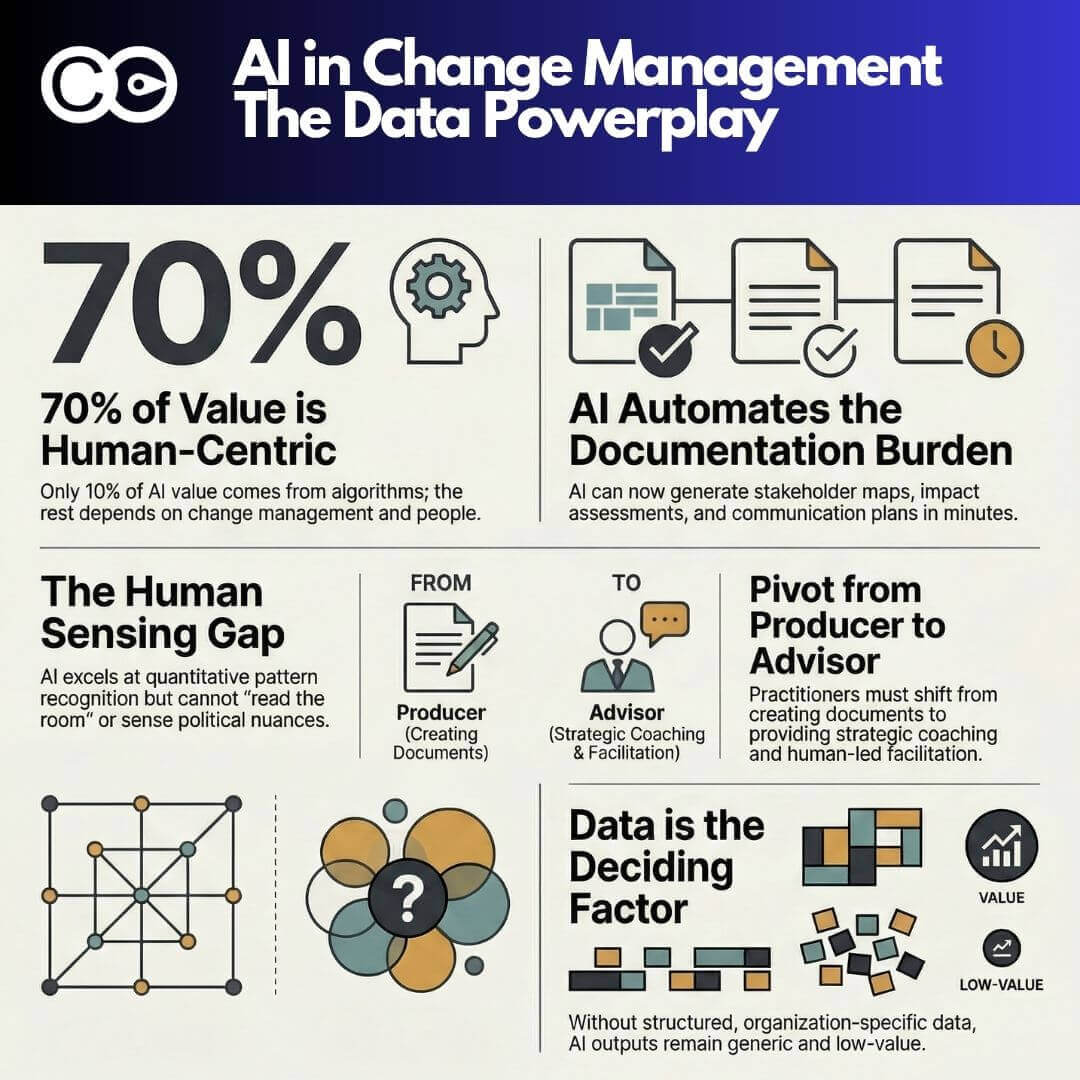
Here is a powerful infographic template that highlights the key steps from change management data, sorted change management data, change management data visualization, generating change insight, storytelling the change insights generated, and actioning on change management insights.
To download the infographic please click here.