Most change impact assessments describe an initiative that no longer exists by the time anyone reads them. The scope shifted after sprint two, the vendor changed the rollout order after sprint four, and the stakeholder group nobody flagged in the original assessment found out about the change from a colleague. None of this is a failure of the practitioner who wrote the assessment. It is a failure of the assumption underneath it: that impact can be captured once, at the start, and will still be true months later.
That assumption made sense when initiatives moved in long, sequential phases. It breaks down against the way organisations now deliver change: in sprints, in pilots, in staged rollouts, with scope that is deliberately expected to move as teams learn. This article is for change managers running that pace of delivery and for the leaders funding it, and it argues for a specific shift: impact assessment needs to become a continuous practice embedded in every iteration, not a document produced once and filed. It also sets out what that looks like in practice, how to keep it lightweight enough to survive inside an agile cadence without losing rigour, and how the data an organisation collects this way can compound into an asset that makes every future initiative faster to assess and safer to run. By the end, you should be able to name the trigger points that call for a fresh look at impact inside your own delivery cycle, and see where AI-based recommendations can carry some of that continuous workload for you.
The one-off impact assessment can no longer keep pace
For most of the discipline’s history, impact assessment has been an event. It happens once, early, usually as a gate before a steering committee will fund the next phase. A change manager interviews stakeholders, maps affected processes and roles, scores severity, and produces a document. That document becomes the reference point for the rest of the initiative, updated occasionally if something goes badly wrong, but rarely revisited on a schedule.
Iterations are shrinking, but the model hasn’t moved
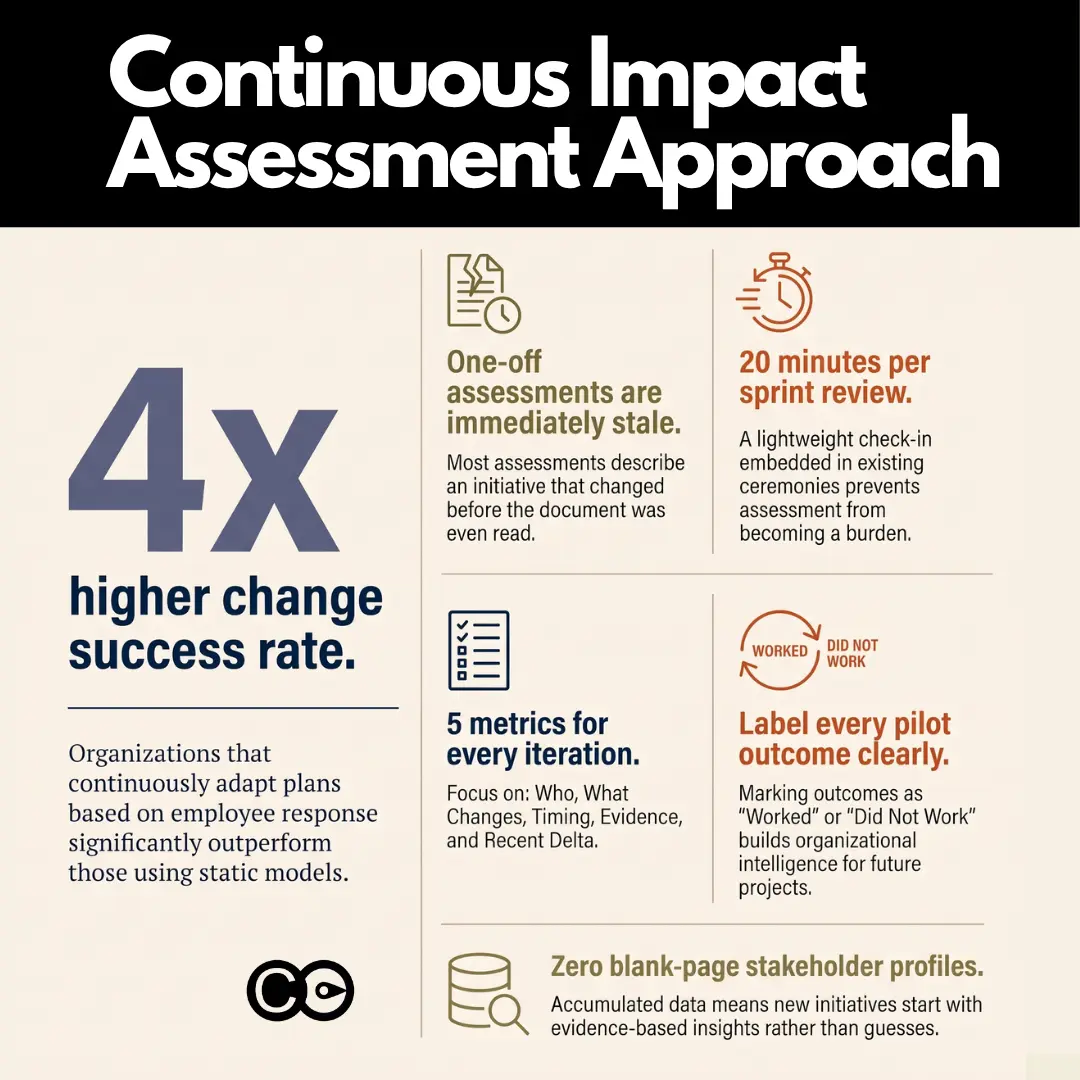
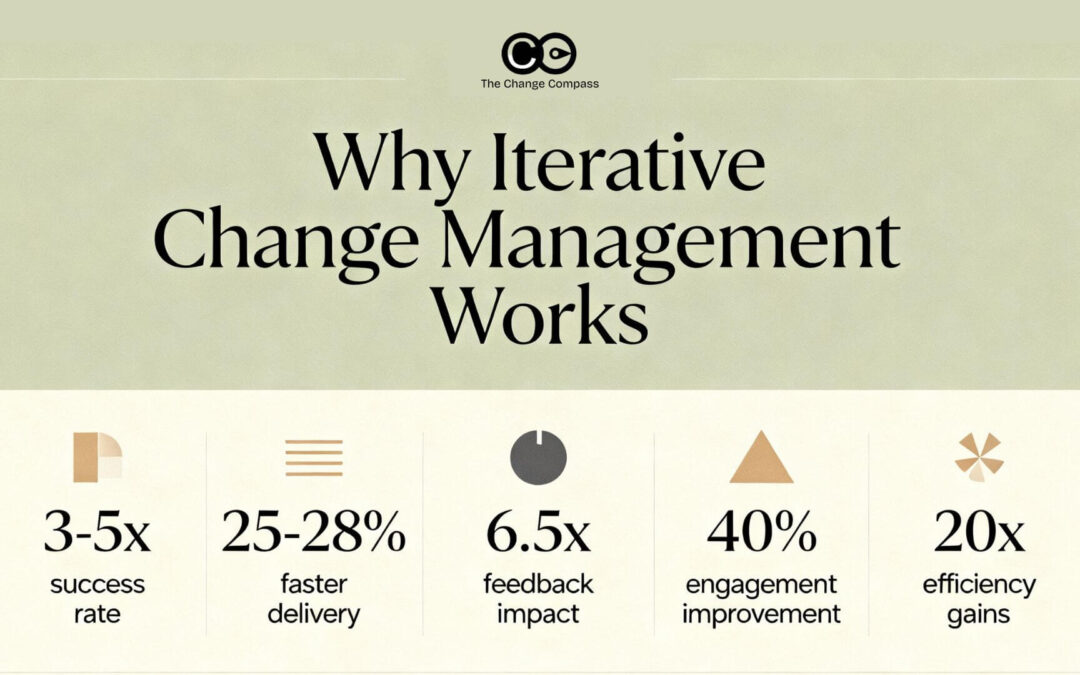
The initiatives that document is meant to describe no longer move the way the model assumes. Gartner’s July 2025 survey of 313 senior change leaders found that organisations which continuously or regularly adapt their change plans based on employee response are four times more likely to achieve change success than those running a static, set-once plan, a gap wide enough that it should worry anyone still treating impact assessment as a one-time gate rather than a standing practice (Gartner, Top Change Management Trends for CHROs in the Age of AI, 2026). Harvard Business Impact’s 2025 Global Leadership Development Study found something similar from the leadership side: 71% of senior leaders now say the ability to lead through constant change is critical, up from 58% just a year earlier, and the organisations coping best are the ones that have shifted from being merely change-ready to being change-seeking, building feedback loops into how they operate rather than reacting after the fact (Harvard Business Impact, Readiness Reimagined, 2025).
Put those two findings together and the direction is clear. The pace of iteration has moved past what an event-based impact assessment can track, and the organisations pulling ahead are the ones treating reassessment as routine rather than exceptional.
Part of why that pace keeps accelerating is that the software itself now ships faster. AI-assisted development tools have compressed build and release cycles that used to take months into weeks, so the systems and workflows a change initiative touches can shift shape multiple times within a single project timeline, not just at a handful of scheduled milestones. An impact assessment written against last month’s build is increasingly an impact assessment written against a system that no longer exists.
What’s actually breaking
The breakage is specific, and it repeats across organisations running agile delivery alongside a traditional change function:
Scope drift outpaces the document. A backlog re-prioritised after two sprints changes who is affected and when, but the impact assessment was written against the original backlog.
New stakeholder groups surface mid-flight. Pilots routinely reveal an affected team nobody named at kickoff, because nobody could have named them until the pilot ran.
Severity changes, not just scope. An impact rated low at the design stage can become high once a pilot shows the workaround does not hold at scale, and the reverse also happens, where a feared impact turns out to be manageable.
The steering committee sees a stale picture. Executives making resourcing decisions are working from the assessment as it stood at the last gate, not as the initiative stands today.
None of these are edge cases. They are what iterative delivery is designed to produce, because the entire point of running in short cycles is to let scope and approach change in response to what teams learn. An impact assessment process that cannot absorb that change without a full re-run is not built for the environment it is now operating in.
Take a claims-processing rollout run over six two-week sprints. The original impact assessment, written before sprint one, rated the change as low-severity for regional claims handlers because the plan called for a simple interface update. By sprint three, user testing showed the interface change also broke an informal workaround handlers relied on for complex claims, a workaround nobody had documented because it was never part of the official process. The severity rating that mattered was no longer the one written down. It was the one nobody had gone back to check.
What continuous impact assessment looks like in practice
Continuous does not mean assessing everything, all the time, from scratch. It means building a small number of trigger points into the delivery cadence itself, so that impact gets a fresh look exactly when the initiative has moved enough to justify one, rather than on a fixed calendar or not at all.
Useful triggers to build into your own cadence:
End of every sprint or iteration where scope, sequencing, or the rollout approach changed
Any point a pilot or experiment produces a result that contradicts the original assumption
Introduction of a new stakeholder group, system, or dependency not in the original assessment
A change in go-live date, geography, or business unit sequencing
A shift in the delivery team’s confidence in the approach, even without a formal scope change
A minimum viable reassessment
A full impact assessment at every one of these trigger points would defeat the purpose, so the practical version is smaller and faster: a short, structured check against the original assessment, asking what changed, who is newly affected or no longer affected, and whether severity has moved. This can run in twenty minutes as part of a sprint review rather than as a standing project in its own right. The goal is not to reproduce the original document’s depth every time. It is to catch drift before it compounds into a surprise at go-live.
Building the cadence into the iteration itself
The mechanical part matters less than where it sits. If reassessment is a separate task someone has to remember to schedule, it gets skipped under delivery pressure, which is exactly when it is most needed. It works better folded into an artefact the team already reviews every cycle, such as the sprint review or the same retrospective where the delivery team looks at what did and did not go to plan. Change impact becomes one more question asked at a moment that already exists, not an additional meeting competing for calendar space.
A worked example
Back to the claims-processing rollout. If the reassessment trigger had been built into the sprint review from the start, the workaround issue would have surfaced in the sprint three review, not in a support-ticket spike two weeks after go-live. The twenty-minute check would have asked three questions against the original assessment: has anything changed in scope or approach, has any new group or workflow surfaced, and has severity moved for anyone already on the list. The answer to the second question, an undocumented workaround now at risk, is exactly the kind of finding a full upfront assessment cannot catch, because it did not exist to be found until the team was far enough into delivery to see it.
Lighter documentation, not lighter rigour
Agile ways of working come with a reasonable expectation that documentation gets lighter. Long-form artefacts written to justify a decision months later have limited value in an environment where the plan itself is expected to change. But lighter documentation is not the same claim as lighter rigour, and the two get conflated more often than they should.
Agile governance research is explicit on this point: good agile governance is lightweight and principle-based, not documentation-free, and organisations that treat “agile” as licence to skip structured checks tend to rediscover why those checks existed in the first place, usually at a worse moment than if they had kept them. Prosci’s research into applying ADKAR-style change frameworks inside iterative and hybrid delivery describes the same trade-off from the practitioner side: teams adapt by delivering guidance in shorter, more frequent, more targeted bursts and by starting reinforcement earlier, not by dropping the underlying discipline of identifying who is affected and how (Prosci, Aligning the ADKAR Model With Sequential, Iterative and Hybrid Change).
In other words, the expectation on a continuous impact assessment process is actually higher than on the old event-based one, not lower. You are being asked to identify every facet of impact accurately, on a tighter cycle, with less paperwork to hide gaps in. What “light but complete” needs to cover, every time:
Who is affected, by role or team, not just by business unit
What specifically changes in their day-to-day work, not a generic severity label
When the impact lands relative to the current iteration, not the original project timeline
What evidence supports the assessment, so a reviewer can tell a considered judgement from a guess
What changed since the last check, so the delta is visible without re-reading the whole history
A one-page structured update that hits all five of those beats a comprehensive document that only gets written once. The format shrinks. The standard for accuracy does not.
Every iteration is a data point: Closing the project-level learning loop
Each sprint, pilot, or experiment is also a small trial of how people respond to a specific kind of change. Treated deliberately, that generates evidence a project can use as it goes, rather than only in a retrospective after the fact. The loop looks like this:
Capture the intervention. Record what communication, training, or engagement activity accompanied this iteration, not just what shipped.
Capture the response. Note readiness signals, adoption behaviour, or resistance that showed up during and after the iteration, ideally from more than one source (usage data, manager feedback, pulse checks).
Label the outcome. Did the approach work as intended, partly work, or not work? This step gets skipped constantly because it feels like paperwork, but unlabelled outcomes cannot be learned from later.
Feed it forward. Use the labelled outcome to adjust the plan for the next iteration, not just to inform a report someone reads after go-live.
The discipline here is closer to how a legal case gets argued than how a status report gets written: define the actual question the iteration is testing, look at the evidence for it on its own terms, and be willing to read the result against your own assumption rather than around it. That habit of testing a specific claim against specific evidence, one piece at a time, is worth deliberately building into how a change team reviews readiness and adoption decisions, not just how it runs an initial impact assessment (see our analytical rigour in change management piece for the full method). Skipping the labelling step is the single most common reason organisations run dozens of pilots and learn less than they should from any of them.
From project learning to portfolio intelligence
A learning loop inside one project is useful. The bigger opportunity is what happens when that same discipline runs across every initiative in the portfolio, because most of what a single project learns about stakeholder response, engagement effectiveness, and adoption patterns is directly relevant to the next initiative touching the same team.
This is where most organisations fall short today, not because the value is unclear but because the plumbing does not exist. Kyndryl’s 2026 People Readiness Report found that fewer than a third of organisations have a fully established change management programme, even as the majority have already scaled AI deployment across multiple functions, meaning most companies are running more change than their change practice can systematically learn from (Kyndryl, 2026 People Readiness Report). Separately, Gartner’s HR research found only 32% of business leaders report achieving healthy change adoption by employees, a figure that is hard to shift when every initiative starts its adoption assessment from a blank page instead of the organisation’s own accumulated evidence (Gartner, Just 32% of Business Leaders Report Achieving Healthy Change Adoption, 2025).
What should roll up from project level to portfolio level, if the plumbing exists:
Stakeholder profiles. Which teams have absorbed heavy change recently, and how they tend to respond to different engagement approaches, carried forward rather than rediscovered on every new initiative.
Engagement effectiveness patterns. Which interventions actually moved readiness for a given type of change, tested across enough initiatives to trust the pattern rather than one project’s anecdote.
Readiness and adoption trends. Whether readiness typically lags or leads adoption for a given change type, and how far in advance that gives a team warning.
Severity calibration. Whether initial severity ratings for a given kind of change tend to run high or low against what the pilot data eventually shows, so future assessments start closer to accurate.
This is the same argument we make in more depth on why continuous change intelligence, not stage-gated reporting, is what an agile operating model actually needs at the portfolio level (see agile change management in the AI era). None of it requires a new methodology. It requires treating the outputs of every impact assessment and every outcome label as structured data that outlives the project, sitting in a shared reference practitioners can draw on rather than in eleven separate spreadsheets that get archived and forgotten (we cover why a readiness assessment built on real signals beats a one-off survey in a companion piece).
Consider what that looks like for the regional claims handlers from the earlier example. Once their reaction to the interface change is captured and labelled, it becomes evidence available to the next initiative that touches the same team, whether that is a different system change or an unrelated process update landing six months later. Instead of a new change manager starting from a blank stakeholder profile, they start from a record showing this group is sensitive to workarounds not covered in official documentation, and that a short user-testing pass in sprint two catches issues a document-review-only assessment misses. That is the difference between a portfolio that learns and a portfolio that just accumulates completed projects.
Where AI-based recommendations fit
A continuous model creates a genuine workload problem. Reassessing at every trigger point, labelling every outcome, and rolling every pattern up to portfolio level is more work than most change functions can sustain by hand on top of everything else in the role, which is exactly the gap this future is likely to expose if the practice stays entirely manual.
This is the practical role for AI in the model this article has described: not doing impact assessment instead of a practitioner, but continuously watching for the trigger points and surfacing a recommendation before someone has to remember to look. The Change Compass, built as a change intelligence platform, works this way inside a live initiative: as the plan changes, activities move, or a milestone approaches, it re-evaluates the current recommendation, flags when a previous approval no longer matches the updated plan, and shows the evidence behind the update so a practitioner can approve it in one action or dig into the assumption it is challenging. When an outcome is confirmed or corrected after go-live, that label feeds back into the same evidence base the next recommendation draws on, which is how the portfolio-level learning described above actually accumulates instead of staying a good intention.
Where to start
You do not need a new methodology to start running impact assessment as a continuous practice. You need three decisions: which moments in your existing delivery cadence will trigger a reassessment, what the minimum viable version of that reassessment captures, and where the labelled outcome from each iteration goes once it is captured. Start with one active initiative, pick the sprint review as your trigger point, and run the five-point check from this article for a single cycle. The habit is more valuable than the tooling around it, and the tooling only pays off once the habit exists to feed it. The teams pulling ahead on change outcomes are not the ones with the most detailed original assessment. They are the ones who never let their assessment go stale.
Frequently asked questions
What is continuous impact assessment? Continuous impact assessment is the practice of reassessing who is affected by a change and how, at defined trigger points throughout delivery, rather than once at project kickoff. It replaces a single upfront document with a running, lightweight update cycle tied to the same cadence the delivery team already uses.
How often should teams reassess change impact in agile delivery? Rather than a fixed calendar, reassess at trigger points: end of any sprint where scope or sequencing changed, after a pilot produces an unexpected result, when a new stakeholder group or system surfaces, or when the go-live timeline shifts. For most teams this lands roughly every one to two sprints.
Does agile change management still need formal impact assessment? Yes, and arguably more than a traditional approach does. Agile ways of working reduce documentation volume, but the underlying obligation to identify every facet of impact accurately does not shrink. What changes is the format: shorter, more frequent, evidence-backed updates rather than one long document.
How do experiment or pilot learnings feed a continuous improvement loop? Each iteration’s intervention and response should be captured and explicitly labelled as worked, partly worked, or did not work, then used to adjust the next iteration’s plan. Skipping the labelling step is the most common reason pilots generate activity without generating learning.
What role does AI play in continuous impact assessment? AI-based recommendations can continuously monitor an initiative for the conditions that should trigger a fresh look at impact, surface the evidence behind a suggested update, and carry outcome labels forward into a shared evidence base other initiatives can draw on. This keeps the continuous model sustainable for a change team that cannot manually re-check every initiative every week.
Your calendar already tells the story. The daily stand-up. Sprint planning on Monday. The retrospective at the end of the sprint. A program increment planning offsite pencilled in for next month. Over the past decade, change managers have moved into agile teams and taken on their rituals, and for many practitioners the sprint, not the phase gate, is now the real unit of work. That shift has barely bedded in, and AI is already changing what those rituals are for.
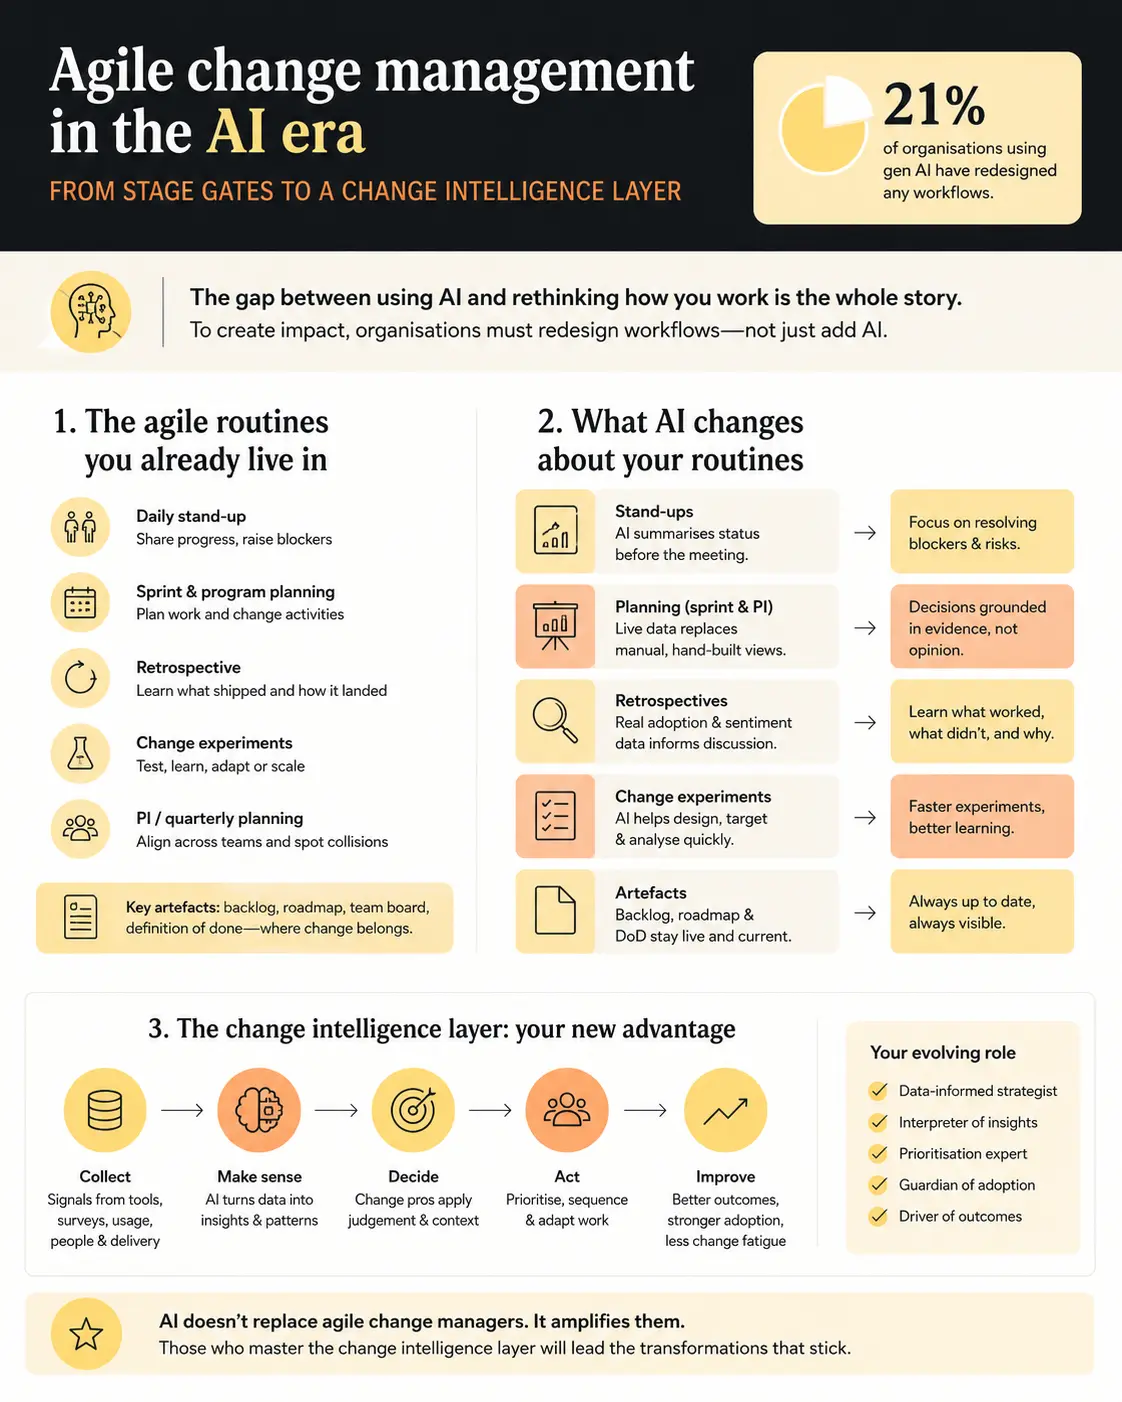
The gap between using AI and rethinking how you work is the whole story here. McKinsey’s 2025 research found that of all the organisational changes linked to gen-AI success, fundamental workflow redesign correlates most strongly with financial impact, yet only 21% of organisations using gen AI have redesigned any workflows at all. Nearly eighty per cent are layering AI on top of processes they have not touched. For change managers, the processes about to be layered on are the agile routines and artefacts you run every week: the stand-ups, the backlogs, the roadmaps, the retrospectives.
This article is about what actually happens to those routines, and about the skill that decides whether you thrive as they change. The interesting question is not whether AI replaces change managers. It is how your agile ways of working are reshaped when AI is in the loop, and why the practitioners who come out ahead are the ones who become stewards and strategists of a change intelligence layer.
The agile routines and artefacts you already live in
Before looking at what changes, it is worth naming what is actually on the table, because the transformation is specific rather than vague. If you work in or alongside an agile delivery team, your week already runs on a familiar set of ceremonies and artefacts.
The routines are the recurring events that give agile its cadence. The ones a change manager is genuinely part of include:
The daily stand-up, where the team shares progress and raises blockers.
Sprint planning, where the team agrees the next short cycle of work, including the change activities that go with it.
The retrospective, where the team looks back at what shipped and how well it landed with the people it affected.
Change experiments, which some teams run as a core agile habit: test an approach with a small group or pilot, see how it lands, and let the result decide whether to adjust, scale, or drop it.
Program increment or quarterly planning, where several teams align on the bigger picture and spot where their work collides.
The artefacts are the objects those events produce and use: the product backlog, the roadmap, the team board, and the definition of done. For a change manager, these are not someone else’s furniture. Change activities increasingly sit as items on the backlog. Adoption criteria increasingly belong in the definition of done. Stakeholder impacts increasingly need to be visible on the same board as the delivery work. The standalone change plan has been folding into the team’s shared backlog for years.
This is the current state that AI now acts on. Not a blank page, but a mature set of routines and artefacts that change managers have spent a decade learning to work within.
What AI changes about your agile routines and artefacts
AI does not abolish the ceremonies. It changes what each one is for, by taking over the manual assembly of information and pushing the human contribution up towards judgement. The pattern is consistent across every routine: the part of the ritual that was about gathering and reconciling status gets automated, and the part that was about deciding what to do gets more important.
The ceremonies
Stand-ups stop being status round-robins. Tooling that reads commits, tickets, and adoption signals can already summarise where work stands before anyone speaks, which means the fifteen minutes shifts from reporting progress to resolving the blockers and risks the summary surfaced. For a change manager, that is a promotion: less time chasing “where are we”, more time on “this initiative is about to land on a team that is already at capacity, and here is the evidence”.
Sprint and program increment planning change most of all. Historically, a change manager walked into planning with a hand-built picture assembled over days: how much change each group was already carrying, where initiatives clashed, how ready each stakeholder group was, and how earlier changes were being adopted. When that picture is generated live from a shared data layer, planning stops being a negotiation between confident opinions and becomes a conversation grounded in evidence: these two initiatives hit the same population in the same window, this group is not yet ready on the measures that predict adoption, and adoption of the last change here has stalled. The change manager’s job in the room moves from bringing the data to interpreting it and deciding what to do about it.
Retrospectives get an honest evidence base. Instead of debating from memory whether a change stuck, the retro can look at real adoption data: usage that rose or stalled, sentiment that moved, the support tickets that spiked. The conversation about what to do differently improves because it starts from what actually happened, not from the loudest recollection in the room.
Change experiments get faster and sharper. When you pilot an approach with one group, AI can help read the result quickly, comparing adoption and sentiment against a group that did not get the new approach, so you can see which version worked and decide whether to adjust, scale it, or drop it. The experiment stays a human decision; the evidence behind it arrives sooner and cleaner.
The artefacts
The artefacts change too, and mostly by absorbing data they never used to carry:
The backlog stops being a plain list of tasks and becomes a list of changes with real impact data attached: who each item affects, how heavily, and when.
The definition of done extends past “the feature works” to “the change is adopted”, so a piece of work is not finished until there is evidence people are actually using it, not just that it launched.
The roadmap stops being a static twelve-month picture and becomes a living view that reflects current load and readiness, and it updates when the plan changes instead of going out of date on the wall.
The team board gains a change dimension, showing not just the work remaining but how much change each group is carrying across everything landing at once.
Notice what every one of these shifts has in common. The ceremony or artefact only improves if the data feeding it is accurate, consistent, and current. An AI-assisted stand-up built on messy, inconsistent change data will still produce a confident summary, it will just be wrong. That dependency is the core of this article, and it is where the change manager’s most valuable work now sits.
The deeper pattern: From ceremony to continuous sensing
Agile itself came from software, and it is worth seeing where the software world took it next, because that is the direction AI is now pushing change work. The best engineering teams no longer rely on ceremonies alone to know what is happening. They run on continuous telemetry: live dashboards of adoption, error rates, and usage that update by the minute, plus dependency maps and release calendars that let one team see, before it ships, that another is about to hit the same service or the same customers.
Three of those habits translate straight into change work. Ship change in small, reversible increments rather than big-bang go-lives, because small changes are easier to absorb and reverse. Sense continuously through behavioural telemetry rather than lagged surveys, so you can act while the signal still matters. And maintain systemic visibility so you can catch two initiatives colliding on the same people before they land, which is change conflict detection by another name. For a number of technology companies, this is already how they work day to day. The methods are proven, and most change teams have adopted the language of agile but not yet this continuous, data-driven way of working.
Why the point-in-time change operating model breaks under AI
Layer AI onto that picture and the reason the old operating model fails becomes specific. AI compresses the build-and-deploy cycle for the changes themselves, so process redesigns that took two quarters now move in weeks. It is also, in the form of AI adoption itself, a rolling wave of change landing on the same people: McKinsey found 88% of organisations now use AI in at least one function but only about a third have scaled it, which means most organisations are in the continuous middle of AI change, not past it. Its work on AI in the workplace adds a twist change managers should sit up for: employees are already adopting AI faster than their leaders realise, so the change is landing on the workforce whether or not a programme is managing it.
Against that cadence, a quarterly, document-driven rhythm fails in diagnosable ways:
The point-in-time impact assessment is stale on arrival. By the time it is signed off, the initiative has moved.
Survey lag hides the moment you needed to see. Sentiment that arrives three weeks late describes a problem you can no longer prevent.
One rating per initiative averages away the truth. A single status for a whole programme conceals that one business unit is drowning while another is idle.
Manual consolidation cannot keep pace. Reconciling a dozen teams’ spreadsheets by hand takes longer than the interval between meaningful changes.
The annual roadmap goes out of date quickly. A fixed twelve-month sequence cannot keep up when AI keeps changing the plan underneath it.
McKinsey’s work on the agentic organisation reaches the same conclusion from the governance side: as work moves continuously, governance “cannot remain a periodic, paper-heavy exercise” and must become real time, data driven, and embedded, with humans holding final accountability. Periodic and paper-heavy is exactly what most change governance still is. The direction of travel is a continuous, data-driven layer with humans in charge of the judgement, and that layer needs an owner.
The change intelligence layer: What replaces the stage gate
If the stage gate is the artefact of the old model, the change intelligence layer is the artefact of the new one, and it is worth defining precisely because the term is easy to wave at and hard to build.
A change intelligence layer is the continuously updated, organisation-specific data foundation that shows, at any moment, how much change each part of the business is carrying, how ready it is, where initiatives collide, and how adoption is tracking, and that feeds this picture to both human decision-makers and AI systems. It is the difference between a folder of assessments and a live nervous system for the portfolio. It is best understood as core infrastructure rather than a reporting nicety, which is the whole case for treating it as a change intelligence platform rather than another dashboard.
What sits in the layer:
Impact data: which roles, teams, and business units each initiative touches, at what depth, and when.
Saturation and load: the cumulative weight of all concurrent change on any given population.
Readiness signals: leadership alignment, capability, and structural readiness, refreshed as conditions move.
Adoption telemetry: behavioural evidence that a change is actually being used, not just launched.
Conflict and overlap: where two or more initiatives hit the same people in the same window.
Here is why this matters specifically in the AI era. Generic AI tools are confidently generic. Ask a general-purpose model to sequence your transformation portfolio and it will give a plausible, well-written answer that knows nothing about your organisation, because it has none of the data above. The AI you are already using becomes genuinely useful for change only when it can read your organisation’s real load, readiness, and conflict data. The layer is what turns a generic assistant into an adviser grounded in your context, the point developed further in what AI can and cannot do without your organisation’s data. Without the layer the AI has no context, and without context it cannot give useful change advice. That is why the layer needs a human owner who understands both the change discipline and the data.
Change managers as data stewards
Data stewardship is the least glamorous phrase in this article and the most important. A data steward owns the definition, quality, consistency, and governance of a class of data. For the change intelligence layer to produce trustworthy signal rather than confident noise, someone has to own change data the way a finance team owns the general ledger. That someone is the change manager.
Consider what happens without stewardship. One team rates impact on a five-point scale, another uses high/medium/low, a third invents its own. “Go-live” means the deployment date to one initiative and the end of hypercare to another. Stakeholder groups are named inconsistently, so the system cannot tell that “Branch Staff” and “Retail Frontline” are the same three thousand people carrying two changes at once. Feed that into an AI model and it will average incompatible scales, miscount overlaps, and generate recommendations that are wrong with total fluency. The problem is not the model. The problem is ungoverned data.
Gartner’s research shows how common and how costly this gap is. In its 2024 survey, poor data literacy sat among the top barriers to data and analytics success, and the sharpest failure points were organisational, not technical: a lack of clear ownership over data initiatives was cited by 69% of respondents, poor results from training by 52%, and more than a quarter said their organisation had no shared understanding of what data literacy even meant. Ownership is the number one gap. For change data, that owner can and should be the change manager.
A change data steward, in practice, owns:
Definitions: a single agreed meaning for impact severity, readiness, go-live, stakeholder group, and every other term the layer depends on.
Quality: the completeness and accuracy of what teams enter, with the standards and follow-up to keep it honest.
Consistency: the same taxonomy across every initiative, so aggregation is valid rather than misleading.
Governance: who can change definitions, how history is preserved, and how the layer stays trustworthy as it grows.
This is unglamorous, and it is decisive. An AI-enabled change function with excellent tools and ungoverned data will simply make faster mistakes. The steward is what makes the intelligence layer worth trusting.
Change managers as data strategists
Stewardship keeps the data clean. Strategy decides what the data should be in the first place, and that is the higher-value half of the role.
A data strategist for change asks a different set of questions. What must this layer be able to answer for our executives, and are we capturing the right data to answer it? Which signals actually predict adoption in our organisation, and are we capturing them or just the ones that are easy to collect? What context does our AI need to give advice we would actually act on, and how do we feed it that context deliberately rather than hoping? These are design questions, and they determine whether the layer drives decisions or just accumulates records.
The strategic payoff is a change in how the portfolio gets governed. Today, prioritisation and sequencing are too often settled by whoever is most senior in the room. A well-designed intelligence layer replaces that with evidence: this population is at saturation, these two initiatives collide in October, this unit is not ready on the dimensions that predict adoption. The strategist’s job is to make the layer answer the questions executives care about, in the language and at the altitude they decide at, the same discipline as presenting a single view of change in executive language rather than practitioner detail.
That reframe, from custodian of a methodology to strategist of a data asset, is the through-line of where the profession is heading. It is why the future of change management in the AI era rewards practitioners who can think in data and systems, not only in stakeholder maps and comms plans. The craft skills still matter. They are now table stakes rather than the differentiator.
How to make the shift: A practical sequence
You do not become a data-led, AI-ready change function by buying a tool and hoping. The move is a sequence, and it can start inside the agile routines you already run. Here is a five-step path a change lead can begin this quarter.
Record each change as structured data, not prose. For every active change, capture who it affects by role and business unit, the timing, and the adoption signals you expect to see, in fields on your backlog or tool rather than buried in a document. If it lives only in a document, the layer cannot read it, which is why teams eventually outgrow the spreadsheet that cannot add up impact across initiatives.
Standardise the definitions. Agree one taxonomy for impact severity, readiness, stakeholder groups, and lifecycle stages, and write it down. This is the steward’s founding act. Without it, every later step compounds inconsistency.
Move sensing into the cadence you already have. You do not need a new meeting. Feed a continuously updated load-and-readiness view into your existing sprint planning, PI planning, and retrospectives, so those ceremonies interrogate live data instead of hand-built decks.
Name the steward explicitly. Decide who owns change data quality and governance, even if it is part of an existing role at first. Gartner’s evidence is blunt: unowned data initiatives fail. Do not leave it implicit.
Put the layer in front of executives, and let AI work on top of it. Once the data is structured, governed, and current, connect it to AI for the analytical lift, surfacing conflicts, forecasting adoption risk, drafting the narrative, and put the resulting picture where decisions get made. The humans keep the judgement.
A common failure worth naming: skipping straight to step five. Bolting AI onto ungoverned, unstructured change data reproduces the McKinsey finding at team level, adding intelligence on top of a broken process rather than fixing the process. Steps one and two are boring and load-bearing. Do them first.
Where a change intelligence platform fits
Everything above can be started in a spreadsheet and a disciplined taxonomy, and for a small portfolio that is a reasonable place to begin. It stops scaling quickly. Once you are aggregating load across dozens of initiatives, detecting conflicts across overlapping populations, and feeding governed data to AI for analysis, the manual version consumes more time than it saves. This is the point of a purpose-built change intelligence platform such as Change Compass: it provides the structured capture, the shared taxonomy, the real-time aggregation, and the portfolio-level view that turn scattered change data into a genuine intelligence layer, and it gives AI the organisation-specific context it needs to move from generic advice to grounded recommendation. The platform is the infrastructure. The steward and strategist are the roles that make it produce something worth acting on.
Where to start
If you take one thing from this, make it the direction, not the destination. Your agile routines are not being abolished; they are being rewired to run on live data, and AI is doing the assembly work that used to fill your week. The change function is moving from a quarterly, document-driven model to a continuous, data-driven one, because AI has raised the cadence of change past the point a periodic rhythm can track. The skill that decides who thrives is not AI fluency in the abstract. It is the ability to steward change data so it can be trusted, and to strategise about what that data should answer.
Start this week with one concrete act inside a ceremony you already run: at your next planning session, agree a single shared definition of impact severity and stakeholder group across all your active initiatives. That is step two of the sequence, it costs nothing but a conversation, and it is the foundation the entire intelligence layer is built on. Get the definitions right and every later step, the automation, the forecasting, the executive reporting, becomes possible. Skip them and even the best AI will only give you fast, confident answers that are wrong.
Frequently asked questions
What happens to agile ceremonies like stand-ups and sprint planning when AI is involved?
AI does not remove the ceremonies; it changes what they are for. The manual work of gathering and reconciling status gets automated, so stand-ups shift from reporting progress to resolving blockers, and planning shifts from bringing hand-built data to interpreting live evidence. Human facilitation, discussion, and judgement remain essential, and arguably become the whole point of the meeting.
What is a change intelligence layer?
A change intelligence layer is a continuously updated, organisation-specific data foundation that shows how much change each part of the business is carrying, how ready it is, where initiatives collide, and how adoption is tracking. It replaces point-in-time assessments with a live view and gives AI systems the real context they need to produce useful, grounded advice rather than generic recommendations.
Why do change managers need to become data stewards?
Because an AI-enabled change function is only as good as the data it runs on. A data steward owns the definitions, quality, consistency, and governance of change data, so that when it is aggregated across initiatives or fed to AI, the result is trustworthy rather than confidently wrong. Gartner consistently finds that unowned data initiatives are among the most likely to fail, which makes explicit stewardship decisive rather than optional.
How is agile change management different from traditional change management?
Traditional change management works in large, sequential phases governed by periodic stage gates and point-in-time assessments. Agile change management works in small increments with continuous sensing of load, readiness, and adoption, steering the portfolio in a rolling cadence rather than a quarterly one. The AI era pushes change towards the agile model because it raises the rate at which change arrives.
Does AI replace change managers?
No, but it changes what the role is for. AI handles the analytical assembly, surfacing conflicts, forecasting adoption risk, drafting narratives, while humans hold the judgement and accountability. The change manager’s centre of gravity shifts from producing documents to designing and governing the data layer that AI, executives, and agile teams all draw on, which is a higher-value role than the one it replaces.
Most organisations anticipate disruption around go-live. That’s when attention focuses on system stability, support readiness, and whether the new process flows will actually work. But the real crisis arrives 10 to 14 days later.
Week two is when peak disruption hits. Not because the system fails, as often it’s running adequately by then, but because the gap between how work was supposed to work and how it actually works becomes unavoidable. Training scenarios don’t match real workflows. Data quality issues surface when people need specific information for decisions. Edge cases that weren’t contemplated during design hit customer-facing teams. Workarounds that started as temporary solutions begin cascading into dependencies.
This pattern appears consistently across implementation types. EHR systems experience it. ERP platforms encounter it. Business process transformations face it. The specifics vary, but the timing holds: disruption intensity peaks in week two, then either stabilises or escalates depending on how organisations respond.
Understanding why this happens, what value it holds, and how to navigate it strategically is critical, especially when organisations are managing multiple disruptions simultaneously across concurrent projects. That’s where most organisations genuinely struggle.
The pattern: why disruption peaks in week 2
Go-live day itself is deceptive. The environment is artificial. Implementation teams are hypervigilant. Support staff are focused exclusively on the new system. Users know they’re being watched. Everything runs at artificial efficiency levels.
By day four or five, reality emerges. Users relax slightly. They try the workflows they actually do, not the workflows they trained on. They hit the branch of the process tree that the scripts didn’t cover. A customer calls with a request that doesn’t fit the designed workflow. Someone realises they need information from the system that isn’t available in the standard reports. A batch process fails because it references data fields that weren’t migrated correctly.
These issues arrive individually, then multiply.
Research on implementation outcomes shows this pattern explicitly. A telecommunications case study deploying a billing system shows week one system availability at 96.3%, week two still at similar levels, but by week two incident volume peaks at 847 tickets per week. Week two is not when availability drops. It’s when people discover the problems creating the incidents.
Here’s the cascade that makes week two critical:
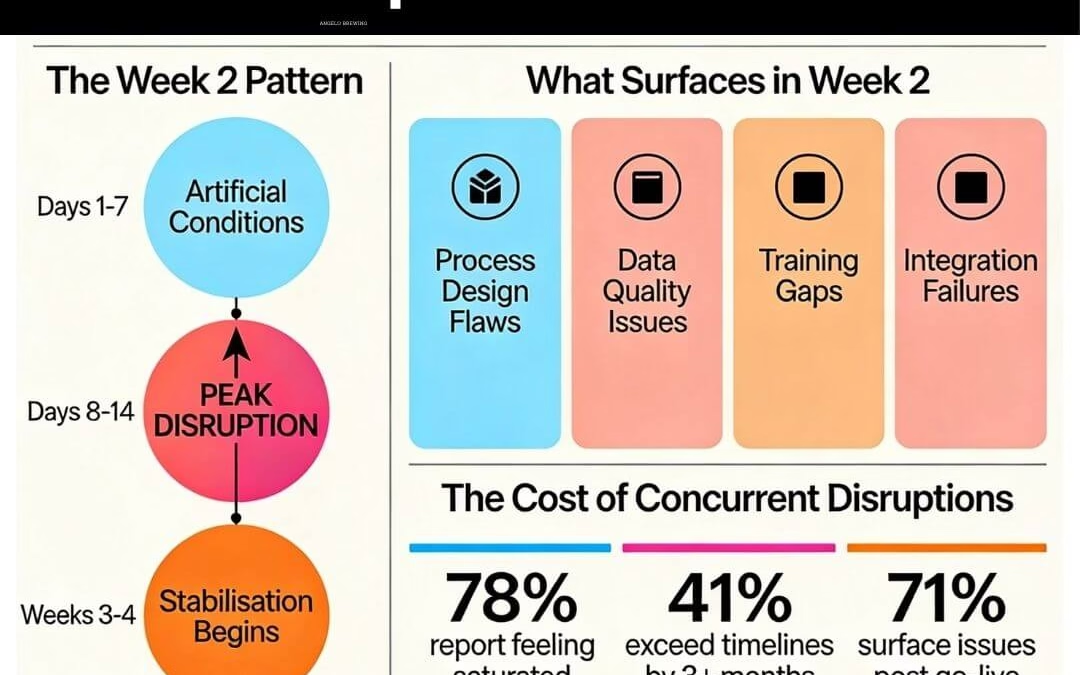
Days 1 to 7: Users work the happy paths. Trainers are embedded in operations. Ad-hoc support is available. Issues get resolved in real time before they compound. The system appears to work.
Days 8 to 14: Implementation teams scale back support. Users begin working full transaction volumes. Edge cases emerge systematically. Support systems become overwhelmed. Individual workarounds begin interconnecting. Resistance crystallises, and Prosci research shows resistance peaks 2 to 4 weeks post-implementation. By day 14, leadership anxiety reaches a peak. Finance teams close month-end activities and hit system constraints. Operations teams process their full transaction volumes and discover performance issues. Customer service teams encounter customer scenarios not represented in training.
Weeks 3 to 4: Either stabilisation occurs through focused remediation and support intensity, or problems compound further. Organisations that maintain intensive support through week two recover within 60 to 90 days. Those that scale back support too early experience extended disruption lasting months.
The research quantifies this. Performance dips during implementation average 10 to 25%, with complex systems experiencing dips of 40% or more. These dips are concentrated in weeks 1 to 4, with week two as the inflection point. Supply chain systems average 12% productivity loss. EHR systems experience 5 to 60% depending on customisation levels. Digital transformations typically see 10 to 15% productivity dips.
The depth of the dip depends on how well organisations manage the transition. Without structured change management, productivity at week three sits at 65 to 75% of pre-implementation levels, with recovery timelines extending 4 to 6 months. With effective change management and continuous support, recovery happens within 60 to 90 days.
Understanding the value hidden in disruption
Most organisations treat week-two disruption as a problem to minimise. They try to manage through it with extended support, workarounds, and hope. But disruption, properly decoded, provides invaluable intelligence.
Each issue surfaced in week two is diagnostic data. It tells you something real about either the system design, the implementation approach, data quality, process alignment, or user readiness. Organisations that treat these issues as signals rather than failures extract strategic value.
Process design flaws surface quickly.
A customer-service workflow that seemed logical in design fails when customer requests deviate from the happy path. A financial close process that was sequenced one way offline creates bottlenecks when executed at system speed. A supply chain workflow that assumed perfect data discovers that supplier codes haven’t been standardised. These aren’t implementation failures. They’re opportunities to redesign processes based on actual operational reality rather than theoretical process maps.
Integration failures reveal incompleteness.
A data synchronisation issue between billing and provisioning systems appears in week two when the volume of transactions exposing the timing window is processed. A report that aggregates data from multiple systems fails because one integration wasn’t tested with production data volumes. An automated workflow that depends on customer master data being synchronised from an upstream system doesn’t trigger because the synchronisation timing was wrong. These issues force the organisation to address integration robustness rather than surfacing in month six when it’s exponentially more costly to fix.
Training gaps become obvious.
Not because users lack knowledge, as training was probably thorough, but because knowledge retention drops dramatically once users are under operational pressure. That field on a transaction screen no one understood in training becomes critical when a customer scenario requires it. The business rule that sounded straightforward in the classroom reveals nuance when applied to real transactions. Workarounds start emerging not because the system is broken but because users revert to familiar mental models when stressed.
Data quality problems declare themselves.
Historical data migration always includes cleansing steps. Week two is when cleansed data collides with operational reality. Customer address data that was “cleaned” still has variants that cause matching failures. Supplier master data that was de-duplicated still includes records no one was aware of. Inventory counts that were migrated don’t reconcile with physical systems because the timing window wasn’t perfect. These aren’t test failures. They’re production failures that reveal where data governance wasn’t rigorous enough.
System performance constraints appear under load.
Testing runs transactions in controlled batches. Real operations involve concurrent transaction volumes, peak period spikes, and unexpected load patterns. Performance issues that tests didn’t surface appear when multiple users query reports simultaneously or when a batch process runs whilst transaction processing is also occurring. These constraints force decisions about infrastructure, system tuning, or workflow redesign based on evidence rather than assumptions.
Adoption resistance crystallises into actionable intelligence.
Resistance in weeks 1 to 2 often appears as hesitation, workaround exploration, or question-asking. By week two, if resistance is adaptive and rooted in legitimate design or readiness concerns, it becomes specific. “The workflow doesn’t work this way because of X” is more actionable than “I’m not ready for this system.” Organisations that listen to week-two resistance can often redesign elements that actually improve the solution.
The organisations that succeed at implementation are those that treat week-two disruption as discovery rather than disaster. They maintain support intensity specifically because they know disruption reveals critical issues. They establish rapid response mechanisms. They use the disruption window to test fixes and process redesigns with real operational complexity visible for the first time.
This doesn’t mean chaos is acceptable. It means disruption, properly managed, delivers value.
The reality when disruption stacks: multiple concurrent go-lives
The week-two disruption pattern assumes focus. One system. One go-live. One disruption window. Implementation teams concentrated. Support resources dedicated. Executive attention singular.
This describes almost no large organisations actually operating today.
Most organisations manage multiple implementations simultaneously. A financial services firm launches a new customer data platform, updates its payments system, and implements a revised underwriting workflow across the same support organisations and user populations. A healthcare system deploys a new scheduling system, upgrades its clinical documentation platform, and migrates financial systems, often on overlapping timelines. A telecommunications company implements BSS (business support systems) whilst updating OSS (operational support systems) and launching a new customer portal.
When concurrent disruptions overlap, the impacts compound exponentially rather than additively.
Disruption occurring at week two for Initiative A coincides with go-live week one for Initiative B and the first post-implementation month for Initiative C. Support organisations are stretched across three separate incident response mechanisms. Training resources are exhausted from Initiative A training when Initiative B training ramps. User psychological capacity, already strained from one system transition, absorbs another concurrently.
Research on concurrent change shows this empirically. Organisations managing multiple concurrent initiatives report 78% of employees feeling saturated by change. Change-fatigued employees show 54% higher turnover intentions compared to 26% for low-fatigue employees. Productivity losses don’t add up; they cascade. One project’s 12% productivity loss combined with another’s 15% loss doesn’t equal 27% loss. Concurrent pressures often drive losses exceeding 40 to 50%.
The week-two peak disruption of Initiative A, colliding with go-live intensity for Initiative B, creates what one research study termed “stabilisation hell”, a period where organisations struggle simultaneously to resolve unforeseen problems, stabilise new systems, embed users, and maintain business-as-usual operations.
Consider a real scenario. A financial services firm deployed three major technology changes into the same operations team within 12 weeks. Initiative A: New customer data platform. Initiative B: Revised loan underwriting workflow. Initiative C: Updated operational dashboard.
Week four saw Initiative A hit its week-two peak disruption window. Incident volumes spiked. Data quality issues surfaced. Workarounds proliferated. Support tickets exceeded capacity. Week five, Initiative B went live. Training for a new workflow began whilst Initiative A fires were still burning. Operations teams were learning both systems on the fly.
Week eight, Initiative C launched. By then, operations teams had learned two new systems, embedded neither, and were still managing Initiative A stabilisation issues. User morale was low. Stress was high. Error rates were increasing. The organisation had deployed three initiatives but achieved adoption of none. Each system remained partially embedded, each adoption incomplete, each system contributing to rather than resolving operational complexity.
Research on this scenario is sobering. 41% of projects exceed original timelines by 3+ months. 71% of projects surface issues post go-live requiring remediation. When three projects encounter week-two disruptions simultaneously or overlappingly, the probability that all three stabilise successfully drops dramatically. Adoption rates for concurrent initiatives average 60 to 75%, compared to 85 to 95% for single initiatives. Recovery timelines extend from 60 to 90 days to 6 to 12 months or longer.
The core problem: disruption is valuable for diagnosis, but only if organisations have capacity to absorb it. When capacity is already consumed, disruption becomes chaos.
Strategies to prevent operational collapse across the portfolio
Preventing operational disruption when managing concurrent initiatives requires moving beyond project-level thinking to portfolio-level orchestration. This means designing disruption strategically rather than hoping to manage through it.
Step 1: Sequence initiatives to prevent concurrent peak disruptions
The most direct strategy is to avoid allowing week-two peak disruptions to occur simultaneously.
This requires mapping each initiative’s disruption curve. Initiative A will experience peak disruption weeks 2 to 4. Initiative B, scheduled to go live once Initiative A stabilises, will experience peak disruption weeks 8 to 10. Initiative C, sequenced after Initiative B stabilises, disrupts weeks 14 to 16. Across six months, the portfolio experiences three separate four-week disruption windows rather than three concurrent disruption periods.
Does sequencing extend overall timeline? Technically yes. Initiative A starts week one, Initiative B starts week six, Initiative C starts week twelve. Total programme duration: 20 weeks vs 12 weeks if all ran concurrently. But the sequencing isn’t linear slowdown. It’s intelligent pacing.
More critically: what matters isn’t total timeline, it’s adoption and stabilisation. An organisation that deploys three initiatives serially over six months with each fully adopted, stabilised, and delivering value exceeds in value an organisation that deploys three initiatives concurrently in four months with none achieving adoption above 70%.
Sequencing requires change governance to make explicit trade-off decisions. Do we prioritise getting all three initiatives out quickly, or prioritise adoption quality? Change portfolio management creates the visibility required for these decisions, showing that concurrent Initiative A and B deployment creates unsustainable support load, whereas sequencing reduces peak support load by 40%.
Step 2: Consolidate support infrastructure across initiatives
When disruptions must overlap, consolidating support creates capacity that parallel support structures don’t.
Most organisations establish separate support structures for each initiative. Initiative A has its escalation path. Initiative B has its own. Initiative C has its own. This creates three separate 24-hour support rotations, three separate incident categorisation systems, three separate communication channels.
Consolidated support establishes one enterprise support desk handling all issues concurrently. Issues get triaged to the appropriate technical team, but user-facing experience is unified. A customer-service representative doesn’t know whether their problem stems from Initiative A, B, or C, and shouldn’t have to. They have one support number.
Consolidated support also reveals patterns individual support teams miss. When issues across Initiative A and B appear correlated, when Initiative B’s workflow failures coincide with Initiative A data synchronisation issues, consolidated support identifies the dependency. Individual teams miss this connection because they’re focused only on their initiative.
Step 3: Integrate change readiness across initiatives
Standard practice means each initiative runs its own readiness assessment, designs its own training programme, establishes its own change management approach.
This creates training fragmentation. Users receive five separate training programmes from five separate change teams using five different approaches. Training fatigue emerges. Messaging conflicts create confusion.
Integrated readiness means:
One readiness framework applied consistently across all initiatives
Consolidated training covering all initiatives sequentially or in integrated learning paths where possible
Unified change messaging that explains how the portfolio of changes supports a coherent organisational direction
Shared adoption monitoring where one dashboard shows readiness and adoption across all initiatives simultaneously
This doesn’t require initiatives to be combined technically. Initiative A and B remain distinct. But from a change management perspective, they’re orchestrated.
Research shows this approach increases adoption rates 25 to 35% compared to parallel change approaches.
Step 4: Create structured governance over portfolio disruption
Change portfolio management governance operates at two levels:
Initiative level: Sponsor, project manager, change lead, communications lead manage Initiative A’s execution, escalations, and day-to-day decisions.
Portfolio level: Representatives from all initiatives meet fortnightly to discuss:
Emerging disruptions across all initiatives
Support load analysis, identifying where capacity limits are being hit
Escalation patterns and whether issues are compounding across initiatives
Readiness progression and whether adoption targets are being met
Adjustment decisions, including whether to slow Initiative B to support Initiative A stabilisation
Portfolio governance transforms reactive problem management into proactive orchestration. Instead of discovering in week eight that support capacity is exhausted, portfolio governance identifies the constraint in week four and adjusts Initiative B timeline accordingly.
Tools like The Change Compass provide the data governance requires. Real-time dashboards show support load across initiatives. Heatmaps reveal where particular teams are saturated. Adoption metrics show which initiatives are ahead and which are lagging. Incident patterns identify whether issues are initiative-specific or portfolio-level.
Step 5: Use disruption windows strategically for continuous improvement
Week-two disruptions, whilst painful, provide a bounded window for testing process improvements. Once issues surface, organisations can test fixes with real operational data visible.
Rather than trying to suppress disruption, portfolio management creates space to work within it:
Days 1 to 7: Support intensity is maximum. Issues are resolved in real time. Limited time for fundamental redesign.
Days 8 to 14: Peak disruption is more visible. Teams understand patterns. Workarounds have emerged. This is the window to redesign: “The workflow doesn’t work because X. Let’s redesign process Y to address this.” Changes tested at this point, with full production visibility, are often more effective than changes designed offline.
Weeks 3 to 4: Stabilisation period. Most issues are resolved. Remaining issues are refined through iteration.
Organisations that allocate capacity specifically for week-two continuous improvement often emerge with more robust solutions than those that simply try to push through disruption unchanged.
Operational safeguards: systems to prevent disruption from becoming crisis
Beyond sequencing and governance, several operational systems prevent disruption from cascading into crisis:
Load monitoring and reporting
Before initiatives launch, establish baseline metrics:
Support ticket volume (typical week has X tickets)
Incident resolution time (typical issue resolves in Y hours)
User productivity metrics (baseline is Z transactions per shift)
System availability metrics (target is 99.5% uptime)
During disruption weeks, track these metrics daily. When tickets approach 150% of baseline, escalate. When resolution times extend beyond 2x normal, adjust support allocation. When productivity dips exceed 30%, trigger contingency actions.
This monitoring isn’t about stopping disruption. It’s about preventing disruption from becoming uncontrolled. The organisation knows the load is elevated, has data quantifying it, and can make decisions from evidence rather than impression.
Readiness assessment across the portfolio
Don’t run separate readiness assessments. Run one portfolio-level readiness assessment asking:
Which populations are ready for Initiative A?
Which are ready for Initiative B?
Which face concurrent learning demand?
Where do we have capacity for intensive support?
Where should we reduce complexity or defer some initiatives?
This single assessment reveals trade-offs. “Operations is ready for Initiative A but faces capacity constraints with Initiative B concurrent. Options: Defer Initiative B two weeks, assign additional change support resources, or simplify Initiative B scope for operations teams.”
Blackout periods and pacing restrictions
Most organisations establish blackout periods for financial year-end, holiday periods, or peak operational seasons. Many don’t integrate these with initiative timing.
Portfolio management makes these explicit:
October to December: Reduced change deployment (year-end focus)
January weeks 1 to 2: No major launches (people returning from holidays)
July to August: Minimal training (summer schedules)
March to April: Capacity exists; good deployment window
Planning initiatives around blackout periods and organisational capacity rhythms rather than project schedules dramatically improves outcomes.
Contingency support structures
For initiatives launching during moderate-risk windows, establish contingency support plans:
If adoption lags 15% behind target by week two, what additional support deploys?
If critical incidents spike 100% above baseline, what escalation activates?
If user resistance crystallises into specific process redesign needs, what redesign process engages?
If stabilisation targets aren’t met by week four, what options exist?
This isn’t pessimism. It’s realistic acknowledgement that week-two disruption is predictable and preparations can address it.
Integrating disruption management into change portfolio operations
Preventing operational disruption collapse requires integrating disruption management into standard portfolio operations:
Month 1: Portfolio visibility
Map all concurrent initiatives
Identify natural disruption windows
Assess portfolio support capacity
Month 2: Sequencing decisions
Determine which initiatives must sequence vs which can overlap
Identify where support consolidation is possible
Establish integrated readiness framework
Month 3: Governance establishment
Launch portfolio governance forum
Establish disruption monitoring dashboards
Create escalation protocols
Months 4 to 12: Operational execution
Monitor disruption curves as predicted
Activate contingencies if necessary
Capture continuous improvement opportunities
Track adoption across portfolio
Tools supporting this integration, such as change portfolio platforms like The Change Compass, provide the visibility and monitoring capacity required. Real-time dashboards show disruption patterns as they emerge. Adoption tracking reveals whether initiatives are stabilising or deteriorating. Support load analytics identify bottleneck periods before they become crises.
The research imperative: what we know about disruption
The evidence on implementation disruption is clear:
Week-two peak disruption is predictable, not random
Disruption provides diagnostic value when organisations have capacity to absorb and learn from it
Concurrent disruptions compound exponentially, not additively
Sequencing initiatives strategically improves adoption and stabilisation vs concurrent deployment
Organisations with portfolio-level governance achieve 25 to 35% higher adoption rates
Recovery timelines for managed disruption: 60 to 90 days; unmanaged disruption: 6 to 12 months
The alternative to strategic disruption management is reactive crisis management. Most organisations experience week-two disruption reactively, scrambling to support, escalating tickets, hoping for stabilisation. Some organisations, especially those managing portfolios, are choosing instead to anticipate disruption, sequence it thoughtfully, resource it adequately, and extract value from it.
The difference in outcomes is measurable: adoption, timeline, support cost, employee experience, and long-term system value.
Frequently asked questions
Why does disruption peak specifically at week 2, not week 1 or week 3?
Week one operates under artificial conditions: hypervigilant support, implementation team presence, trainers embedded, users following scripts. Real patterns emerge when artificial conditions end. Week two is when users attempt actual workflows, edge cases surface, and accumulated minor issues combine. Peak incident volume and resistance intensity typically occur weeks 2 to 4, with week two as the inflection point.
Should organisations try to suppress week-two disruption?
No. Disruption reveals critical information about process design, integration completeness, data quality, and user readiness. Suppressing it masks problems. The better approach: acknowledge disruption will occur, resource support intensity specifically for the week-two window, and use the disruption as diagnostic opportunity.
How do we prevent week-two disruptions from stacking when managing multiple concurrent initiatives?
Sequence initiatives to avoid concurrent peak disruption windows. Consolidate support infrastructure across initiatives. Integrate change readiness across initiatives rather than running parallel change efforts. Establish portfolio governance making explicit sequencing decisions. Use change portfolio tools providing real-time visibility into support load and adoption across all initiatives.
What’s the difference between well-managed disruption and unmanaged disruption in recovery timelines?
Well-managed disruption with adequate support resources, portfolio orchestration, and continuous improvement capacity returns to baseline productivity within 60 to 90 days post-go-live. Unmanaged disruption with reactive crisis response, inadequate support, and no portfolio coordination extends recovery timelines to 6 to 12 months or longer, often with incomplete adoption.
Can change portfolio management eliminate week-two disruption?
No, and that’s not the goal. Disruption is inherent in significant change. Portfolio management’s purpose is to prevent disruption from cascading into crisis, to ensure organisations have capacity to absorb disruption, and to extract value from disruption rather than merely enduring it.
How does the size of an organisation affect week-two disruption patterns?
Patterns appear consistent: small organisations, large enterprises, government agencies all experience week-two peak disruption. Scale affects the magnitude. A 50-person firm’s week-two disruption affects everyone directly, whilst a 5,000-person firm’s disruption affects specific departments. The timing and diagnostic value remain consistent.
What metrics should we track during the week-two disruption window?
Track system availability (target: maintain 95%+), incident volume (expect 200%+ of normal), mean time to resolution (expect 2x baseline), support ticket backlog (track growth and aging), user productivity in key processes (expect 65 to 75% of baseline), adoption of new workflows (expect initial adoption with workaround development), and employee sentiment (expect stress with specific resistance themes).
How can we use week-two disruption data to improve future implementations?
Document incident patterns, categorise by root cause (design, integration, data, training, performance), and use these insights for process redesign. Test fixes during week-two disruption when full production complexity is visible. Capture workarounds users develop, as they often reveal legitimate unmet needs. Track which readiness interventions were most effective. Use this data to tailor future implementations.
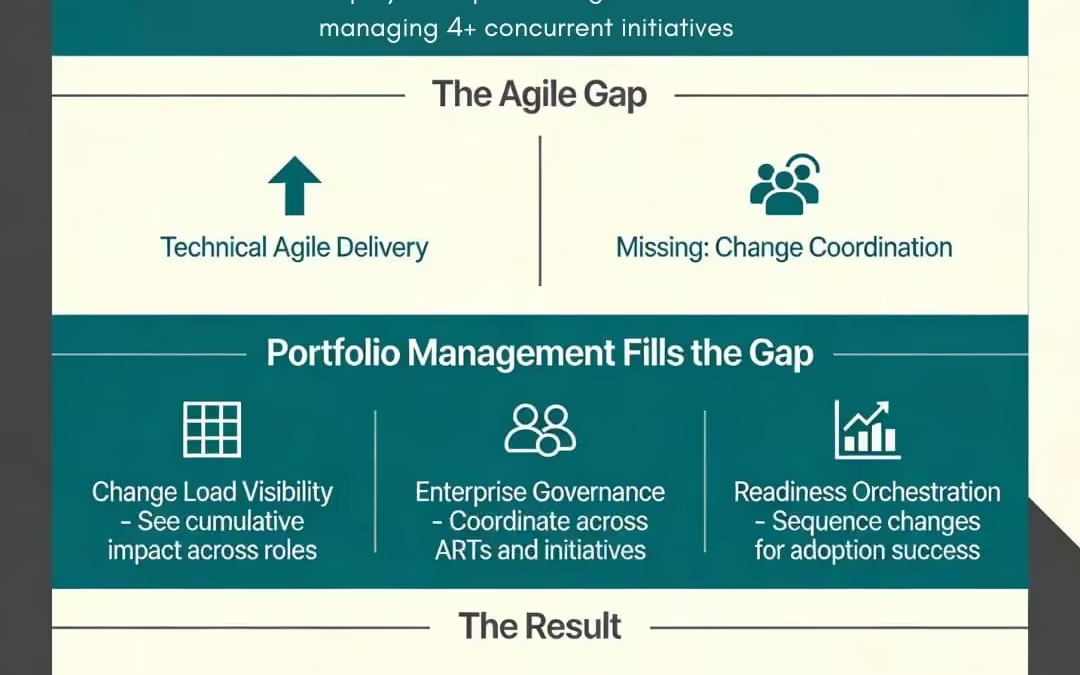
Agile has become the technical operating model for large organisations. You’ll find Scrum teams in finance, Kanban boards in HR, Scaled Agile frameworks spanning entire technology divisions. The velocity and responsiveness are real. What’s also becoming real, though less often discussed, is the hidden cost: when agile technical delivery isn’t matched with agile change management, employees experience whiplash rather than transformation.
A financial services firm we worked with exemplifies the problem. They had implemented SAFe (Scaled Agile) across 150 people split into 12 Agile Release Trains (ARTs). Each ART could ship features in 2-week sprints. The technical execution was solid. But frontline teams found themselves managing changes from five different initiatives simultaneously. Loan officers had training sessions every two weeks. Operations teams were learning new systems before they’d embedded the previous one. The organisation was delivering change at maximum velocity into people who had hit their saturation limit months earlier. After three quarters, they’d achieved technical agility but created change fatigue that actually slowed adoption and spiked operations disruption.
This scenario repeats across industries because organisations may have solved the technical orchestration problem without solving the human orchestration problem. Scaled Agile frameworks like SAFe address how distributed technical teams coordinate delivery. They’re silent on how those technical changes orchestrate employee experience across the organisation. That silence is the gap this article addresses.
The agile norm and the coordination challenge it creates
Agile as a delivery model is now standard practice. What’s still emerging is how organisations manage the change that agile delivery creates at scale.
Here’s the distinction. When a single agile team builds a feature, the team manages its own change: they decide on testing approach, communication cadence, stakeholder engagement. When 12 ARTs build different capabilities simultaneously – a new customer data platform, a revised underwriting workflow, a redesigned payments system – the change impacts collide. Different teams create different messaging. Training runs parallel rather than sequenced. Employee readiness and adoption are fragmented across initiatives.
The heart of the problem is this: agile teams are optimised for one thing, delivering customer-facing capability quickly and iteratively. They operate with sprint goals, velocity metrics, and deployment cadences measured in days. Change – the human, business, and operational impacts of what’s being delivered – operates on different cycles. Change readiness takes weeks or months. Adoption roots over months. People can internalise 2-3 concurrent changes effectively; beyond that, fatigue or inadequate attention set in and adoption rates fall.
Research into agile transformations confirms this tension: 78% of employees report feeling saturated by change when managing concurrent initiatives, and organisations where saturation thresholds are exceeded experience measurable productivity declines and turnover acceleration. Yet these same organisations have achieved technical agile excellence.
The solution isn’t to slow agile delivery. It’s to apply agile principles to change itself – specifically, to orchestrate how multiple change initiatives coordinate their impacts on people and the organisation.
What standard agile practices deliver and where they fall short
Standard agile practices are designed around one core principle: break complex work into smaller discrete pieces, iterate fast in smaller cycles, and use small cross-functional teams to deliver customer outcomes efficiently.
Applied to technical delivery, this works remarkably well. Breaking a major system redesign into two-week sprints means you get feedback every fortnight. You can course-correct within days rather than discovering fatal flaws after six months of waterfall planning. Smaller teams move faster and communicate better than large programmes. Cross-functional teams reduce handoffs and accelerate decision-making.
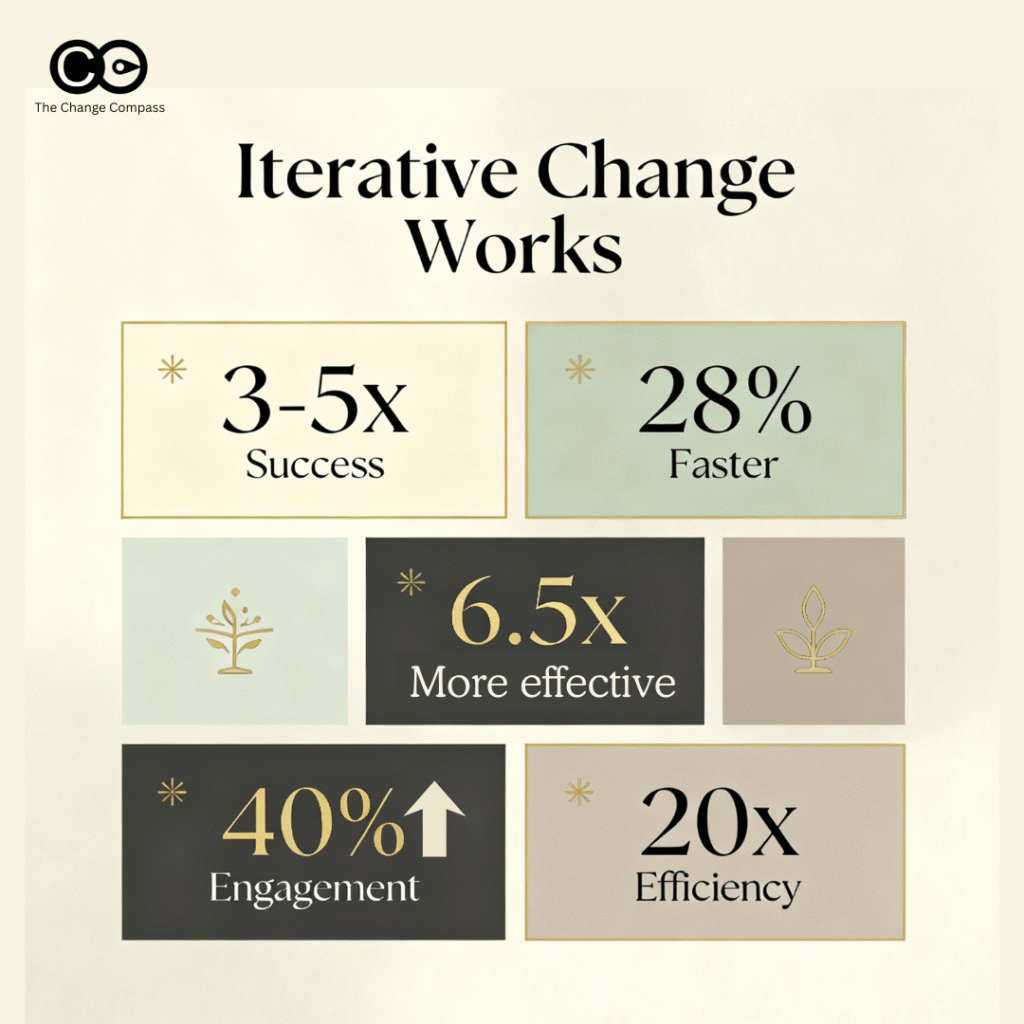
The effectiveness is measurable. Organisations using iterative, feedback-driven approaches achieve 6.5 times higher success rates than those using linear project management. Continuous measurement delivers 25-35% higher adoption rates than single-point assessments.
But here’s where most organisations get stuck: they implement these technical agile practices without designing the connective glue across initiatives.
Agile thinking within a team doesn’t automatically create agile orchestration across teams. The coordination mechanisms required are different:
Within a team: Agile ceremonies (daily standups, sprint planning, retrospectives) keep a small group aligned. The team shares context daily and adjusts course together.
Across an enterprise with 12 ARTs: There’s no daily standup where everyone appears. There’s no single sprint goal. Different ARTs deploy on different cadences. Without explicit coordination structures, each team optimises locally – which means each team’s change impacts ripple outward without visibility into what other teams are doing.
A customer service rep experiences this fragmentation. Monday she’s in training for the new loan decision system (ART 1). Wednesday she learns the updated customer data workflow (ART 2). Friday she’s reoriented on the new phone system interface (ART 3). Each change is well-designed. Each training is clear. But the content and positioning of these may not be aligned, and their cumulative impact overwhelms the rep’s capacity to learn and embed new ways of working.
The gap isn’t in the quality of individual agile teams. The gap is in the orchestration infrastructure that says: “These three initiatives are landing simultaneously for this population. Let’s redesign sequencing or consolidate training or defer one initiative to create breathing room.” That kind of orchestration requires visibility and decision-making above the individual ART level.
The missing piece: Enterprise-level change coordination
A lot of large organisations have some aspects of scaled agile approach. SAFe includes Program Increment (PI) Planning – a quarterly event where 100+ people from multiple ARTs align on features, dependencies, and capacity across teams. PI Planning is genuinely useful for technical coordination. It prevents duplicate work. It surfaces dependency chains. It creates realistic capacity expectations.
But PI Planning is built for technical delivery, not change impact. It answers: “What will we build this quarter?” It doesn’t answer: “What change will people experience? Which teams face the most disruption? What’s the cumulative employee impact if we proceed as planned?”
This is where change portfolio management enters the picture.
Change portfolio management takes the same orchestration principle that PI Planning applies to features – explicit, cross-team coordination – and applies it to the human and business impacts of change. It answers questions PI Planning can’t:
How many concurrent changes is each role absorbing?
When do we have natural low-change periods where we can embed recent changes before launching new ones?
What’s the cumulative training demand if we proceed with current sequencing?
Are certain teams becoming change-saturated whilst others have capacity?
Which changes are creating the highest resistance, and what does that tell us about design or readiness?
Portfolio management provides three critical functions that distributed agile teams don’t naturally create:
1. Employee/customer change experience design
This means deliberately designing the end-to-end experience of change from the employee’s perspective, not the project’s perspective. If a customer service rep is affected by five initiatives, what’s the optimal way to sequence training? How do we consolidate messaging across initiatives? How do we create clarity about what’s changing vs. what’s staying the same?
Rather than asking “How does each project communicate its changes?”—which creates five separate messaging streams—portfolio management asks “How does the organisation communicate these five changes cohesively?” The difference is profound. It shifts from coordination to integration.
2. People impact monitoring and reporting
Portfolio management tracks metrics that individual projects miss:
Change saturation per roletype: Is the finance team absorbing 2 changes or 7?
Readiness progression: Are training completion rates healthy across initiatives or are they clustering in some areas?
Adoption trajectories: Post-launch, are people actually using new systems/processes or finding workarounds?
Fatigue indicators: Are turnover intentions rising in heavily impacted populations?
These metrics don’t appear in project dashboards because they’re enterprise metrics and not about project delivery. Individual projects see their own adoption. The portfolio sees whether adoption is hindered by saturation in an adjacent initiative.
3. Readiness and adoption design at organisational level
Rather than each project running its own readiness assessment and training programme, portfolio management creates:
A shared readiness framework applied consistently across initiatives, allowing apple-to-apple comparisons
Sequenced capability building (you embed the customer data system before launching the new workflow that depends on clean data)
Consolidated training calendars (rather than five separate training schedules)
Shared adoption monitoring (one dashboard showing whether organisations are actually using the changes or resisting them)
The orchestration infrastructure required
Supporting rapid transformation without burnout requires four specific systems:
1. Change governance across business and enterprise levels
Governance isn’t bureaucracy here. It’s decision-making structure. You need forums where:
Initiative-level change governance (exists in most organisations):
Project sponsor, change lead, communications lead meet weekly
Decisions: messaging, training content, resistance management, adoption tactics
Focus: making this project’s change land successfully
Representatives from each ART, plus HR, plus finance, plus communications
Meet biweekly
Decisions: sequencing of initiatives, portfolio saturation, resource allocation across change efforts, blackout periods
Focus: managing cumulative impact and capacity across all initiatives
The enterprise governance layer is where PI Planning concepts get applied to people. Just as technical PI Planning prevents two ARTs from building the same feature, enterprise change governance prevents two initiatives from saturating the same population simultaneously.
2. Load monitoring and reporting
You can’t manage what you don’t measure. Portfolio change requires visibility into:
Change unit allocation per role Create a simple matrix: Across the vertical axis, list all role types/teams. Across the horizontal axis, list all active initiatives (not just IT – include process changes, restructures, system migrations, anything requiring people to work differently). For each intersection, mark which initiatives touch which roles.
The heatmap becomes immediately actionable. If Customer Service is managing 4 decent-sized changes simultaneously, that’s saturation territory. If you’re planning to launch Programme 5, you know it cannot hit Customer Service until one of their current initiatives is embedded.
Saturation scoring Develop a simple framework:
1-2 concurrent changes per role = Green (sustainable)
4+ concurrent changes = Red (saturation, adoption at risk)
Track this monthly. When saturation appears, trigger decisions: defer an initiative, accelerate embedding of a completed initiative, add change support resources.
When you’re starting out this is the first step. However, when you’re managing a large enterprise with a large volume of projects as well as business-as-usual initiatives, you need finer details in rating the level of impact at an initiative and impact activity level.
Training demand consolidation Rather than five initiatives each scheduling 2-day training courses, portfolio planning consolidates:
Weeks 1-3: Data quality training (prerequisite for multiple initiatives)
Weeks 4-5: New systems training (customer data + general ledger)
Week 6: Process redesign workshop
Weeks 7-8: Embedding (no new training, focus on bedding in changes)
This isn’t sequential delivery (which would slow things down). It’s intelligent batching of learning so that people absorb multiple changes within a supportable timeframe rather than fragmenting across five separate schedules.
3. Shared understanding of heavy workload and blackout periods
Different parts of organisations experience different natural rhythms. Financial services has heavy change periods around year-end close. Retail has saturation during holiday season preparation. Healthcare has patient impact considerations that create unavoidable busy periods.
Portfolio management makes these visible explicitly:
Peak change load periods (identified 12 months ahead):
January: Post-holidays, people are fresh, capacity exists
March-April: Reporting season hits finance; new product launches hit customer-facing teams
June-July: Planning seasons reduce availability for major training
September-October: Budget cycles demand focus in multiple teams
November-December: Year-end pressures spike across organisation
Then when sponsors propose new initiatives, the portfolio team can say: “We can launch this in January when capacity exists. If you push for launch in March, it collides with reporting season and year-end planning—adoption will suffer.” This creates intelligent trade-offs rather than first-come-first-served initiative approval.
Blackout periods (established annually): Organisations might define:
June-July: No major new change initiation (planning cycles)
Week 1-2 January: No training or go-lives (people returning from holidays)
Week 1 December: No launches (focus shifting to year-end)
These aren’t arbitrary. They reflect when the organisation’s capacity for absorbing change genuinely exists or doesn’t.
4. Change portfolio tools that enable this infrastructure
Spreadsheets and email can’t manage enterprise change orchestration at scale. You need tools that:
The Change Compass and similar platforms provide:
Automated analytics generation: Each initiative updates its impacted roles. The tool instantly shows cumulative load by role.
Saturation alerts: When a population hits red saturation, alerts trigger for governance review.
Portfolio dashboard: Executives see at a glance which initiatives are proceeding, their status, and cumulative impact.
Readiness pulse integration: Monthly surveys track training completion, system adoption, and readiness across all initiatives simultaneously.
Adoption tracking: Post-launch data shows whether people are actually using new processes or finding workarounds.
Reporting and analytics: Portfolio leads can identify patterns (e.g., adoption rates are lower when initiatives launch with less than 2 weeks between training completion and go-live).
Tools like this aren’t luxury add-ons. They’re infrastructure. Without them, enterprise governance becomes opinionated conversations and unreliable. With them, you have actionable data. The value is usually at least in the millions annually in business value.
Bringing this together: Implementation roadmap
Month 1: Establish visibility
List all current and planned initiatives (next 12 months)
Create role type-level impact matrix
Generate first saturation heatmap
Brief executive team on portfolio composition
Month 2: Establish governance
Launch biweekly Change Coordination Council
Define enterprise change governance charter
Establish blackout periods for coming 12 months
Train initiative leads on portfolio reporting requirements
Month 3-4: Design consolidated change experience
Coordinate messaging across initiatives
Consolidate training calendar
Create shared readiness framework
Launch portfolio-level adoption dashboard
Month 5+: Operate at portfolio level
Biweekly governance meetings with real decisions about pace and sequencing
Monthly heatmap review and saturation management
Quarterly adoption analysis and course correction
Initiative leads report against portfolio metrics, not just project metrics
The evidence for this approach
Organisations implementing portfolio-level change management see material differences:
6.5x higher initiative success rates through iterative, feedback-driven course correction
Retention improvement: Organisations with low saturation see voluntary turnover 31 percentage points lower than high-saturation peer companies
These aren’t marginal gains. This is the difference between transformation that transforms and change that creates fatigue.
The research is clear: iterative approaches with continuous feedback loops and portfolio-level coordination outperform traditional programme management. Agile delivery frameworks have solved technical orchestration. Portfolio management solves human orchestration. Together, they create rapid transformation without burnout.
PI Planning coordinates technical features and dependencies. It doesn’t track people impact, readiness, or saturation across initiatives. Those require separate data collection and governance layers specific to change.
How is portfolio change management different from standard programme management?
Traditional programmes manage one large initiative. Change portfolio management coordinates impacts across multiple concurrent initiatives, making visible the aggregate burden on people and organisation.
Don’t agile teams already coordinate through standups and retrospectives?
Team-level coordination happens within an ART (agile release train). Enterprise coordination requires governance above team level, visible saturation metrics, and explicit trade-off decisions about which initiatives proceed and when. Without this, local optimisation creates global problems.
What size organisation needs portfolio change management?
Any organisation running 3+ concurrent initiatives needs some form of portfolio coordination. A 50-person firm might use a spreadsheet. A 500-person firm needs structured tools and governance.
How do we get Agile Release Train leads to participate in enterprise change governance?
Show the saturation data. When ART leads see that their initiative is stacking 4 changes onto a customer service team already managing 3 others, the case for coordination becomes obvious. Make governance meetings count—actual decisions, not information sharing.
Does portfolio management slow down agile delivery?
It resequences delivery rather than slowing it. Instead of five initiatives launching in week 5 (creating saturation), portfolio management might sequence them across weeks 3, 5, 7, 9, 11. Total delivery time is similar; adoption rates and employee experience improve dramatically.
What metrics should a portfolio dashboard show?
Change unit allocation per role (saturation heatmap)
Training completion rates across initiatives
Adoption rates post-launch
Employee change fatigue scores (pulse survey)
Initiative status and timeline
Readiness progression
How often should portfolio governance meet?
Monthly is standard. This allows timely response to emerging saturation without creating meeting overhead. Real governance means decisions get made—sequencing changes, reallocating resources, adjusting timelines.
Change management has long operated on assumptions. Traditional linear models as a part of a change management process were built on the premise that if you follow the steps correctly, organisational transformation will succeed. But in recent years, large-scale empirical research has provided something far more valuable than theory: hard evidence that challenges this assumption.
The data is unambiguous. Organisations using iterative, feedback-driven change approaches achieve dramatically higher success rates than those using linear, static methodologies. This isn’t a matter of opinion or preference. It’s quantifiable. And when measuring change management effectiveness and success metrics, the difference is transformational.
The Scale of the Difference: What the Numbers Actually Show
When the Standish Group analysed thousands of project outcomes across 2013-2020, they found something remarkable about change management success. Organisations using Agile (iterative) methodologies succeeded at a 42% rate, compared to just 13% for Waterfall (linear) approaches. That’s not a marginal improvement. That’s a 3.2-fold increase in success likelihood—a critical finding for anyone measuring change management success.
The implications are staggering for change management performance metrics. Failed projects? Agile projects fail at 11%. Linear projects fail at 59% – more than five times higher. These aren’t theoretical predictions. These are outcomes from thousands of real projects across multiple industries and organisational types.
Independent research from Ambysoft’s 2013 Project Success Rates Survey confirmed this change management effectiveness pattern. Agile methodologies achieved a 64% success rate versus 49% for Waterfall – a consistent 15-percentage-point advantage when measuring change management results.
When you aggregate data at this scale, random noise and one-off circumstances wash out. What remains is signal. And the signal is clear: iterative change management approaches beat linear ones by a substantial margin. For organisations seeking to improve change management success metrics, this empirical evidence on change management effectiveness is definitive.
The Serrador & Pinto Landmark Study: Quantifying Why Iterative, Agile Change Management Works
The most comprehensive empirical analysis of change management effectiveness comes from a 2015 study by Pedro Serrador and Jeffrey Pinto, published in the International Journal of Project Management. This research examined 1,002 projects across multiple industries and countries – representing one of the largest field studies directly comparing linear and iterative change management methodologies.
The study measured change success on two dimensions that matter for change management success metrics: efficiency (meeting cost, time, and scope targets) and stakeholder satisfaction (meeting broader organisational goals).
The findings were unequivocal. Agile change management approaches showed statistically significant positive impact on both efficiency and stakeholder satisfaction. But the really important finding came from examining the relationship between degree of Agile implementation and success. There was a positive correlation: the more an organisation embraced iterative change practices, the higher the change success rate.
This is crucial because it means the difference isn’t philosophical – it’s not that iterative practitioners are simply more conscientious. The degree of iteration itself drives change management success. More iteration correlates with better outcomes. For those developing a change management strategy template or measuring change management effectiveness, this empirical relationship is essential.
One nuance from the study deserves particular attention: the research found no significant difference in upfront planning effort between Agile and linear approaches. Both require planning. The critical distinction lies in what happens next. In linear change management processes, planning is front-loaded, then execution follows. In iterative change management approaches, planning continues throughout. Planning isn’t abandoned; it’s distributed. This finding is key for understanding how to design change management processes that optimise both planning and adaptability.
Speed to Delivery: The Change Management Efficiency Multiplier
Empirical research on change management effectiveness consistently demonstrates that iterative change approaches don’t just produce better outcomes – they produce them faster. For organisations measuring change management effectiveness and tracking change management KPIs, this metric is critical.
Meta-analysis of 25 peer-reviewed studies examining change management performance metrics found that iterative projects complete 28% faster than linear projects on average. Companies adopting iterative change initiatives reported a 25% reduction in time-to-market when implementing change management best practices.
This speed advantage compounds. In linear change management processes, scope changes accumulate throughout execution, then pile up at the end when they’re most expensive to address. In iterative change approaches, changes are incorporated continuously, preventing the backlog that creates schedule pressure and derails change management success.
PwC’s 2017 research on change management effectiveness found that iterative projects are 28% more successful than traditional linear approaches. But equally important: they reach viable solutions faster, meaning organisations realize benefits sooner. This directly impacts how to measure change management success and what change management analytics should track.
The Organisational Change Capability Study: Measuring Adaptive Capacity and Change Management Success
More recent empirical research by Vanhengel et al. (2025) developed and validated a measurement scale for organisational change capability across 15 components measuring change processes and content. This research examined multiple organisations implementing change management initiatives and change management best practices.
The key finding for change management success metrics: organisations with higher change capability which is characterized by multidimensional adaptability rather than rigid sequential approaches – achieved significantly higher success rates in change implementation (p < 0.05 across all components). This is critical data for how to measure change management effectiveness.
What constituted “higher change capability” in these organisations using iterative change management approaches? The research identified dimensions including stakeholder engagement, resource allocation, monitoring and feedback mechanisms, and adaptive decision-making. These are iterative, not linear, characteristics. For organisations seeking to design change management processes or develop a change management strategy template, these dimensions should be prioritized.
In other words, empirical measurement of what actually characterizes successful organisational change revealed iterative features as dominant success factors in managing change successfully.
Perhaps the single most actionable empirical finding concerning change management effectiveness concerns feedback loops. McKinsey & Company research (2020) revealed that organisations with robust feedback loops were 6.5 times more likely to experience effective change compared to those without.
That’s a staggering multiple. Not percentage-point improvements. A 6.5-fold increase in likelihood of change management success. For measuring change management effectiveness, this metric is transformational.
The mechanisms are worth examining. In a healthcare case study featured in McKinsey research on change management approaches, involving frontline staff in revising procedures through iterative feedback loops resulted in a 40% improvement in patient satisfaction scores. This wasn’t achieved through better planning before implementation. It was achieved through continuous change monitoring and feedback during implementation.
A tech startup’s case study on implementing change management best practices showed that implementing regular feedback loops and change management initiatives resulted in:
40% increase in employee engagement following implementation of monthly check-ins and anonymous suggestion boxes
Dramatically improved change adoption as teams rallied around collective goals informed by their input
Adecco’s experience with change management success demonstrated that responding to employee feedback through focus groups and integration into change management plan rollout generated a 30% increase in employee engagement and smoother transitions. These findings are central to understanding how to measure change management success.
These aren’t marginal improvements. These are transformational multipliers. And they emerge specifically from continuous feedback mechanisms, which are inherently iterative rather than linear. This is why change monitoring and change management analytics are critical to change management success metrics.
Agile Change Management Work Practices: Empirical Impact on Implementation Success
Rietze et al. (2022) empirically examined agile work practices including iterative planning, incremental delivery, and self-organized teamwork in change management contexts. The research provided specific evidence on how these iterative change management techniques improve outcomes and change management effectiveness:
Iterative planning and short work cycles (1-5 weeks) enable teams to integrate feedback constantly rather than discovering misalignment after extended delivery cycles. This is central to modern change management process design. The empirical implication: problems are caught early when they’re inexpensive to fix, rather than late when they require extensive rework. This directly impacts change management KPIs and how to measure change management success.
Incremental delivery allows experimentation and prototype refinement throughout iterations, reducing late-stage rework. This isn’t just theoretical efficiency in change management approaches. It’s measurable reduction in project churn and missed change management success metrics.
Self-organized teamwork and regular retrospectives enhance team perception of control, increasing perceived efficacy and reducing resistance. This is particularly significant in organisational change contexts, where people often experience change as something done to them. Iterative change management approaches with retrospectives create a sense of agency and participation, key factors in change management success.
Quantitative feedback mechanisms (adoption tracking dashboards, change management KPI scorecards) and demonstration meetings provide visibility of achieved performance at regular intervals, supporting continuous improvement. Critically, this constant change monitoring prevents the false confidence that plagues linear approaches—the situation where everything appears on-track until suddenly it isn’t. This is why change management analytics and change management metrics dashboards are essential for measuring change management results.
The MIT Finding: Efficiency and Adaptability Are Complements, Not Substitutes in Change Management
One of the more surprising empirical discoveries regarding change management effectiveness comes from MIT research on continuous change management processes. The study found that efficiency and adaptability are complements, not substitutes – meaning iterative change management approaches don’t sacrifice efficiency for flexibility. They achieve both simultaneously.
The quantitative finding for change management success metrics: organisations implementing continuous change with frequent measurement and monitoring actually achieved a twenty-fold reduction in manufacturing cycle time while simultaneously maintaining adaptive capacity. This finding is revolutionary for change management approaches and change management best practices.
This directly contradicts the assumption embedded in many linear change management frameworks: that you can be efficient or flexible, but not both. The empirical evidence suggests this is false. When you measure change continuously and adjust iteratively through effective change management processes, you can optimize for both efficiency and adaptability. This is transformational for anyone developing a change management strategy or designing change management methodology.
Implementation Science: The Barriers Discovery Problem in Change Management
A systematic review of implementation outcome measures (Mettert et al., 2020) identified a critical gap in how organisations measure change management effectiveness. Only four of 102 implementation outcome measures had been tested for responsiveness or sensitivity to change over time.
This represents an empirical problem for organisations measuring change management success and change management metrics. Most organisations lack validated instruments to detect whether change implementation efforts are actually working. They measure at the end, not continuously – a significant blind spot in change management analytics.
Iterative change approaches inherently solve this problem through continuous monitoring and change management KPIs. You’re not waiting until go-live to discover barriers. You’re identifying them mid-iteration when they’re addressable. This is why change monitoring and continuous change management assessment are essential to change management objectives.
The Continuous Feedback Multiplier: Large-Scale Evidence on Change Management Effectiveness
Beyond individual studies, the empirical pattern across 25+ peer-reviewed studies examining continuous feedback mechanisms and change management performance metrics is consistent: organisations that institutionalize rapid feedback loops experience 30-40% improvements in adoption rates compared to those with annual or quarterly measurement cycles. This is a critical finding for measuring change management success.
The mechanism is straightforward. In linear change management processes, you discover problems through retrospective analysis. You’ve already missed six months of opportunity to address them. In iterative change management approaches, you discover problems within weeks through continuous change monitoring.
That speed differential compounds across a full change implementation. Each barrier identified early through change management analytics prevents cascading failures downstream. This is why change management metrics dashboards and change management analytics are becoming essential to change management success.
What Empirical Research Reveals About Readiness for Change Model Assessment Failure
Remember the core problem with linear change management approaches: readiness assessments capture a moment in time, not a prediction of future readiness. Empirical research on change readiness models validates this concern and challenges traditional change management process design.
Organisational readiness is dynamic. External factors shift. Market conditions change. Competing priorities emerge. Other organisational change initiatives consume capacity. Leadership changes disrupt continuity. A readiness assessment conducted in Q1 becomes obsolete by Q3. Understanding this is central to developing effective change management strategy template and change management approach.
The empirical solution: continuous reassessment and continuous change monitoring. Organisations that track readiness throughout implementation using iterative cycles and continuous measurement show adoption rates 25-35% higher than those conducting single-point readiness assessments. This finding is transformative for organisations seeking to improve change management success metrics.
This isn’t because continuous reassessment uncovers problems. It’s because continuous change monitoring and iterative change management approaches enable early intervention when problems emerge, preventing them from cascading into adoption failure. For those managing change and seeking to measure change management effectiveness, this continuous approach is essential.
Why Linear Change Models Fail Empirically: Understanding Change Management Challenges
When you examine the empirical research across multiple dimensions, several patterns emerge about why linear change management models struggle – patterns critical for anyone learning about change management or seeking to implement change management best practices.
Static assumptions become invalid. Readiness assessed upfront changes. Capability grows or stalls. Resistance emerges or dissipates. Environment shifts. Linear change management frameworks treat these as either plan failures or execution failures, rather than recognizing them as expected aspects of complex systems. Understanding change management challenges requires this flexibility.
Barriers aren’t discovered until they’re expensive to fix. Linear approaches discover change management implementation barriers during implementation phases, when significant resources have already been committed. Iterative change management approaches discover them in earlier cycles, when adjustment is less costly. This difference is fundamental to how to measure change management success and design effective change management processes.
Feedback isn’t incorporated. Without regular feedback loops and continuous change monitoring, organisations continue executing change plans even when early data suggests misalignment. Empirically, this continuation despite misalignment is a primary driver of change management failure. This is why change management analytics and change management KPIs are so critical to change management objectives.
Problems compound unchecked. In linear change management processes, adoption problems in Phase 1 are addressed only after complete rollout. By then, they’ve cascaded, creating multiple interconnected barriers. Iterative change management approaches address problems in real-time before they compound. This directly impacts how to measure change management success.
Learning isn’t transferred. What works brilliantly in one geography or business unit fails in another. Linear change management frameworks often treat each phase as independent. Iterative change management approaches explicitly transfer learning between phases and segments through continuous change monitoring and change management analytics.
Integrating the Evidence: A Coherent Picture of Change Management Success
Across large-scale quantitative studies (Serrador & Pinto’s 1,002 projects on change management effectiveness), longitudinal surveys (Standish Group’s 15-year analysis of change management success metrics), systematic reviews (25+ studies on change management performance), and focused empirical research (Vanhengel, Rietze, McKinsey on measuring change management effectiveness), a coherent picture emerges about what drives change management success.
3-5x higher success rates than linear approaches in change management success metrics
25-28% faster time-to-delivery when implementing change management best practices
6.5x higher likelihood of effective change when feedback mechanisms are robust
40% improvement in engagement and adoption when continuous feedback is embedded
20x improvements in both efficiency and adaptability when done well through iterative change management processes
These aren’t marginal improvements in change management effectiveness. They’re transformational multipliers. And they’re consistent across industry, organization size, and geography. Understanding these multipliers is essential for anyone seeking to measure change management success and develop effective change management strategy.
The empirical evidence isn’t suggesting you abandon structured change management. The data shows structured approaches improve outcomes. But the specific structure that works – the change management approach that delivers results is iterative, not linear. It’s feedback-driven, not predetermined. It treats organisational change as an adaptive system that reveals itself through iteration, not a project that follows a predetermined plan.
What This Means for Change Leadership and Practitioners
The empirical findings create an imperative for change leaders and organisations pursuing change management initiatives. The evidence is sufficiently robust that continuing to use linear change management processes despite empirical evidence of inferior outcomes becomes difficult to defend, particularly when measuring change management success is critical to organisational strategy.
But moving to iterative, agile change management approaches and continuous change monitoring creates different challenges. Organisations need:
Continuous measurement capability and infrastructure for change management analytics
Comfort with planning that extends throughout implementation – a key change management principle
Willingness to adjust approaches based on emerging data and change monitoring insights
Organisational readiness to move at the required pace of iterative change management
Governance and leadership comfort with adaptive decision-making in change management strategy
Change management KPI dashboards and metrics to track change management performance
These aren’t trivial requirements. Many organisations will struggle with the shift from traditional change management frameworks to iterative approaches. But the empirical evidence is clear: the investment in this shift to modern change management best practices is repaid through dramatically improved change management success metrics and organisational outcomes.
The Future: Data at Scale and Advanced Change Management Analytics
The empirical findings discussed here are based on measurement at current scale. As organisations invest in digital platforms and AI-powered analytics for change management initiatives, the measurement fidelity will improve. Patterns invisible at current scale will become visible. Predictions of adoption risk and change management success will improve through advanced change management analytics.
But the fundamental finding won’t change. Iterative change management approaches with continuous measurement and feedback outperform linear approaches in achieving change management success. The data has already spoken. The empirical evidence on change management effectiveness is clear.
The only question is whether organisations will listen.
FAQ: Empirical Research on Iterative, Agile vs. Linear Change Management
What is the main empirical finding comparing iterative and linear change management approaches?
Large-scale empirical research, including analysis of over 1,000 projects by Serrador & Pinto (2015), demonstrates that iterative change management approaches achieve 3-5x higher success rates than linear approaches. Organisations using iterative methodologies succeed at rates of 42-64%, compared to just 13-49% for linear methods.
How much faster do iterative change management processes deliver results?
Meta-analysis of 25 peer-reviewed studies shows that iterative change approaches deliver 25-28% faster time-to-market than linear change management processes. This speed advantage compounds because iterative approaches address barriers and incorporate feedback continuously, rather than discovering problems after full rollout.
What is the impact of feedback loops on change management success?
Empirical research from McKinsey & Company found that organisations with robust feedback loops are 6.5 times more likely to experience effective change than those without. Case studies show 40% improvements in adoption metrics when continuous feedback mechanisms are embedded in change management processes.
Do organisations need different planning approaches for iterative vs. linear change management?
The Serrador & Pinto study found no significant difference in upfront planning effort between iterative and linear approaches. The critical difference is that iterative change management distributes planning throughout implementation rather than front-loading it. Both approaches require planning; they differ in when and how.
How does organisational readiness change during implementation?
Empirical research demonstrates that organisational readiness is dynamic, not static. External factors, competing priorities, and personnel changes alter readiness throughout implementation. Organisations using continuous measurement and reassessment achieve 25-35% higher adoption rates than those conducting single-point readiness assessments.
How does MIT’s research on efficiency vs. adaptability challenge traditional change management thinking?
MIT research found that efficiency and adaptability are complements, not substitutes. Organisations implementing continuous change with frequent measurement achieved 20x reductions in cycle time while maintaining adaptive capacity—contradicting the assumption that efficiency requires sacrificing flexibility in change management approaches.
What are change management KPIs and performance metrics I should track?
Critical change management metrics include adoption rates (by phase and segment), time-to-readiness, resistance indicators, feedback response time, implementation fidelity, and benefit realization. Importantly, these should be measured continuously throughout change initiatives, not just at completion. Change management analytics dashboards enable real-time tracking of these change management success metrics.
How do iterative change management approaches handle barriers and resistance?
Iterative approaches identify barriers through continuous change monitoring rather than discovering them after rollout. This enables early intervention when problems are less costly to address. Case studies show that continuous feedback integration achieves 40% higher engagement and smoother adoption compared to linear approaches.
What is organisational change capability, and why does it predict change management success?
Organisational change capability encompasses stakeholder engagement, resource allocation, feedback mechanisms, and adaptive decision-making across 15 measured dimensions. Empirical research found significant positive correlation (p < 0.05) between change capability and change implementation success, suggesting that adaptability and iteration—not rigid adherence to plans—drive organisational change outcomes.
Why do some organisations fail despite following a structured change management framework?
Empirical research shows that simply following a change management methodology (whether Kotter’s 8-step model or another framework) doesn’t guarantee success. How the methodology is used matters more than which methodology is chosen. Organisations that treat frameworks as fixed scripts fail more often than those that adapt frameworks based on emerging data and feedback.
How should organisations transition from linear to iterative change management approaches?
Transitioning requires building continuous measurement infrastructure, extending planning throughout implementation rather than front-loading it, developing comfort with adaptive decision-making, and creating governance structures that support iteration. Organisations also need change management analytics capabilities and regular feedback mechanisms to move from static, linear change management to adaptive, iterative approaches.
References: Peer-Reviewed Academic Research
Mettert, K. D., Saldana, L., Sarmiento, K., Gbettor, Y., Hamiltton, M., Perrow, P., & Stamatakis, K. A. (2020). Measuring implementation outcomes: An updated systematic review. Implementation Science, 15(1), 55.
Rietze, P., Häusle, R., Szymczak, S., & Möhrle, M. G. (2022). Relationships between agile work practices and work outcomes: A systematic review. International Journal of Project Management, 40(1), 1-15.
Serrador, P., & Pinto, J. K. (2015). Does Agile work?—A quantitative analysis of agile project success. International Journal of Project Management, 33(5), 1040-1051.
Vanhengel, R., De Vos, A., Meert, N., & Verhoeven, J. C. (2025). The organizational change capability of public organizations: Development and validation of an instrument. Journal of Organizational Change Management, 38(2), 245-267.
Large-Scale Research and Surveys
Errida, A., & Lotfi, B. (2021). The determinants of organizational change management success. International Journal of Organizational Leadership, 10(1), 37-56.
Serrador, P., Noonan, K., Pinto, J. K., & Brown, M. (2015). A quantitative analysis of agile project success rates and their impact. Project Management Institute, Research Report.
McKinsey & Company. (2020). Building the organization of the future: Organizing feedback loops for faster learning and change. McKinsey & Company.
PwC. (2017). The agile advantage: How organizations are building a competitive advantage through more agile and responsive operations.
Implementation Science References
Mettert, K. D., Saldana, L., Stamatakis, K. A., et al. (2020). Measuring implementation outcomes: An updated systematic review. Implementation Science, 15(1), 55.
Noonan, K., & Serrador, P. (2014). The agile shift: A Comparative study of incremental and waterfall approaches to project delivery. IEEE Software, 31(4), 21-28.
Complex Adaptive Systems and Organisational Change
Vanhengel et al. (2025). Organizational change capability development: Implications for change management practice. Organization Development Journal, 43(1), 22-39.
Healthcare and Case Study Evidence
Harvard Business Review. (2020). The agile approach to change management in healthcare. Harvard Business Review, 98(5), 76-84.
MIT Sloan Management Review. (2019). Continuous change management: Lessons from manufacturing excellence. MIT Sloan Management Review, 60(3), 44-52.