A change management process is the structured sequence of activities an organisation follows to take a change from concept through to embedded business-as-usual practice. It typically covers seven distinct stages: define the change and intended outcomes, assess impact across stakeholder groups, build the change strategy and plan, prepare leaders and sponsors, execute and engage the workforce, measure adoption and operational outcomes, and embed the change so it becomes the default way of working. The modern version of this process is iterative rather than linear, and uses real-time data to adapt rather than a single launch plan that survives unchanged from kickoff to go-live.
A change management process is the structured sequence of activities that moves an organisation from its current state to an intended future state – while ensuring people have the awareness, capability, and motivation to work in the new way. This guide covers the seven core phases that research and field practice consistently show deliver the highest adoption rates, and explains why the order and interaction of these phases matters as much as the phases themselves.
The traditional image of change management involves a straightforward sequence: assess readiness, develop a communication plan, deliver training, monitor adoption, and declare success. Clean, predictable, linear. But this image bears almost no resemblance to how transformation actually works in complex organisations.
Real change is messy. It’s iterative, often surprising, and rarely follows a predetermined path. What works brilliantly in one business unit might fail spectacularly in another. Changes compound and interact with each other. Organisational capacity isn’t infinite. Leadership commitment wavers. Market conditions shift. And somewhere in the middle of all this, practitioners are expected to deliver transformation that sticks.
The modern change management process isn’t a fixed sequence of steps. It’s an adaptive framework that responds to data, adjusts to organisational reality, and treats change as a living system rather than a project plan to execute.
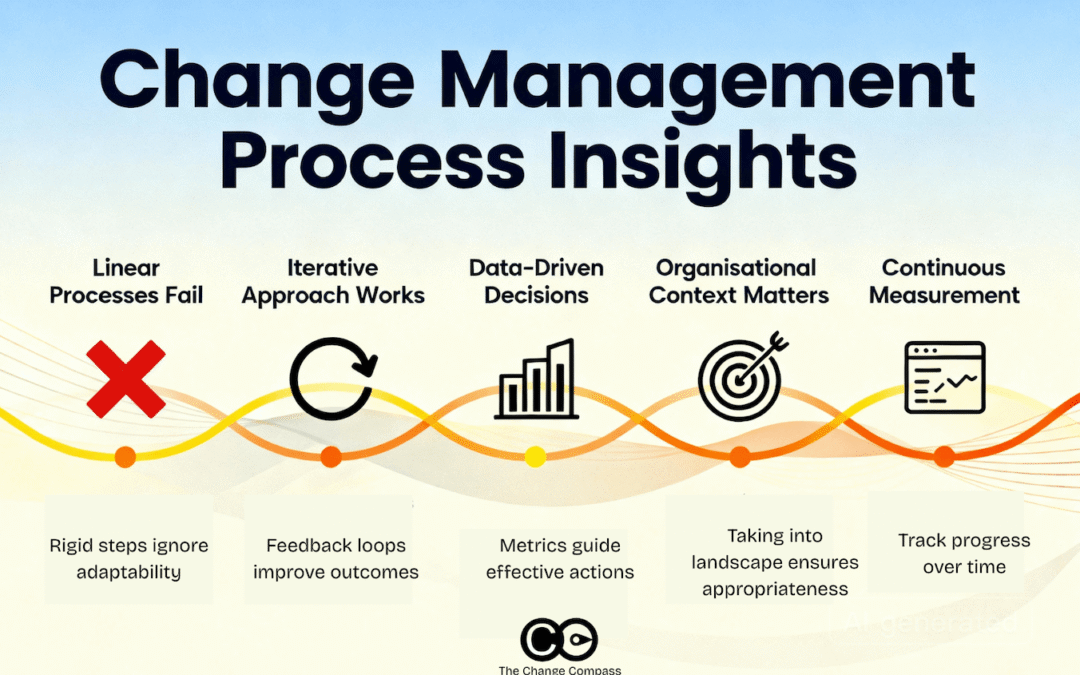
Why Linear Processes Fail
Traditional change models assume that if you follow the steps correctly, transformation will succeed. But this assumption misses something fundamental about how organisations actually work.
The core problems with linear change management approaches:
Readiness isn’t static. An assessment conducted three months before go-live captures a moment in time, not a prediction of future readiness. Organisations that are ready today might not be ready when implementation arrives, especially if other changes have occurred, budget pressures have intensified, or key leaders have departed.
Impact isn’t uniform. The same change affects different parts of the organisation differently. Finance functions often adopt new processes faster than frontline operations. Risk-averse cultures resist more than learning-oriented ones. Users with technical comfort embrace systems more readily than non-technical staff.
Problems emerge during implementation. Linear models assume that discovering problems is the job of assessment phases. But the most important insights often emerge during implementation, when reality collides with assumptions. When adoption stalls in unexpected places or proceeds faster than projected, that’s not a failure of planning – that’s valuable data signalling what actually drives adoption in your specific context.
Multi-change reality is ignored. Traditional change management processes often ignore a critical reality: organisations don’t exist in a vacuum. They’re managing multiple concurrent changes, each competing for attention, resources, and cognitive capacity. A single change initiative that ignores this broader change landscape is designing for failure.
The Evolution: From Rigid Steps to Iterative Process
Modern change management processes embrace iteration. This agile change management approach plans, implements, measures, learns, and adjusts. Then it cycles again, incorporating what’s been learned.
The Iterative Change Cycle
Plan: Set clear goals and success criteria for the next phase
What do we want to achieve?
How will we know if it’s working?
What are we uncertain about?
Design: Develop specific interventions based on current data
How will we communicate?
What training will we provide?
Which segments need differentiated approaches?
What support structures do we need?
Implement: Execute interventions with a specific cohort, function, or geography
Gather feedback continuously, not just at the end
Monitor adoption patterns as they emerge
Track both expected and unexpected outcomes
Measure: Collect data on what’s actually happening
Are people adopting? Are they adopting correctly?
Where are barriers emerging?
Where is adoption stronger than expected?
What change management metrics reveal the true picture?
Learn and Adjust: Analyse what the data reveals
Refine approach for the next iteration based on actual findings
Challenge initial assumptions with evidence
Apply lessons to improve subsequent rollout phases
This iterative cycle isn’t a sign that the original plan was wrong. It’s recognition that complex change reveals itself through iteration. The first iteration builds foundational understanding. Each subsequent iteration deepens insight and refines the change management approach.
The Organisational Context Matters
Here’s what many change practitioners overlook: the same change management methodology works differently depending on the organisation it’s being implemented in.
Change Maturity Shapes Process Design
High maturity organisations:
Move quickly through iterative cycles
Make decisions rapidly based on data
Sustain engagement with minimal structure
Have muscle memory and infrastructure for iterative change
Leverage existing change management best practices
Low maturity organisations:
Need more structured guidance and explicit governance
Require more time between iterations to consolidate learning
Benefit from clearer milestones and checkpoints
Need more deliberate stakeholder engagement
Require foundational change management skills development
The first step of any change management process is honest assessment of organisational change maturity. Can this organisation move at pace, or does it need a more gradual approach? Does change leadership have experience, or do they need explicit guidance? Is there existing change governance infrastructure, or do we need to build it?
These answers shape the design of your change management process. They determine:
Pace of implementation
Frequency of iterations
Depth of stakeholder engagement required
Level of central coordination needed
Support structures and resources
The Impact-Centric Perspective
Every change affects real people. Yet many change management processes treat people as abstract categories: “users,” “stakeholders,” “early adopters.” Real change management considers the lived experience of the person trying to adopt new ways of working.
From the Impacted Person’s Perspective
Change saturation: What else is happening simultaneously? Is this the only change or one of many? If multiple change initiatives are converging, are there cumulative impacts on adoption capacity? Can timing be adjusted to reduce simultaneous load? Recognising the need for change capacity assessment prevents saturation that kills adoption.
Historical context: Has this person experienced successful change or unsuccessful change previously? Do they trust that change will actually happen or are they sceptical based on past experience? Historical success builds confidence; historical failure builds resistance. Understanding this history shapes engagement strategy.
Individual capacity: Do they have the time, emotional energy, and cognitive capacity to engage with this change given everything else they’re managing? Change practitioners often assume capacity that doesn’t actually exist. Realistic capacity assessment determines what’s actually achievable.
Personal impact: How does this change specifically affect this person’s role, status, daily work, and success metrics? Benefits aren’t universal. For some people, change creates opportunity. For others, it creates threat. Understanding this individual reality shapes what engagement and support each person needs.
Interdependencies: How does this person’s change adoption depend on others adopting first? If the finance team needs to be ready before sales can go-live, sequencing matters. If adoption in one location enables adoption in another, geography shapes timing.
When you map change from an impacted person’s perspective rather than a project perspective, you design very different interventions. You might stagger rollout to reduce simultaneous load. You might emphasise positive historical examples if trust is low. You might provide dedicated support to individuals carrying disproportionate change load.
Data-Informed Design and Continuous Adjustment
This is where modern change management differs most sharply from traditional approaches: nothing is assumed. Everything is measured. Implementing change management without data is like navigating without instruments.
Before the Process Begins: Baseline Data Collection
Current state of readiness
Knowledge and capability gaps
Cultural orientation toward this specific change
Locations of excitement versus resistance
Adoption history in this organisation
Change management performance metrics from past initiatives
During Implementation: Continuous Change Monitoring
As the change management process unfolds, data collection continues:
Awareness tracking: Are people aware of the change?
Understanding measurement: Do they understand why it’s needed?
Engagement monitoring: Are they completing training?
Application assessment: Are they applying what they’ve learned?
Barrier identification: Where are adoption barriers emerging?
Success pattern analysis: What’s driving adoption in places where it’s working?
This data then becomes the basis for iteration. If readiness assessment showed low awareness but commitment to change didn’t emerge from initial communication, you’re not just communicating more. You’re investigating why the message isn’t landing. The reason shapes the solution.
How to Measure Change Management Success
If adoption is strong in Finance but weak in Operations, you don’t just provide more training to Operations. You investigate why Finance is succeeding:
Is it their culture?
Their leadership?
Their process design?
Their support structure?
Understanding this difference helps you replicate success in Operations rather than just trying harder with a one-size-fits-all approach.
Data-informed change means starting with hypotheses but letting reality determine strategy. It means being willing to abandon approaches that aren’t working and trying something different. It means recognising that what worked for one change won’t necessarily work for the next one, even in the same organisation.
The 7-Step Change Management Process
While modern change management processes are iterative rather than strictly linear, they still progress through recognisable phases. Understanding these phases and how they interact prevents getting lost in iteration.
Step 1: Pre-Change Planning
Before formal change begins, build foundations:
Assess organisational readiness and change maturity
Map current change landscape and change saturation levels
Identify governance structures and leadership commitment
Conduct impact assessment across all affected areas
Understand who’s affected and how
Baseline current state across adoption readiness, capability, culture, and sentiment
This phase establishes what you’re working with and shapes the pace and approach for everything that follows.
Step 2: Readiness Assessment
Help people understand what’s changing and why it matters. This isn’t one communication – it’s repeated, multi-channel, multi-format messaging that reaches people where they are.
Different stakeholders need different messages:
Finance needs to understand financial impact
Operations needs to understand process implications
Frontline staff need to understand how their day-to-day work changes
Leadership needs to understand strategic rationale
Done well, this phase moves people from unawareness to understanding and from indifference to some level of commitment.
Step 3: Capability Building
Equip people with what they need to succeed:
Formal training programmes
Documentation and job aids
Peer support and buddy systems
Dedicated help desk support
Access to subject matter experts
Practice environments and sandboxes
This phase recognises that people need different things: some need formal training, some learn by doing, some need one-on-one coaching. The process design accommodates this variation rather than enforcing uniformity.
Step 4: Implementation
This is where iteration becomes critical:
Launch the change, typically with an initial cohort or geography
Measure what’s actually happening through change management tracking
Identify where adoption is strong and where it’s struggling
Surface barriers and success drivers
Iterate and refine approach for the next rollout based on learnings
Repeat with subsequent cohorts or geographies
Each cycle improves adoption rates and reduces barriers based on evidence from previous phases.
Step 5: Embedment and Optimisation
After initial adoption, the work isn’t done:
Embed new ways of working into business as usual
Build capability for ongoing support
Continue measurement to ensure adoption sustains
Address reversion to old ways of working
Support staff turnover and onboarding
Optimise processes based on operational learning
Sustained change requires ongoing reinforcement, continued support, and regular adjustment as the organisation learns how to work most effectively with the new system or process.
Step 6: Integration With Organisational Strategy
The change management process doesn’t exist in isolation from organisational strategy and capability. It’s shaped by and integrated with several critical factors.
Leadership Capability
Do leaders understand change management principles? Can they articulate why change is needed? Will they model new behaviours? Are they present and visible during critical phases? Weak leadership capability requires:
More structured support
More centralised governance
More explicit role definition for leaders
Coaching and capability building for change leadership
Operational Capacity
Can the organisation actually absorb this change given current workload, staffing, and priorities? If not, what needs to give? Pretending capacity exists when it doesn’t is the fastest path to failed adoption. Realistic assessment of:
Current workload and priorities
Available resources and time
Competing demands
Realistic timeline expectations
Change Governance
How are multiple concurrent change initiatives being coordinated? Are they sequenced to reduce simultaneous load? Is someone preventing conflicting changes from occurring at the same time? Is there a portfolio view preventing change saturation?
Effective enterprise change management requires:
Portfolio view of all changes
Coordination across initiatives
Capacity and saturation monitoring
Prioritisation and sequencing decisions
Escalation pathways when conflicts emerge
Existing Change Infrastructure
Does the organisation already have change management tools and techniques, governance structures, and experienced practitioners? If so, the new process integrates with these. If not, do you have resources to build this capability as part of this change, or do you need to work within the absence of this infrastructure?
Culture and Values
What’s the culture willing to embrace? A highly risk-averse culture needs different change design than a learning-oriented culture. A hierarchical culture responds to authority differently than a collaborative culture. These aren’t barriers to overcome but realities to work with.
The Future: Digital and AI-Enabled Change Management
The future of change management processes lies in combining digital platforms with AI to dramatically expand scale, precision, and speed while maintaining human insight.
Current State vs. Future State
Current state:
Practitioners manually collect data through surveys, interviews, focus groups
Manual analysis takes weeks
Pattern identification limited by human capacity and intuition
Iteration based on what practitioners notice and stakeholders tell them
Future state:
Digital platforms instrument change, collecting data continuously across hundreds of engagement touchpoints
Adoption behaviours, performance metrics, sentiment indicators tracked in real-time
Machine learning identifies patterns humans might miss
AI surfaces adoption barriers in specific segments before they become critical
Algorithms predict adoption risk by analysing patterns in past changes
AI-Powered Change Management Analytics
AI-powered insights can:
Highlight which individuals or segments need support before adoption stalls
Identify which change management activities are working and where
Recommend where to focus effort for maximum impact
Correlate adoption patterns with dozens of organisational variables
Predict adoption risk and success likelihood
Generate automated change analysis and recommendations
But here’s the critical insight: AI generates recommendations, but humans make decisions. AI can tell you that adoption in Division X is 40% below projection and that users in this division score lower on confidence. AI can recommend increasing coaching support. But a human change leader, understanding business context, organisational politics, and strategic priorities, decides whether to follow that recommendation or adjust it based on factors the algorithm can’t see.
Human Expertise Plus Technology
The future of managing change isn’t humans replaced by AI. It’s humans augmented by AI:
Technology handling data collection and pattern recognition at scale
Humans providing strategic direction and contextual interpretation
AI generating insights; humans making nuanced decisions
This future requires change management processes that incorporate data infrastructure from the beginning. It requires:
Defining success metrics and change management KPIs upfront
Continuous measurement rather than point-in-time assessment
Treating change as an operational discipline with data infrastructure
Building change management analytics capabilities
Investing in platforms that enable measurement at scale
Designing Your Change Management Process
The change management framework that works for your organisation isn’t generic. It’s shaped by organisational maturity, leadership capability, change landscape, and strategic priorities.
Step 1: Assess Current State
What’s the organisation’s change maturity? What’s leadership experience with managing change? What governance exists? What’s the cultural orientation? What other change initiatives are underway? What’s capacity like? What’s historical success rate with change?
This assessment shapes everything downstream and determines whether you need a more structured or more adaptive approach.
Step 2: Define Success Metrics
Before you even start, define what success looks like:
What adoption rate is acceptable?
What performance improvements are required?
What capability needs to be built?
How will you measure change management effectiveness?
What change management success metrics will you track?
These metrics drive the entire change management process and enable you to measure change results throughout implementation.
Step 3: Map the Change Landscape
Who’s affected? In how many different ways? What are their specific needs and barriers? What’s their capacity? What other changes are they managing? This impact-centric change assessment shapes:
Sequencing and phasing decisions
Support structures and resource allocation
Communication strategies
Training approaches
Risk mitigation plans
Step 4: Design Iterative Approach
Don’t assume linear execution. Plan for iterative rollout:
How will you test learning in the first iteration?
How will you apply that learning in subsequent iterations?
What decisions will you make between iterations?
How will speed of iteration balance with consolidation of learning?
What change monitoring mechanisms will track progress?
Step 5: Build in Continuous Measurement
From day one, measure what’s actually happening:
Adoption patterns and proficiency levels
Adoption barriers and resistance points
Performance impact against baseline
Sentiment evolution throughout phases
Capability building and confidence
Change management performance metrics
Use this data to guide iteration and make evidence-informed decisions about measuring change management success.
Step 6: Integrate With Governance
How does this change process integrate with portfolio governance? How is this change initiative sequenced relative to others? How is load being managed? Is there coordination to prevent saturation? Is there an escalation process when adoption barriers emerge?
Effective change management requires integration with broader enterprise change management practices, not isolated project-level execution.
Change Management Best Practices for Process Design
As you design your change management process, several best practices consistently improve outcomes:
Start with clarity on fundamentals of change management:
Clear vision and business case
Visible and committed sponsorship
Adequate resources and realistic timelines
Honest assessment of starting conditions
Embrace iteration and learning:
Plan-do-measure-learn-adjust cycles
Willingness to challenge assumptions
Evidence-based decision making
Continuous improvement mindset
Maintain human focus:
Individual impact assessment
Capacity and saturation awareness
Support tailored to needs
Empathy for lived experience of change
Leverage data and technology:
Baseline and continuous measurement
Pattern identification and analysis
Predictive insights where possible
Human interpretation of findings
Integrate with organisational reality:
Respect cultural context
Work with leadership capability
Acknowledge capacity constraints
Coordinate with other changes
Process as Adaptive System
The modern change management process is fundamentally different from traditional linear models. It recognises that complex organisational change can’t be managed through predetermined steps. It requires data-informed iteration, contextual adaptation, and continuous learning.
It treats change not as a project to execute but as an adaptive system to manage. It honours organisational reality rather than fighting it. It measures continually and lets data guide direction. It remains iterative throughout, learning and adjusting rather than staying rigidly committed to original plans.
Most importantly, it recognises that change success depends on whether individual people actually change their behaviours, adopt new ways of working, and sustain these changes over time. Everything else – process, communication, training, systems, exists to support this human reality.
Organisations that embrace this approach to change management processes don’t achieve perfect transformations. But they achieve transformation that sticks, that builds organisational capability, and that positions them for the next wave of change. And in increasingly uncertain environments, that’s the only competitive advantage that matters.
Frequently Asked Questions:
What is the change management process?
The change management process is a structured approach to transitioning individuals, teams, and organisations from current state to desired future state. Modern change management processes are iterative rather than linear, using data and continuous measurement to guide adaptation throughout implementation. The process typically includes pre-change assessment, awareness building, capability development, implementation with reinforcement, and sustainability phases. Unlike traditional linear approaches, contemporary processes embrace agile change management principles, adjusting strategy based on real-time adoption data and organisational feedback.
What’s the difference between linear and iterative change management processes?
Linear change management follows predetermined steps: plan, communicate, train, implement, and measure success at the end. This approach assumes that following the change management methodology correctly guarantees success. Iterative change management processes use a plan-implement-measure-learn-adjust cycle, repeating with each phase or cohort. Iterative approaches work better with complex organisational change because they let reality inform strategy rather than forcing strategy regardless of emerging data. This agile change management approach enables change practitioners to identify adoption barriers early, replicate what’s working, and adjust interventions that aren’t delivering results.
How does organisational change maturity affect the change management process design?
Change maturity determines how quickly organisations can move through iterative cycles and how much structure they need. High-maturity organisations with established change management best practices, experienced change leadership, and strong governance can move rapidly and adjust decisively. They need less prescriptive guidance. Low-maturity organisations need more structured change management frameworks, more explicit governance, more support, and more time between iterations to consolidate learning. Your change management process should match your organisation’s starting point. Assessing change maturity before designing your process determines appropriate pace, structure, support requirements, and governance needs.
Why do you need continuous measurement throughout change implementation?
Continuous change monitoring and measurement reveals what’s actually driving adoption or resistance in your specific context, which is almost always different from planning assumptions. Change management tracking helps you identify adoption barriers early, discover what’s working and replicate it across other areas, adjust interventions that aren’t delivering results, and make evidence-informed decisions rather than guessing. Without ongoing measurement, you can’t answer critical questions about how to measure change management success, what change management performance metrics indicate problems, or whether your change initiatives are achieving intended outcomes. Measuring change management throughout implementation enables data-driven iteration that improves adoption rates with each cycle.
How does the change management process account for multiple concurrent changes?
The process recognises that people don’t exist in a single change initiative but experience multiple overlapping changes simultaneously. Effective enterprise change management maps the full change landscape, assesses cumulative impact and change saturation, considers sequencing to reduce simultaneous load, and builds support specifically for people managing multiple changes. Change governance at portfolio level coordinates across initiatives, prevents conflicting changes, monitors capacity, and makes prioritisation decisions. Single-change processes that ignore this broader context typically fail because they design for capacity that doesn’t actually exist and create saturation that prevents adoption.
What are the key phases in a modern change management process?
Modern change management processes progress through five key phases whilst remaining iterative: (1) Step 1: Pre-Change Planning includes readiness assessment, change maturity evaluation, change landscape mapping, and baseline measurement. (2) Step 2: Readiness Assessment builds understanding of what’s changing and why it matters through multi-channel communication. (3) Step 3: Capability Building equips people with training, documentation, support, and practice opportunities. (4) Implementation and Reinforcement Phase launches change iteratively, measures results, identifies patterns, and adjusts approach between rollout cycles. (5) Embedment Phase embeds new ways of working, builds ongoing support capability, and continues measurement to ensure adoption sustains. Each phase informs the next based on data and learning rather than rigid sequential execution.
How do you measure change management effectiveness?
Measuring change management effectiveness requires tracking multiple dimensions throughout the change process: (1) Adoption metrics measuring who’s using new processes or systems and how proficiently. (2) Change readiness indicators showing awareness, understanding, commitment, and capability levels. (3) Behavioural change tracking whether people are actually changing how they work, not just attending training. (4) Performance impact measuring operational results against baseline. (5) Sentiment and engagement indicators revealing confidence, trust, and satisfaction. (6) Sustainability metrics showing whether adoption persists over time or reverts. Change management success metrics should be defined before implementation begins and tracked continuously. Effective measurement combines quantitative data with qualitative insights to understand both what’s happening and why.
What role does AI and technology play in the future of change management processes?
AI and digital platforms are transforming change management processes by enabling measurement and analysis at unprecedented scale and speed. Future change management leverages technology for continuous data collection across hundreds of touchpoints, pattern recognition that surfaces insights humans might miss, predictive analytics identifying adoption risks before they become critical, and automated change analysis generating recommendations. However, technology augments rather than replaces human expertise. AI identifies patterns and generates recommendations; humans provide strategic direction, contextual interpretation, and nuanced decision-making. The most effective approach combines digital platforms handling data collection and change management analytics with experienced change practitioners applying business understanding and wisdom to translate insights into strategy.
Change management assessments are the structured diagnostic tools that surface the reality of how change is landing in an organisation, before, during and after delivery. The category covers three distinct assessment types: change impact assessments (what changes for whom), change readiness assessments (whether stakeholders are equipped to absorb the change) and change adoption assessments (whether the new ways of working are sticking after go-live). Used together they form the evidence base for sequencing, sponsorship and intervention decisions. Used in isolation, or as compliance ticks, they generate activity without insight. The difference lies in connecting assessment data to portfolio decisions.
Change management assessments are the foundation of successful transformation. Yet many change practitioners treat them like compliance boxes to tick rather than strategic tools that reveal the real story of whether change will stick. The difference between a thorough assessment and a surface-level one often determines whether a transformation delivers business impact or becomes another expensive learning experience.
The evolution of change management assessments reflects a shift in how mature organisations approach transformation. Beginners follow methodologies, use templates, and gather information in structured ways. That’s valuable starting ground. But experienced practitioners do something different. They look for patterns in the data, drill into unexpected findings, challenge surface-level conclusions, and adjust their approach continuously as new insights emerge. Most critically, they understand that assessments without data are just opinions, and opinions are rarely reliable guides for multi-million pound transformation decisions.
The future of change management assessments lies in combining digital and AI tools that can rapidly identify patterns and connections across massive datasets with human interpretation and contextual insight. Technology handles the heavy lifting of data collection and pattern recognition. Change practitioners apply experience, intuition, and business understanding to translate findings into meaningful strategy.
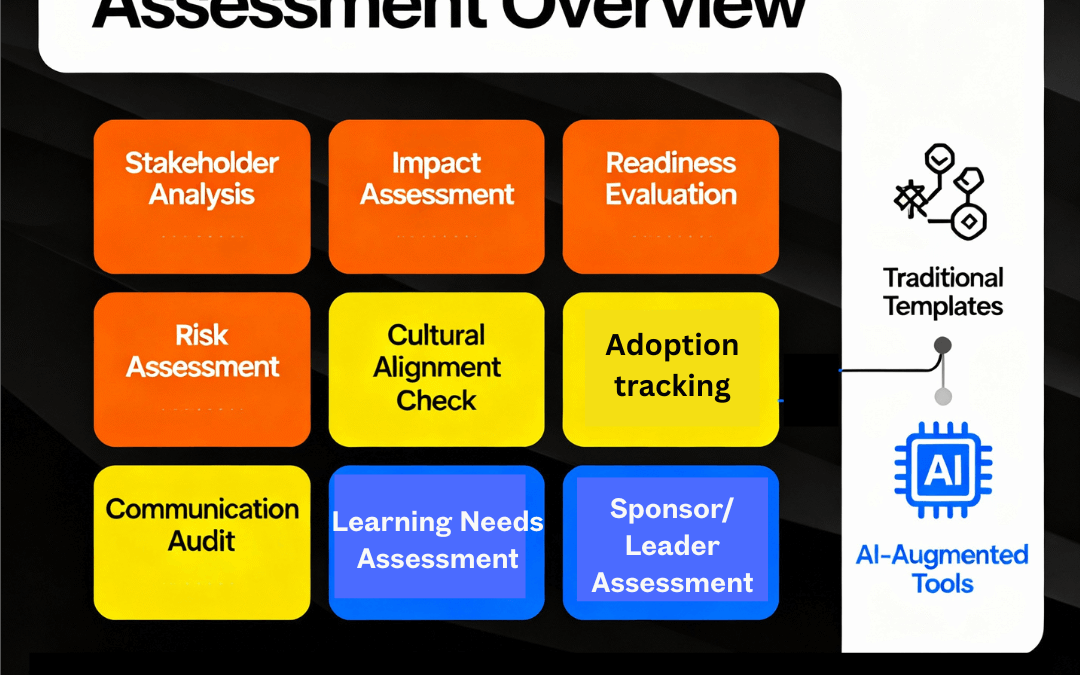
Understanding the Scope of Change Management Assessments
Change management assessments come in many forms, each serving a distinct purpose in the transformation lifecycle. Most practitioners use multiple assessment types across a single transformation initiative, layering insights to build a comprehensive picture of readiness, impact, risk, and opportunity.
The most common mistake organisations make is using a single assessment type and believing it tells the whole story. It doesn’t. A readiness assessment reveals whether people feel ready but doesn’t tell you what skills they actually need. A cultural assessment identifies organisational values but doesn’t map who will resist. A stakeholder analysis shows whom matters in the change but doesn’t reveal their specific concerns. A learning needs assessment identifies training gaps but doesn’t connect to adoption barriers. Only by using multiple assessment types, layering insights, and looking for connections between findings can you understand the true landscape of your transformation.
Impact assessment is the starting point for any transformation. It answers a fundamental question: what will actually change, and who does it affect?
An impact assessment goes beyond the surface-level project scope statement. It identifies every function, process, system, role, and team affected by the transformation. More importantly, it measures the magnitude of impact: is this a minor tweak to how people work, or a fundamental reshaping of processes and behaviours?
Impact assessment typically examines:
Process changes (what activities will be different)
System changes (what technology or tools will change)
Organisational changes (what reporting lines, structures, or roles will shift)
Role changes (what responsibilities each person will have)
Skill requirement changes (what new competencies are needed)
Culture changes (what new behaviours or mindsets are required)
Operational changes (what performance metrics will shift)
The data collected during impact assessment shapes everything downstream. Without clarity on impact, you can’t accurately scope training needs, can’t properly segment stakeholders, and can’t build a realistic change management budget. Many transformation programmes discover halfway through that they fundamentally misunderstood the scope of impact, forcing painful scope changes or inadequate mitigation strategies.
Experienced change practitioners know that impact assessment isn’t just about listing what’s changing. It’s about understanding the ripple effects. When you implement a new system, yes, people need training on the system. But what other impacts cascade? If the system changes workflow sequencing, other teams need to understand how their dependencies shift. If it changes approval permissions, people need clarity on who now has decision rights. If it changes performance metrics, people need to understand new success criteria. Impact assessment identifies these cascading effects before they become surprises during implementation.
Sample impact assessment
Function/Department
Number of Staff
Impact Level
Process Changes
System Changes
Skill Requirements
Behaviour Shifts
Loan Operations
95
HIGH
85% of workflow affected
Complete system replacement
12 new technical competencies
Shift from approval-based to data-driven decision-making
Credit Risk
32
MEDIUM
Risk approval steps remain but timing shifts
Integration with new system
5 new risk analysis capabilities
More rapid decision cycles required
Customer Service
120
LOW
Customer-facing interface improves but core responsibilities unchanged
New CRM interface
3 new system features
Proactive customer communication approach
Finance & Reporting
15
MEDIUM
New metrics and reporting required
New reporting module
4 new reporting skills
Real-time reporting vs monthly cycles
Compliance
8
MEDIUM
New compliance verification steps
Audit trail enhancements
2 new compliance processes
Continuous monitoring vs spot-checks
IT Support
12
HIGH
Support model fundamentally changes
New ticketing system
8 new technical support skills
Shift from reactive to proactive support
Cultural Assessment: Evaluating Organisational Readiness for Change
Culture is rarely measured but constantly influences transformation outcomes. Cultural assessment evaluates the values, beliefs, assumptions, and unwritten rules within an organisation that shape how people respond to change.
Cultural dimensions that affect change outcomes include:
Risk orientation: Is the culture risk-averse or entrepreneurial? This determines whether people embrace or resist change.
Trust in leadership: Do employees believe leadership has good intentions and sound judgement? This affects whether people follow leadership guidance.
Pace of decision-making: Is the culture deliberate and careful, or fast-moving and adaptable? This shapes whether transformation timelines feel realistic or rushed.
Accountability clarity: Are people comfortable with clear accountability, or do they prefer ambiguity? This affects whether new role clarity feels empowering or controlling.
Learning orientation: Does the culture embrace experimentation and learning from failure, or does it punish mistakes? This influences whether people adopt new approaches.
Collaboration norms: Do people naturally work across silos, or are functions protective? This shapes whether cross-functional change governance feels natural or forced.
Cultural assessment typically uses surveys, interviews, and focus groups to gather employee perspectives on these dimensions. The goal is to identify cultural strengths that will support change and cultural obstacles that will create resistance.
The insight here is often counterintuitive. A strong, unified culture can actually impede change if the culture is change-resistant. A culture that prides itself on “how we do things here” will push back against “doing things differently.” Conversely, organisations with more fluid, adaptive cultures often experience faster adoption. Experienced practitioners don’t judge culture as good or bad; they assess it realistically and build mitigation strategies that work with cultural reality rather than fighting it.
Stakeholder Analysis: Mapping Influence, Interest, and Engagement
Stakeholder analysis identifies everyone affected by transformation and categorises them by influence and interest. This determines engagement strategy: who needs constant sponsorship? Who needs information? Who will naturally resist? Who are likely advocates?
Stakeholder analysis typically uses a matrix that plots stakeholders by influence (high/low) and interest (high/low), creating four quadrants:
High influence, high interest: Manage closely. These are your key players.
High influence, low interest: Keep satisfied. They can block progress if dissatisfied.
Low influence, high interest: Keep informed. They’re advocates but not decision-makers.
Low influence, low interest: Monitor. They’re not critical to success but shouldn’t be ignored.
Beyond the matrix, sophisticated stakeholder analysis profiles individual stakeholder motivations: what does each person care about? What are their concerns? What will they gain or lose? What language and communication approach resonates with them?
The transformation benefit emerges when you layer stakeholder analysis with other insights. When you combine stakeholder influence mapping with cultural assessment, you can predict where resistance will come from and who has power to either amplify or neutralise that resistance. When you combine stakeholder analysis with learning needs assessment, you understand what support each stakeholder group requires. The patterns that emerge from multiple data sources are far richer than any single assessment.
Readiness Assessment: Evaluating Preparation for Change
Change readiness assessment comes in two flavours, and experienced practitioners use both.
Organisational readiness assessment happens before the project formally starts. It evaluates whether the organisation has the structural and cultural foundation to support transformation: Do we have a committed sponsor? Do we have change infrastructure and governance? Do we have resources allocated? Do we have clarity on what we’re trying to achieve? Is leadership aligned? This assessment answers the question: should we even attempt this transformation right now, or should we address foundational issues first?
Adoption readiness assessment happens just before go-live. It evaluates whether people are actually prepared to adopt the change: Have they completed training? Do they understand how their role will change? Is their manager prepared to support them? Are support structures in place? Do they feel confident in their ability to succeed? This assessment answers the question: are we ready to launch, or do we need final preparation?
Readiness assessment typically examines seven dimensions:
Awareness: Do people understand what’s changing and why?
Desire: Do people believe the change is necessary and beneficial?
Knowledge: Do people have the information and skills needed?
Ability: Do people have systems, processes, and infrastructure to execute?
Support: Is leadership visibly committed and actively removing barriers?
Culture and communication: Is there trust, openness, and honest dialogue?
Commitment: Will people sustain the change long-term?
The data reveals what readiness actually exists versus what’s assumed. Many organisations assume that if people attended training, they’re ready. Assessment data often shows something different: training completion and actual readiness are correlates, not equivalents. People can attend training and remain unconfident or unconvinced. Assessment finds these gaps before they become adoption failures.
Readiness assessment sample output
Assessment Type: Organisational Readiness (Pre-Transformation) Initiative: Customer Data Platform Implementation
Readiness Scorecard:
Dimension
Score
Status
Comment
Sponsorship Commitment
8/10
Strong
CEO personally championing; allocated budget
Leadership Alignment
6/10
Caution
Finance and Ops aligned; Technology concerns about timeline
Change Infrastructure
5/10
At Risk
No dedicated change function; relying on project team
Resource Availability
7/10
Good
Core team allocated; limited surge capacity
Clarity of Vision
8/10
Strong
Compelling business case; clear success metrics
Cultural Readiness
5/10
At Risk
Risk-averse organisation; past project failures causing hesitation
Stakeholder Buy-In
6/10
Caution
Early adopters engaged; middle management unconvinced
Learning needs assessment identifies what knowledge and skills people need to perform effectively in the new state and what gaps exist today.
A complete learning needs assessment examines:
Knowledge gaps: What do people need to know about new systems, processes, and ways of working?
Skill gaps: What new capabilities are required?
Behaviour gaps: What new ways of working must people adopt?
Confidence gaps: Where do people feel unprepared or uncertain?
Role-specific needs: What are differentiated needs by role, function, or seniority?
The insight emerges when you look for patterns. Which teams have the largest gaps? Which roles feel most uncertain? Are gaps concentrated in specific functions or spread across the organisation? Do gaps cluster around particular topics or specific systems? These patterns shape training strategy, timing, and emphasis.
Experienced practitioners know that learning needs assessment connects to adoption barriers. If specific groups have large capability gaps, they’ll likely struggle with adoption. If specific topics generate high uncertainty, they’ll need more support. If certain roles feel unprepared, they’ll become adoption blockers. By identifying these connections early, practitioners can build targeted interventions.
Adoption Assessment: Measuring Actual Behavioural Change
Adoption assessment is perhaps the most critical yet often most neglected assessment type. It measures whether people are actually using new systems, processes, and ways of working correctly and consistently.
Adoption assessment goes beyond tracking login frequency or training completion. It examines:
System usage: Are people using the system? Which features are used, and which are ignored?
Workflow adherence: Are people following new processes, or reverting to old ways?
Proficiency progression: Are people becoming more skilled over time, or plateauing?
Workarounds: Where are people working around new systems or processes?
Behavioural change: Are new, desired behaviours becoming embedded?
Compliance: Are people following required controls and governance?
The patterns that emerge reveal what’s actually working and what isn’t. High adoption in some areas but resistance in others suggests the change fits some business contexts but conflicts with others. Rapid adoption followed by plateau suggests initial enthusiasm but difficulty sustaining change. Widespread workarounds suggest the new system or process has design gaps or conflicts with real operational needs.
Adoption assessment is where data and human interpretation diverge most sharply. The data shows what’s happening. The interpretation determines why. Is low adoption a change management failure (people don’t understand or don’t want the change), an adoption support failure (they want to change but lack resources or capability), a design failure (the new system or process doesn’t actually work for their context), or a business case failure (the change doesn’t deliver the promised benefits)? Each root cause requires different mitigation. Data alone can’t tell you the answer; experience and contextual understanding can.
Behavioural Change Tracking:
Behaviour
Adoption Rate
Trend
Submitting expenses via system
72%
Increasing
Using digital receipts instead of paper
48%
Increasing but slow
Submitting on time (vs overdue)
61%
Slight decline
Approving expenses in system
85%
Strong
Compliance and Risk Assessment: Understanding Regulatory and Operational Risk
Compliance and risk assessment evaluates whether transformation activities maintain regulatory compliance, control adherence, and operational risk management.
This assessment typically examines:
Control effectiveness: Are required controls still operating correctly during and after transition?
Regulatory compliance: Are we maintaining compliance with relevant regulations during change?
Data security: Are we protecting sensitive data throughout transition?
Process integrity: Are critical processes maintained even as we change other elements?
Operational risk: What new risks are introduced by the transformation?
The insight here is often stark: many transformations discover during implementation that they’re creating compliance or control gaps. System transitions may leave periods where controls are weaker. New processes may have unintended compliance implications. Data migration may create security exposure. Early risk assessment identifies these issues before they become problems, allowing mitigation planning.
Compliance and risk assessment sample output
Assessment: Control Environment During System Transition Initiative: Manufacturing ERP Implementation
Critical Control Status During Transition:
Control
Pre-Migration Status
Migration Risk
Post-Migration Status
Mitigation
Segregation of Duties (Purchasing)
Operating
HIGH
Design verified
Dual sign-off during transition
Inventory Cycle Counts
Operating
MEDIUM
Design verified
Weekly counts during transition period
Financial Reconciliation
Operating
HIGH
Design verified
Parallel run for 30 days
Approval Authorities
Operating
MEDIUM
Reconfigured
Training on new authority matrix
Audit Trail
Not available
MEDIUM
Enhanced
Data retention policy reviewed
The Role of Analysis and Analytical Skills
Here’s where experienced change practitioners distinguish themselves from those following templates: the ability to analyse assessment data, find patterns, and translate findings into strategic insight.
Template-based approaches gather assessment data, check boxes, and move to predetermined next steps. Analytical approaches ask harder questions of the data:
What patterns emerge across multiple assessments? If readiness assessment shows low awareness but high desire, that’s different from low desire and high awareness. The first needs communication; the second needs benefits clarity.
Where do assessments conflict or create tension? If cultural assessment shows a risk-averse culture but impact assessment shows the change requires risk-embracing behaviours, that’s a critical tension requiring specific mitigation strategy.
Which findings are unexpected? Unexpected patterns often reveal important insights that predetermined templates miss.
What do the findings suggest about root causes versus symptoms? Surface-level resistance might stem from awareness gaps, capability gaps, cultural misalignment, or stakeholder concerns. Each has different solutions.
How do findings in one area cascade to other areas? Low adoption readiness in one function might cascade to adoption failures in dependent functions.
Analytical skills require comfort with ambiguity. Assessment data rarely tells a clear story. More commonly, it tells multiple stories that require interpretation. Experienced practitioners synthesise across data sources, form hypotheses about what’s really happening, and design targeted interventions to test and refine those hypotheses.
The Evolution: From Templates to Technology to Intelligence
Change management practice is evolving through distinct phases.
Phase 1: Template-based assessment dominated for years. Standard questionnaires, predetermined analysis, checkbox completion. Templates provided structure and consistency, which was valuable for bringing consistency to change management practice. The limitation: templates assume one size fits all and rarely surface unexpected insights.
Phase 2: Data-driven assessment emerged as practitioners recognised that larger data sets reveal patterns templates miss. Instead of a standard questionnaire, assessment included multiple data sources: surveys, interviews, focus groups, historical project data, performance metrics, employee sentiment analysis. The limitation: even with more data, human capacity to synthesise complex information across multiple sources is limited.
Phase 3: Digital/AI-augmented assessment is emerging now. Digital platforms collect assessment data at scale and speed impossible for humans. Machine learning identifies patterns across thousands of data points and surfaces anomalies and correlations humans might miss. But here’s the critical insight: AI may not always be reliable at interpretation across different types of data forms. It can tell you that adoption is lower in division X than division Y. It might not always be accurate in telling you whether that’s because division X has a change-resistant culture, because the change conflicts with their business model, because their local leadership isn’t visibly committed, or because their systems don’t integrate well with the new platform. The various layers of nuances plus data interpretation requires human judgment, critique, business context, and change experience.
The future of change management assessment lies in this combination: AI handling data collection, pattern recognition, and anomaly detection at scale, supplemented by human interpretation that understands context, causation, and strategy.
How to Build Assessment Rigour Into Your Approach
Regardless of the assessment types you use, several principles improve quality and insight:
Use multiple data sources. Single-source data is unreliable. Surveys show what people think; interviews show what they really believe; project history shows what actually happens. Layering sources reduces individual bias.
Segment your data. Aggregate data hides important variation. Breaking data by function, location, seniority level, or job role often reveals where challenges concentrate and where strengths lie.
Look for patterns and contradictions. Where multiple assessments show consistent findings, you’ve found solid ground. Where assessments contradict, you’ve found important tensions requiring investigation.
Question unexpected findings. When assessment data contradicts assumptions or conventional wisdom, dig deeper before dismissing the finding. Often these are the most important insights.
Connect findings to strategy. Assessment findings should shape change management strategy. If readiness assessment shows low awareness, communication strategy must shift. If cultural assessment shows misalignment with required behaviours, you need specific culture change work. If stakeholder analysis shows concentrated resistance, you need targeted engagement strategy.
Reassess throughout the transformation. Assessment isn’t a one-time event. Conditions change as you move through transformation phases. Early assessment findings may no longer apply by mid-programme. Reassessment at key milestones tracks whether your mitigation strategies are working.
Making Assessment Practical
The risk with comprehensive assessment guidance is it sounds overwhelming. Here’s how to make it practical:
Start with the assessments most critical to your specific transformation. You don’t need all assessment types for every change. Match assessment type to your biggest uncertainties or risks.
Use assessment to test specific hypotheses. Rather than generic “what’s your readiness?” ask “do you understand how your role will change?” This makes assessment data actionable.
Combine template efficiency with analytical depth. Use standard survey templates for consistency and comparable data. Then drill into unexpected patterns with targeted interviews and focus groups.
Invest in interpretation time. The assessment data collection is the easy part. The valuable work is stepping back and asking “what does this really mean for my transformation strategy?”
The Future of Assessment: Data Plus Insight
Change management assessments are at an inflection point. The frameworks and methods have matured. What’s evolving is the way we gather, analyse, and interpret assessment data.
Technology enables assessment at unprecedented scale and speed. Organisations can now assess thousands of employees, track sentiment evolution through transformation phases, and correlate adoption patterns with dozens of organisational variables. The pace of data collection and pattern recognition is transforming.
What hasn’t changed and won’t change is the need for human expertise to interpret and critique findings, understand context, and translate data into strategy. An AI might identify that adoption is declining in specific roles or locations. A change practitioner interprets whether that’s a training issue, a support issue, a design issue, or a business case issue, and designs appropriate response.
The organisations that will excel at transformation are those that combine both: technology that amplifies human capability by handling data collection and pattern recognition, and experienced practitioners who interpret findings and design strategy based on understanding of organisation, context, and change leadership.
Key Takeaways
Change management assessments are not compliance exercises. They’re strategic tools for understanding whether transformation will succeed or fail. Using multiple assessment types, looking for patterns across assessments, and combining analytical skill with technology creates the foundation for transformation success. The organisations that treat assessment as rigorous analysis rather than checkbox completion consistently achieve better transformation outcomes.
What is the difference between readiness assessment and adoption assessment?
Organisational readiness assessment happens before transformation begins and evaluates whether the organisation is structurally and culturally prepared to undertake change. It asks: do we have committed sponsorship, resources, aligned leadership, and infrastructure? Adoption readiness assessment happens just before go-live and evaluates whether employees are prepared to actually adopt the change. It asks: have people completed training, do they understand how their role changes, are support structures in place? Both are essential; they serve different purposes at different transformation phases. On the other hand, actual adoption tracking and monitoring happens after the project release.
Why do many transformations fail despite passing readiness assessments?
Readiness assessments measure perceived readiness and infrastructure readiness, not actual capability or genuine commitment. People can report feeling ready on a survey but lack actual skills, still hold reservations or just become busy with other work focus priorities. Leadership can appear committed in formal settings but subtly undermine change through conflicting priorities. Organisations can have assessment processes in place but lack follow-through on issues the assessment revealed. True success requires not just assessment but acting on assessment findings throughout transformation.
How do I connect assessment findings to actual change management strategy?
Assessment findings should directly shape strategy. If readiness assessment shows awareness gaps, communication intensity must increase. If cultural assessment shows risk-averse culture but change requires risk-embracing behaviours, you need explicit culture change work alongside training. If stakeholder analysis shows concentrated resistance among key influencers, targeted engagement strategy is essential. If adoption assessment shows workarounds, the system or process design may need refinement. Each finding type should trigger specific, tailored strategy responses.
What’s the most critical assessment type for transformation success?
Adoption assessment is perhaps most critical because it measures what actually matters: whether people are using new ways of working correctly. Results may be used to reinforce or support adoption. However, no single assessment type tells the complete story. For example, readiness assessment is critical because it is the predictor for adoption. On top of this, having an accurate impact assessment is key as it forms the overall change approach. Comprehensive transformation success requires multiple assessment types at different phases, layering insights to understand readiness, impact, capability, risk, and actual outcomes. The assessment types work together to build approach strategic clarity.
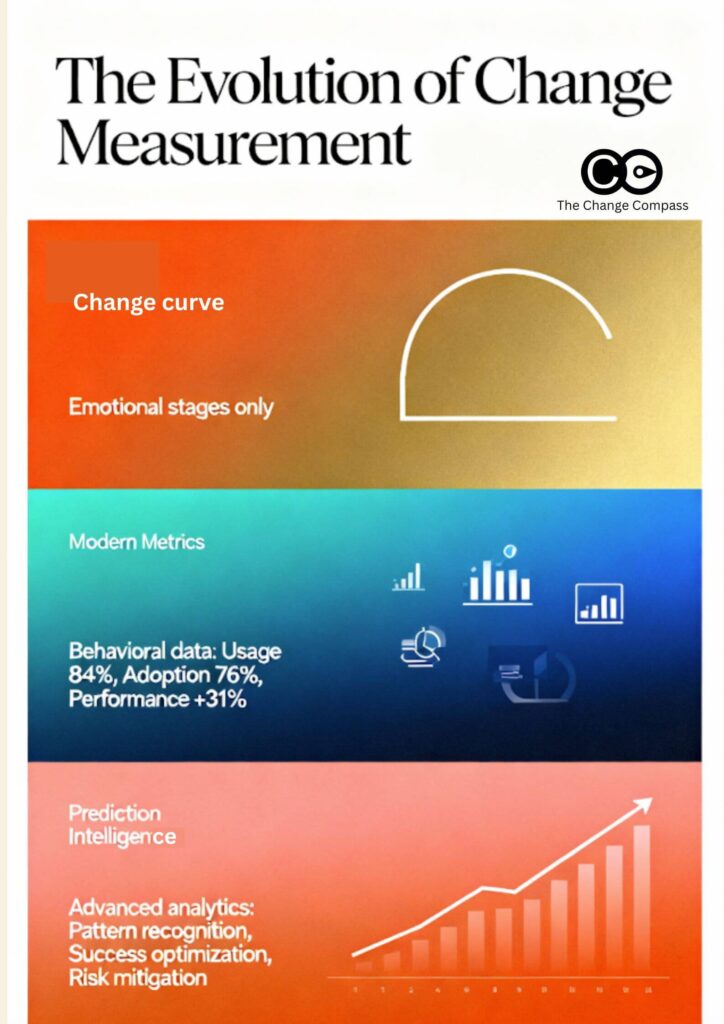
Understanding how people navigate through organisational change has been a cornerstone of effective change management for decades. The change management curve, adapted from Elisabeth Kübler-Ross’s work on grief, provides valuable insights into the emotional journey individuals can experience during transformation. However, measuring change adoption requires more than simply mapping people’s positions on this curve – it demands a sophisticated understanding of behavioural indicators, performance metrics, and the complex realities of modern organisational change in organisations.
The relationship between the emotional stages of change and measurable adoption outcomes is both nuanced and critical to transformation success. While the change curve offers a framework for understanding emotional responses within your change management framework, measuring change management effectiveness requires concrete, observable indicators that demonstrate whether people are actually embracing new ways of working rather than merely progressing through emotional stages.
This guide explores how to measure change adoption effectively within the change management curve. We’ll examine when the curve provides valuable guidance, when it may mislead practitioners, and how to build robust measurement frameworks that capture the true indicators of change management success in complex organisational environments.
Understanding the change management curve
Origins and validation of the model
The change management curve emerged from Dr. Elisabeth Kübler-Ross’s 1969 work “On Death and Dying,” which outlined five stages of grief experienced by terminally ill patients. Change management practitioners adapted this psychological model to explain how individuals respond emotionally to organisational transformations as part of change management theory.
Recent research by Hagemann and Cechlovsky (2024) provides empirical validation of these stages in business environments, demonstrating that “individuals manifest akin responses within their respective phases of the change curve, amenable to effective facilitation through judicious interventions”. The study identified four validated phases that consistently appear across different project contexts: Unawareness & Denial, Discomfort & Resistance, Exploration & Discovery, and Integration & Commitment.
Multiple studies have validated the existence of the change curve in organisational contexts, including research from The University of Alabama (1999), “The Death Valley of Change” study (2002), and Finnish-American research (2010). However, the research also reveals important limitations. The curve is not universally applicable, and individual experiences vary significantly. Some people adapt faster than others, and some may not even go through all the stages.
When the change curve is useful for understanding adoption
Appropriate contexts for curve application
The change management curve proves most valuable in specific organisational contexts where emotional processing plays a central role in adoption success within your change management approach. Research indicates that the curve is particularly effective when changes require significant behavioural change management, involve loss or disruption of familiar systems, affect deeply held values or practices, or create uncertainty about job security or role changes.
Complex system implementations, organisational restructuring, cultural transformations, and compliance initiatives that alter fundamental work practices represent ideal applications for change curve analysis as part of your change management methodology.
Individual-level emotional support and resistance prediction
The change curve excels at providing frameworks for individual emotional support during transformation. Understanding where individuals are positioned on the curve enables “effective facilitation through judicious interventions” as part of comprehensive change management techniques. Someone in the denial phase requires different support than someone in the exploration phase.
When the change curve should not be used
Linear progression and high-performing environments
Recent research reveals that the characteristic “dip” in the change curve may not occur in environments with the right conditions. As noted by Leopold and Kaltenecker (2015), the performance dip primarily occurs “when the change necessitates that people in the organisation have to unlearn old behaviours, processes and systems and learn new ways of doing things”.
In organisations with strong change management capabilities, high psychological safety, clear communication, and adequate support systems, individuals may transition through change without experiencing significant emotional disruption. High-performing teams with previous positive change experiences may demonstrate change readiness that bypasses traditional curve patterns entirely.
Complex organisational and technology-driven changes
The change curve focuses on individual emotional responses but fails to address the systemic complexities of modern organisational change. Large-scale transformations involving multiple interdependent systems, cross-functional teams, and varied stakeholder groups require change analysis beyond individual emotional processing.
Contemporary changes often involve agile change management approaches, iterative implementations, and continuous adaptation that don’t align with the discrete stages suggested by the curve model. Additionally, not all organisational changes trigger the emotional responses that the change curve addresses. Technology upgrades with minimal workflow impact or process optimisations may not generate significant emotional responses, and attempting to apply curve-based interventions to these situations may misdirect resources away from practical adoption barriers.
Key elements of measuring change adoption
Behavioural indicators vs emotional stages
Effective change adoption measurement requires distinguishing between emotional processing and actual behavioural change. While the change curve tracks emotional responses, adoption measurement must focus on observable actions that indicate genuine integration of new ways of working.
Behavioural indicators provide concrete evidence of adoption success:
• System usage frequency and feature utilisation patterns
• Knowledge sharing and collaborative behaviours using new tools or processes
These indicators offer more reliable adoption insights than emotional assessments because they reflect actual implementation of change rather than feelings about change.
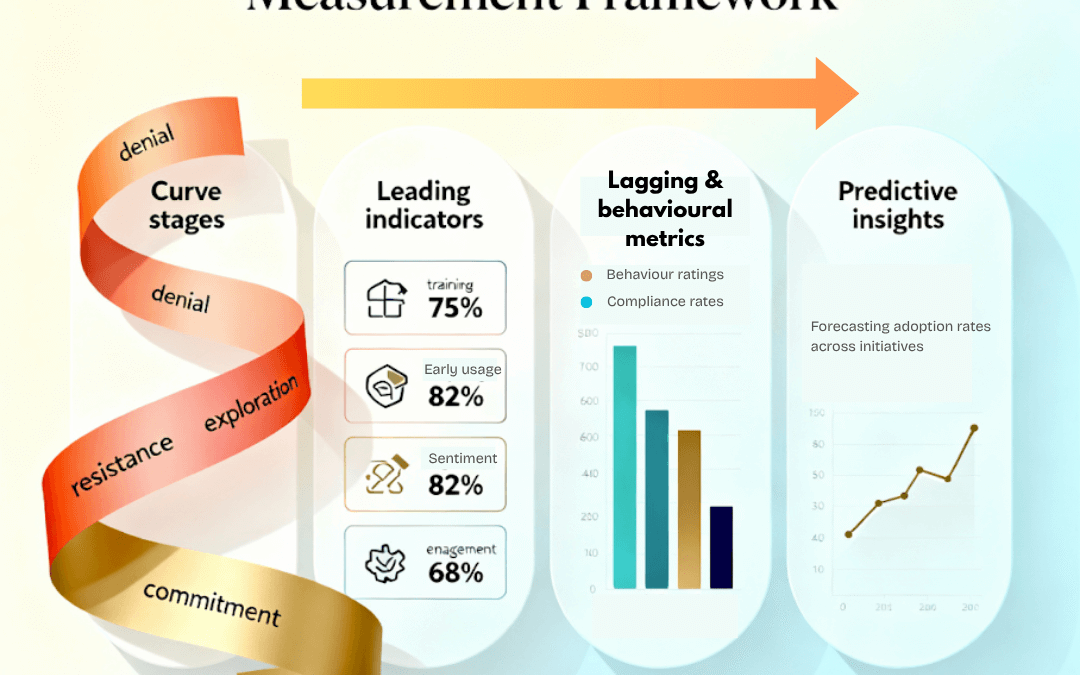
Leading vs lagging adoption metrics
Comprehensive change adoption measurement requires understanding the distinction between leading and lagging indicators as part of change management KPI frameworks.
Leading indicators include training completion rates and competency assessments, early system usage patterns, stakeholder engagement in change management activities, feedback sentiment and change champion activity.
Lagging indicators encompass sustained performance improvements, full workflow integration, business outcome achievement, long-term retention of new behaviours, and customer satisfaction improvements.
Quantitative and qualitative approaches
Quantitative metrics provide objective, measurable data about change adoption progress using change management analytics. Essential metrics include adoption rate (percentage of target users actively using new systems), time-to-adoption, usage frequency, feature utilisation, compliance rates, and performance measures showing productivity and quality improvements.
While quantitative metrics provide measurable outcomes, qualitative assessment offers crucial context about adoption barriers, user experience, and sustainability factors through stakeholder interviews, change management surveys, observational studies, feedback sessions, and case studies. These approaches reveal the “why” behind quantitative patterns and inform targeted interventions.
Building comprehensive adoption measurement frameworks
Multi-dimensional measurement approach
Effective change adoption measurement requires frameworks that capture multiple dimensions of change simultaneously. Comprehensive measurement examines adoption across people, process, and business dimensions.
People metrics focus on individual and team change readiness, capability development, and engagement levels. Process metrics examine how well new workflows and systems are being integrated into daily operations. Business metrics demonstrate the ultimate value delivery of change initiatives through improved outcomes, cost savings, and strategic objective achievement.
Technology-enabled measurement platforms
Modern change adoption measurement benefits significantly from technology platforms that automate data collection, provide real-time insights, and enable sophisticated analysis as part of change management tools and techniques.
Technology advantages include real-time data collection from system usage and user interactions, automated reporting that reduces manual effort, predictive analytics that identify adoption risks, change management metrics dashboard visualisation, and integration capabilities that combine data from multiple sources.
Change adoption measurement must be ongoing rather than episodic to capture the dynamic nature of adoption processes through effective change monitoring. Continuous monitoring approaches include weekly usage analytics, monthly adoption reviews, quarterly deep-dive analyses, and real-time alert systems flagging significant adoption issues.
This approach transforms measurement from a retrospective assessment tool into a proactive management capability that drives ongoing change management success.
Integration of change curve insights with adoption metrics
Combining emotional and behavioural indicators
The most effective change adoption measurement approaches combine insights from the change management curve with concrete behavioural metrics. This integration provides both emotional intelligence about stakeholder experience and objective data about adoption progress as part of comprehensive change management best practices.
Integrated measurement frameworks track emotional indicators showing curve progression alongside behavioural metrics demonstrating actual adoption, satisfaction and confidence measures correlated with performance and usage data, and resistance patterns identified through curve analysis combined with compliance and engagement metrics.
Using curve insights to interpret adoption data
Change curve insights provide valuable context for interpreting adoption metrics. Understanding emotional progression helps explain adoption patterns and guides appropriate responses to measurement findings.
For example, decreased system usage during early implementation phases may reflect curve-predicted resistance rather than system problems, requiring different interventions than technical issues would warrant. Similarly, rapid adoption by some users may indicate curve bypass rather than universal success, suggesting need for continued support of others still processing emotional aspects of change.
The Change Compass approach to predictive adoption intelligence
Beyond measurement to predictive insights
The Change Compass platform represents the next evolution in change adoption measurement, moving beyond traditional tracking to provide predictive and prescriptive intelligence that transforms how organisations approach change management. Rather than simply reporting what has happened, The Change Compass uses sophisticated analytics to forecast adoption trajectories and identify the factors that drive successful adoption across different contexts.
This predictive capability addresses one of the fundamental limitations of traditional change management tracking: the reactive nature of insights that arrive too late to inform proactive intervention. The Change Compass enables organisations to identify adoption risks weeks or months before they manifest, providing the lead time necessary for effective mitigation strategies.
Data-driven adoption forecasting
The Change Compass leverages historical change management data combined with current adoption indicators to generate accurate forecasts of adoption rates across different stakeholder groups, timeframes, and change contexts.
Forecasting capabilities include:
• Adoption rate predictions by stakeholder group, showing expected adoption curves over time
• Risk identification highlighting specific individuals, teams, or business units likely to struggle with adoption
• Timeline accuracy providing realistic estimates for achieving adoption milestones
• Resource requirement forecasting predicting support needs throughout the adoption journey
• Outcome probability estimating likelihood of achieving intended business results
These predictions enable change managers to allocate resources proactively, adjust timelines realistically, and design interventions that address predictable challenges before they impact outcomes.
Pattern recognition for adoption success factors
Beyond forecasting adoption trajectories, The Change Compass identifies the specific factors that enhance or inhibit adoption success within your organisational context. Through analysis of multiple change initiatives over time, the platform recognises patterns that distinguish successful adoption from failures.
Pattern analysis can reveal:
• Stakeholder characteristics associated with rapid adoption (previous change experience, role types, team dynamics)
• Intervention effectiveness showing which change management techniques produce the best outcomes in different contexts
• Environmental factors that accelerate or impede adoption (organisational culture, leadership support, resource availability)
• Optimal timing patterns for training, communication, and support activities
• Threshold indicators signalling when adoption has achieved sustainability
This intelligence transforms change management from an art based on intuition to a science informed by evidence. Instead of relying on generic best practices, organisations can implement strategies proven effective within their specific environment.
Contextual intelligence for targeted interventions
The Change Compass provides contextual intelligence that enables precisely targeted interventions rather than generic approaches. By understanding how to measure change management success factors specific to different stakeholder groups, the platform recommends interventions tailored to the unique characteristics of each adoption challenge.
Contextual recommendations address individual learning preferences, team dynamics, role-specific barriers, geographic variations, and timing optimisation to schedule interventions when stakeholders are most receptive. This level of precision dramatically improves intervention effectiveness while optimising resource allocation to areas of greatest need.
Delivering strategic value through integrated intelligence
The Change Compass is an example of a digital platform that transforms change management from a tactical support function into a strategic capability that drives measurable organisational value. By integrating adoption measurement with broader business intelligence systems, the platform provides executives and transformation leaders with the insights needed to make confident, data-informed decisions about their change portfolio.
This integration enables organisations to understand the true impact of their change initiatives on business performance, moving beyond activity reporting to demonstrate concrete value delivery. When adoption metrics connect directly to revenue growth, cost reduction, customer satisfaction improvements, and strategic objective achievement, change management becomes demonstrably essential to organisational success.
Strategic benefits include:
• Portfolio optimisation through clear visibility of which change initiatives deliver the greatest value, enabling smarter resource allocation across the transformation portfolio
• Risk mitigation by identifying struggling initiatives early enough to course-correct, protecting strategic investments from failure
• Capability building as pattern recognition reveals which change management approaches work best in your specific organisational context, building institutional knowledge that improves with each transformation
• Executive confidence in transformation investments backed by predictive analytics showing expected returns and realistic timelines
• Competitive advantage through faster, more successful change execution that enables rapid response to market opportunities
The change management curve provides valuable insights into emotional processing during organisational transformation, but effective change adoption measurement requires comprehensive frameworks that capture behavioural change, performance improvement, and sustained implementation success. Modern change adoption measurement benefits from technology-enabled data collection, analytics-driven insights, and continuous change monitoring approaches that transform measurement from retrospective assessment to proactive management capability.
The future of change adoption measurement lies in predictive, and technology-enhanced approaches that recognise individual differences while maintaining organisational coherence. The ability to not only track but forecast and optimise adoption through pattern recognition represents the next frontier in enterprise change management, enabling organisations to approach transformation with unprecedented confidence and precision in achieving change management success.
References
Hagemann, M., & Cechlovsky, S. (2024). Revisiting the change curve: A rigorous examination and three case studies prompting a re-evaluation of a timeless concept. Journal of Health Services Management. Retrieved from https://journals.sagepub.com/doi/10.3233/HSM-240051
Leopold, K., & Kaltenecker, S. (2015). Organizational and Personal Change. Kanban Change Leadership: Creating a Culture of Continuous Improvement, 110-121.
Nikula, U., Jurvanen, C., Gotel, O., & Gause, D. C. (2010). Empirical validation of the Classic Change Curve on a software technology change project. Information and Software Technology, 52(6), 680-696.
FAQ: Measuring Change Adoption Within the Change Management Curve
Q: What is the change management curve and why does it matter for measuring change adoption?
A: The change management curve (adapted from Elisabeth Kübler‑Ross’s model) describes how individuals emotionally progress through stages during organisational change. It matters for measuring change adoption because it provides context for emotional responses that may influence users’ behaviours—though actual adoption must be measured via behavioural and performance indicators.
Q: What are the limitations of using the change management curve for adoption measurement?
A: The curve assumes a linear, sequential progression through emotional stages, but in real organisational settings individuals may skip or revisit stages, or show minimal emotional disruption. Also, the curve focuses on emotional states, whereas adoption measurement must capture observable behaviour and business outcomes.
Q: What are the most effective metrics to measure change adoption?
A: Effective metrics include behavioural indicators (e.g., system usage frequency, feature utilisation, process compliance, knowledge-sharing) and a combination of leading indicators (training completion, early usage patterns, stakeholder engagement) and lagging indicators (sustained performance improvements, workflow integration, business results).
Q: How can organisations build a comprehensive adoption measurement framework?
A: A robust framework covers multiple dimensions — people (capability, engagement), process (workflow integration, compliance), and business (outcomes, value delivery) — and uses both quantitative (adoption rate, time-to-adoption, usage metrics) and qualitative (surveys, interviews, feedback) methods. It should include continuous monitoring, not just one-off assessments.
Q: How can insights from the change curve be integrated with adoption metrics?
A: By combining emotional insights from the change curve (such as where stakeholders might be in their emotional journey) with behavioural and performance data, organisations can interpret adoption patterns more accurately. For example, a drop in usage might reflect a resistance phase rather than a technical fault.
Q: What role does technology play in measuring change adoption?
A: Technology enables automated data collection (e.g., system logs, usage analytics), real-time dashboards, predictive analytics, and integration across systems. This allows transformation teams to move from retrospective measurement to proactive, predictive adoption management.
Q: When should the change management curve be used—and when should it not?
A: Use the change curve when changes involve significant emotional or behavioural disruption (e.g., major system replacements, role re-definitions) because emotional processing is likely a key factor. Avoid relying on it when changes are incremental, low-impact on roles or processes, or in high-performing teams with strong change readiness where the classic “dip” may not occur.
Latest findings from academic studies reveal the real drivers behind successful organisational transformation
If you’re leading organisational change, you’ve probably wondered why some change initiatives take off while others crash and burn despite having similar resources and executive support. The good news is that decades of academic research have cracked the code on what actually drives change adoption success. And the findings might surprise you.
Recent meta-analyses tracking thousands of change initiatives across industries have identified six psychological factors that predict up to 88% of the variance in whether people will embrace or resist organisational change. This isn’t theoretical fluff – these are measurable, actionable insights that can transform your change management approach.
The traditional change management process isn’t enough
Most change management frameworks focus heavily on communication plans, training schedules, and governance structures. While these do matter, research shows they’re not the primary drivers of adoption success. A longitudinal study published in the Journal of Applied Social Psychology found that traditional change management activities only explained about 30% of adoption outcomes.
The real game-changers happen at the psychological level – how people feel about the change, whether they believe they can succeed with it, and if it aligns with their sense of identity and purpose.
What the research reveals about change readiness
The strongest predictor of change adoption isn’t how well you communicate the business case or how comprehensive your training programme is. According to research from Albrecht and colleagues published in Frontiers in Psychology, three psychological conditions together explain 88% of the variance in employee change engagement:
Change-related meaningfulness: Do people understand how this change helps them make a meaningful contribution? When employees see clear connections between the change and their deeper sense of purpose, intrinsic motivation kicks in. This isn’t about vague mission statements – it’s about helping people see tangible ways the change enhances their ability to do work that matters.
Change-related self-efficacy: Do people believe they can successfully navigate and master the change? Confidence in one’s ability to adapt is a powerful predictor of proactive change behaviour. Teams with higher change self-efficacy don’t just comply – they innovate and find better ways to implement changes.
Change-related psychological safety: Can people express concerns, ask questions, and make mistakes without fear? When psychological safety is high, resistance transforms into constructive dialogue. People move from defending against change to collaborating on making it work better.
These three factors work together. You can’t just focus on one and expect miraculous results. But when all three are present, the research shows dramatic improvements in both adoption speed and sustainability.
The autonomy factor that changes everything
Self-determination theory research, with effect sizes sustained over 13-month periods, reveals three autonomy-supportive conditions that dramatically improve change adoption:
• Providing clear rationale: People need to understand not just what’s changing, but why it’s necessary. This goes beyond business cases to help individuals connect the change to broader organisational or societal purposes.
• Offering choices in implementation: Even limited choice in how to implement changes preserves people’s sense of agency. Teams with input into change processes show 65% higher engagement levels.
• Acknowledging feelings and concerns: Counter-intuitively, acknowledging negative emotions about change actually facilitates acceptance. When concerns are heard and addressed, psychological reactance decreases.
This research challenges the traditional “tell and sell” approach to change management. Instead of trying to overcome resistance, successful change leaders create conditions where people can choose to embrace change because it serves their psychological needs.
Social identity: the hidden driver of change success
One of the most overlooked aspects of change management is how changes affect people’s sense of identity and group belonging. Social identity theory research identifies two distinct pathways for successful change adoption:
Identity maintenance pathway: People more readily adopt change when they can preserve core aspects of their existing identity while adapting to new circumstances. This works through continuity mechanisms – maintaining connection to valued aspects of organisational culture and relationships while evolving others.
Identity gain pathway: Alternatively, individuals embrace change when they perceive it will enhance their social identity or provide access to more valued group memberships. This operates through aspiration mechanisms – change becomes attractive when it offers opportunities for growth or alignment with desired characteristics.
The practical implication? Before launching your change initiative, map out how the change affects different groups’ identities (I,e, your change impacts). Then design your approach to either preserve valued identities or provide compelling identity gains.
Rogers’ innovation characteristics still matter
Diffusion of innovation theory, validated across thousands of studies, identifies five characteristics that predict adoption rates and collectively explain 50-90% of adoption variance:
• Relative advantage: The degree to which change is perceived as better than existing approaches • Compatibility: How well change aligns with existing values and experiences • Simplicity: The perceived ease of understanding and implementing change • Trialability: The ability to experiment before full commitment • Observability: The visibility of change results to others
These factors operate through different psychological mechanisms. Relative advantage works through comparison processes, compatibility through cognitive consonance, and observability through social proof. Smart change leaders deliberately design their initiatives to optimise these characteristics.
Measuring what matters: change adoption metrics that predict success
Traditional change management metrics often miss the mark. Tracking training completion rates or communication reach tells you about activities, not outcomes. Research-based change assessment focuses on measuring the psychological conditions that predict adoption:
Early indicators of success: • Meaningfulness ratings: Do people see how the change connects to their purpose? • Self-efficacy scores: How confident are teams about succeeding with the change? • Psychological safety levels: Can people express concerns without fear? • Autonomy support perception: Were rationale, choice, and concerns adequately addressed?
Behavioural indicators: • Proactive change behaviour: Are people finding ways to improve implementation? • Help-seeking behaviour: Are teams asking questions and sharing challenges? • Innovation around the change: Are people adapting the change to work better in their context?
These metrics give you leading indicators of adoption success, allowing you to intervene before problems become entrenched.
The intrinsic motivation advantage
Research consistently shows that intrinsic motivation produces more sustainable change adoption than external incentives. Studies on intrinsic motivation in workplace change show it operates through three fundamental psychological needs:
Autonomy: The need to feel self-directed rather than controlled. Changes that preserve or enhance autonomy see higher sustained adoption rates.
Mastery: The desire to develop competence and skill. Changes that provide growth opportunities tap into learning motivation, making adaptation engaging rather than threatening.
Purpose: The need to contribute to something meaningful. Changes that enhance sense of purpose leverage powerful intrinsic motivators.
Organisations that cultivate intrinsic motivation during change see 83% higher likelihood of innovation, improved retention, and more positive cultures that become self-reinforcing for future changes.
Loss aversion: People psychologically weight potential losses twice as heavily as equivalent gains. This means change communications focusing only on benefits may be insufficient to overcome perceived risks.
Status quo bias: The tendency to prefer current conditions even when alternatives might be superior. This operates through familiarity preferences and psychological comfort with predictability.
Confirmation bias: Selective processing of information that confirms existing beliefs while dismissing contradictory evidence. This particularly affects how people interpret change communications and early experiences.
Successful change initiatives address these barriers directly rather than trying to overpower them with rational arguments. Research shows that change programmes acknowledging and working with psychological barriers have significantly higher success rates.
• Create psychological safety through their own vulnerability and openness to feedback • Provide clear rationale that connects to employees’ values and sense of purpose • Offer genuine choices in how changes are implemented at the team level • Acknowledge the emotional impact of change rather than dismissing concerns • Model the mindset and behaviours they want to see in others
Putting it all together: a psychological systems approach
The most significant finding from this research is that these psychological mechanisms aren’t individual preferences – they represent universal human needs. When addressed systematically, they can dramatically improve change outcomes. Organisations that invest in understanding and supporting these psychological processes see 3.5 times higher success rates in change initiatives.
This research fundamentally challenges traditional change management practice. Instead of an engineering mindset focused on processes and structures, successful change requires a psychological science approach that prioritises human motivation, meaning, and social dynamics.
Practical steps for change leaders:
• Start with meaningfulness: Help people understand how the change enhances their ability to contribute meaningfully • Build confidence: Provide skills, support, and early wins to develop change self-efficacy • Create safety: Establish norms where concerns can be expressed and mistakes are learning opportunities • Preserve autonomy: Provide rationale, offer choices, and acknowledge feelings throughout the process • Consider identity: Map how the change affects group identities and design accordingly • Optimise innovation characteristics: Make changes obviously beneficial, compatible, simple, testable, and visible
The future of change management
Recent studies on the evolution of change management suggest we’re moving toward more psychologically informed approaches. Organisations that integrate these research findings into their change management frameworks are seeing:
• 40% faster adoption rates • 60% higher employee satisfaction during change • 50% lower resistance and turnover • More sustainable behaviour change that persists beyond formal change programmes
The evidence is clear: successful change is fundamentally a human psychological phenomenon. When we address the underlying needs for autonomy, meaning, competence, and social connection, people don’t just comply with change – they embrace it, improve it, and become advocates for future transformation.
As you plan your next change initiative, remember that the most sophisticated project plans and communication strategies won’t overcome basic psychological resistance. But when you create conditions that support human psychological needs, change adoption becomes not just possible, but inevitable.
Understanding what research shows about predicting change adoption isn’t just about improving success rates – it’s about creating more humane, engaging, and sustainable approaches to organisational transformation. And in today’s rapidly changing business environment, that might be the most important competitive advantage you can develop.
If you are looking for a way to easily track change readiness and eventual change adoption leveraging the science of what works through a digital platform, reach out and get in touch.
Performance metrics are the compass that guides change practitioners through complex transformation initiatives. Yet despite their critical importance, many organisations unknowingly employ flawed metrics that provide misleading insights and potentially sabotage their change efforts. A closer look reveals some of the danger of conventional change management performance metrics and offers a strategic approach to measurement that truly drives success.
In fact, a quick Google search revealed a list of recommended change management performance metrics. However, some of these are potentially dangerous to incorporate without a closer understanding of the type of change being implemented, the change environment, stakeholder needs and overall change approach required. Let’s go through some of these ‘hidden dangers’ in this article.
The Measurement Imperative in Change Management
Change management has long been criticised as being too “soft” to measure effectively. This perception persists despite overwhelming evidence that data-driven approaches significantly enhance change outcomes. Research consistently demonstrates that organisations measuring change management performance are more likely to meet or exceed project objectives.
The resistance to measurement often stems from change practitioners’ preference for people-focused approaches over numerical analysis. In today’s data-rich environment, where artificial intelligence and predictive analytics are reshaping business operations, change management must embrace measurement to remain relevant and demonstrate value.
Modern organisations rely on data across all functions – from finance and operations to risk management and procurement. Without data, these departments cannot function effectively or determine whether they are achieving their targets. The same principle applies to change management: effective measurement enables practitioners to track progress, identify issues early, and make informed adjustments to their strategies.
The Problem with Traditional Adoption and Usage Metrics
Adoption and usage represent the ultimate goal of any change initiative, yet this seemingly straightforward metric harbours significant complexities. Most organisations measure adoption superficially—tracking whether people are using new systems or processes without examining the quality or effectiveness of that usage.
True adoption requires achieving full benefit realisation, which depends on several interconnected outcomes:
• Accurate impact assessment that understands how change affects specific stakeholder groups • Effective engagement strategies tailored to different audiences • Continuous tracking and reinforcement mechanisms • Clear definition of required behaviours for success
Generic change approaches might achieve some adoption at best, but to get full adoption there is a series of outcomes you need to have achieved. The behaviours need to be clear, specific and actionable, yet many organisations fail to establish these precise behavioural indicators.
Furthermore, adoption measurements often ignore the temporal dimension. Early adoption rates may appear promising, but without sustained reinforcement and measurement, initial enthusiasm frequently wanes. Effective adoption metrics must track behaviour change over extended periods and identify the specific interventions needed to maintain momentum.
Employee Readiness and Engagement: Beyond Surface-Level Satisfaction
Employee readiness and engagement form the cornerstone of successful change initiatives, yet these areas suffer from widespread measurement inadequacies. Most change practitioners focus extensively on these metrics, but their approaches often lack the sophistication required for meaningful insights.
The Critical Role of Impact Assessment
Accurate impact assessment serves as the foundation for effective readiness and engagement measurement. Any inaccuracy in understanding how change affects specific stakeholder groups inevitably leads to insufficient preparation and engagement strategies. This fundamental flaw cascades through the entire change process, undermining subsequent measurement efforts.
Impact assessment requires deep analysis of how change affects different roles, departments, and individual circumstances. Generic assessments fail to capture these nuances, leading to one-size-fits-all engagement strategies that satisfy no one effectively.
Participation Versus Meaningful Involvement
Employee participation metrics suffer from significant limitations related to change type and context. The key lies in measuring relevant participation rather than absolute participation rates:
For compliance-driven changes: • Focus on communication effectiveness and readiness preparation • Track understanding levels and procedure adherence • Monitor feedback on implementation challenges
For transformational changes: • Emphasise co-creation opportunities and stakeholder input • Measure feedback integration and stakeholder influence on change design • Track collaborative problem-solving activities
Maximum participation might seem desirable, but the nature of the change determines appropriate participation levels. Significant restructuring initiatives or regulatory compliance changes naturally limit meaningful participation opportunities compared to voluntary improvement projects.
The Satisfaction Survey Trap
Employee satisfaction surveys present particular challenges for change measurement. The purpose of satisfaction surveys requires careful definition:
• Are you seeking feedback on training content quality? • Is the focus on communication channels effectiveness? • Are you measuring leadership session impact? • Do you want to assess overall transformation experience?
Without specific focus, satisfaction surveys generate ambiguous data that provides limited actionable insight. More problematically, satisfaction may not align with change necessity. Employees might express dissatisfaction with change approaches that are nonetheless essential for regulatory compliance or competitive survival. In these situations, satisfaction becomes irrelevant, and measurement should focus on understanding effectiveness and identifying improvement opportunities within necessary constraints.
Training and Communication: Moving Beyond Binary Effectiveness
Training and communication effectiveness represent the most commonly measured aspects of change management, yet this narrow focus creates dangerous blind spots. Whilst these elements are undoubtedly important delivery vehicles, they represent only partial components of comprehensive change strategies.
The Capability Development Ecosystem
Training effectiveness measurement often conflates learning with capability development. Effective capability building requires diverse interventions beyond traditional training:
• Coaching and personalised support sessions • Structured feedback mechanisms • Sandbox practice environments for skill development • Team discussions and peer learning opportunities • Mentoring relationships and knowledge transfer
Modern capability development leverages technology-enhanced approaches that traditional training metrics fail to capture:
• Gamified content delivery and interactive learning modules • Micro-learning sequences and just-in-time training • Multimedia integration with videos, simulations, and virtual reality • Avatar-based instruction and AI-powered tutoring systems • Adaptive learning pathways that personalise content delivery
Measuring effectiveness in these environments requires sophisticated metrics that track engagement, retention, application, and long-term behaviour change across multiple learning modalities.
Communication Beyond Hit Rates
Communication effectiveness measurement typically focuses on reach metrics—how many people viewed content or attended sessions. These “hit rate” measurements provide limited insight into actual communication effectiveness, which depends on:
• Comprehension levels and message clarity • Information retention and recall accuracy • Perceived relevance to individual roles • Action generation and behaviour change
Advanced communication measurement utilises sophisticated analytics available through modern platforms:
Microsoft Viva Engage and Teams Analytics: • User engagement patterns and interaction frequency • Device usage behaviours across different communication channels • Community reach statistics and network analysis • Conversation quality indicators and response rates
A/B Testing Methodologies: • Test different messages or formats with smaller audience segments • Identify the most effective approaches before broader deployment • Transform communication from educated guesswork into data-driven optimisation • Measure conversion rates and action completion across message variants
Financial Performance: Beyond Cost-Focused ROI
Financial metrics in change management suffer from fundamental conceptual limitations that undermine their utility for strategic decision-making. The predominant focus on return on investment (ROI) and cost management treats change as an expense rather than a value creation opportunity.
Traditional ROI calculations examine financial benefits of change management spending against change outcomes. Whilst this approach provides some insight, it fundamentally limits change management to a cost-minimisation function rather than recognising its potential for:
• Enhanced organisational agility and adaptability • Improved employee engagement and retention rates • Reduced future change resistance and implementation time • Accelerated innovation adoption and competitive positioning • Strengthened stakeholder relationships and trust building
More sophisticated financial measurement approaches assess change management’s contribution to organisational capability building, risk mitigation, and strategic option creation. These broader value considerations provide more accurate assessment of change management’s true organisational impact.
The Resistance Metrics Minefield
Resistance metrics represent perhaps the most problematic area in change management measurement. The conventional approach of monitoring resistance levels and aiming for minimal resistance creates dangerous dynamics that undermine change effectiveness.
Resistance monitoring often leads to labelling stakeholders as “resistant” and focusing efforts on reducing negative feedback. This approach fundamentally misunderstands resistance as a natural and potentially valuable component of change processes.
Transforming Resistance into Feedback
Rather than minimising resistance, effective change management should encourage comprehensive feedback from all stakeholder groups. The goal shifts from resistance reduction to feedback optimisation:
Feedback Quality Indicators: • Specificity of concerns raised and solutions suggested • Constructive nature of criticism and improvement ideas • Stakeholder willingness to engage in problem-solving discussions • Implementation feasibility of suggested modifications
Implementation Tracking: • Percentage of feedback items addressed in change plans • Time from feedback receipt to response or action • Stakeholder perception of influence on change processes • Communication quality regarding feedback disposition
Effective resistance can highlight legitimate concerns, identify implementation risks, and strengthen final solutions through stakeholder input. The question becomes: What specific aspects of change generate concern, and how can legitimate resistance improve change outcomes?
Compliance and Adherence: The Missing Reinforcement Link
Compliance and adherence metrics represent critical but often overlooked components of change measurement. These metrics assess how effectively employees follow new policies and procedures—the ultimate test of change success.
The challenge lies in measurement timing and responsibility allocation:
Common Gaps: • Change teams fail to design compliance measurement into their change processes • Assessment is left for post-implementation periods when project teams have moved on • Timing gaps create measurement blind spots precisely when reinforcement is most critical • Lack of clear ownership for ongoing compliance monitoring
Effective Measurement Approaches: • Digital systems providing automated compliance tracking • Leadership follow-up protocols and structured audit processes • Operational integration rather than separate evaluation activities • Real-time dashboards showing compliance trends and exceptions
The key is embedding measurement into operational processes rather than treating it as a separate evaluation activity. This integration ensures continuous monitoring and rapid identification of compliance issues before they become systemic problems.
Establishing Effective Change Management Metrics
Developing effective change management metrics requires systematic approach that addresses the limitations of traditional measurement while leveraging modern technological capabilities.
The Three-Level Performance Framework
Leading organisations utilise comprehensive measurement frameworks that address multiple performance levels simultaneously:
Change Management Performance: • Completion of change management plans and milestone delivery • Activation of core roles like sponsors and change champions • Progress against planned activities and timeline adherence • Quality of change management deliverables and stakeholder feedback
Individual Performance (using frameworks like ADKAR): • Awareness levels and understanding of change rationale • Desire for change and motivation to participate • Knowledge acquisition through training and communication • Ability to implement required behaviours and skills • Reinforcement mechanisms and behaviour sustainability
Organisational Performance: • Achievement of intended business outcomes and strategic objectives • Financial performance improvements and cost reductions • Operational efficiency gains and process improvements • Customer satisfaction improvements and market position
This approach recognises the interdependent nature of change success across organisational, individual, and change management performance dimensions.
Leveraging Modern Technology for Enhanced Measurement
Contemporary change management measurement can exploit advanced technologies that were unavailable to previous generations of practitioners:
AI-Powered Analytics: • Sentiment analysis processing large volumes of text feedback • Pattern detection identifying predictive indicators of change success • Automated insights generation from multiple data sources • Real-time risk assessment and early warning systems
Predictive Capabilities: • Forecasting change outcomes based on early indicators • Proactive intervention before problems become critical • Historical pattern analysis for correlation identification • Capacity planning and resource optimisation
Real-Time Monitoring: • Continuous dashboards and automated reporting systems • Immediate identification of emerging issues • Rapid response to developing challenges • Data-driven optimisation throughout change processes
Building Measurement Into Change Strategy
Effective change measurement requires integration into change strategy from the earliest planning stages rather than being added as an afterthought. This integration ensures measurement serves strategic purposes rather than merely satisfying reporting requirements.
Defining Success Before Beginning
Successful change measurement begins with clear definition of desired outcomes and success criteria:
Primary Sponsor Requirements: • Articulate specific, measurable objectives aligned with organisational benefits • Connect change outcomes to strategic goals and performance indicators • Define acceptable risk levels and tolerance thresholds • Establish timeline expectations and milestone definitions
Stakeholder Engagement: • Include leaders, subject matter experts, and project managers in success definition • Ensure shared understanding across all stakeholder groups • Align measurement focus on outcomes that matter to everyone • Avoid narrow technical achievements without business relevance
Selecting Appropriate Metrics for Context
Different types of change require different measurement approaches:
Regulatory Compliance Changes: • Focus on adherence rates and audit readiness • Track training completion and competency verification • Monitor risk mitigation and control effectiveness • Measure timeline compliance and regulatory approval
Cultural Transformation Initiatives: • Emphasise behaviour change and value demonstration • Track engagement levels and participation quality • Monitor leadership modelling and reinforcement • Measure employee sentiment and satisfaction trends
Technology Implementation Projects: • Focus on system usage rates and functionality adoption • Track user proficiency and support requirement reduction • Monitor performance improvements and efficiency gains • Measure integration success and data quality
Measurement complexity should align with change complexity and organisational capability. Simple changes in mature organisations might require only basic metrics, whilst complex transformations in change-inexperienced organisations demand comprehensive measurement frameworks.
Future Directions in Change Management Measurement
The future of change management measurement lies in sophisticated integration of human insight with technological capability. Several key trends are reshaping measurement approaches:
Predictive Change Management: • Historical data enables forecasting of change outcomes • Proactive optimisation of change approaches before issues arise • Real-time adjustment based on predictive indicators • Continuous learning from measurement data across initiatives
Integrated Organisational Systems: • Connection to broader business performance metrics • Direct demonstration of change impact on customer satisfaction • Integration with financial and operational reporting systems • Holistic view of organisational health and capability
Continuous Change Capability: • Measurement of organisational change capacity and resilience • Tracking of adaptation speed and learning effectiveness • Building change capability as core organisational competency • Supporting ongoing transformation rather than discrete projects
The evolution toward continuous change requires measurement systems that support ongoing transformation rather than discrete project evaluation. These systems must track organisational change capability, adaptation speed, and resilience development as essential business capabilities.
Measuring What Matters
Change management performance metrics represent both opportunity and risk for organisations pursuing transformation. Traditional measurement approaches harbour significant limitations that can mislead practitioners and undermine change success. However, sophisticated measurement systems that leverage modern technology and address these limitations can dramatically enhance change effectiveness.
The path forward requires abandoning simplistic metrics that provide false comfort in favour of comprehensive measurement frameworks that capture the complexity of organisational change. Key principles for effective measurement include:
Strategic Focus: • Serve genuine business purposes rather than administrative requirements • Enable better decisions and drive continuous improvement • Demonstrate measurable value of professional change management • Connect change outcomes to organisational success metrics
Technological Integration: • Leverage AI and machine learning for enhanced analytical precision • Utilise real-time monitoring and predictive capabilities • Integrate with broader organisational data systems • Automate routine measurement while preserving human insight
Comprehensive Approach: • Address multiple performance levels simultaneously • Balance quantitative metrics with qualitative insights • Include temporal dimensions and sustainability factors • Measure capability building alongside immediate outcomes
Most importantly, effective change measurement must serve strategic purposes rather than administrative requirements. Metrics should enable better decisions, drive continuous improvement, and demonstrate the value that professional change management brings to organisational success.
The organisations that master sophisticated change measurement will possess significant competitive advantages in an era of accelerating change. They will anticipate challenges before they emerge, optimise interventions in real-time, and build organisational capabilities that enable sustained transformation success. The question is not whether to measure change management performance, but whether to measure it effectively enough to create lasting competitive advantage.