Change saturation is the operational condition where the volume, pace and concurrency of initiatives demanded of an organisation’s workforce exceeds the capacity those teams have to absorb new ways of working. Symptoms include declining adoption rates, missed go-live milestones, rising attrition, and visible disengagement on initiatives that previously ran cleanly. It differs from change fatigue, which is the individual psychological response. Saturation is the portfolio-level structural cause. Once a business unit is saturated, even well-designed initiatives stall, because the receivers no longer have the bandwidth or psychological readiness to engage. Detection requires portfolio-level visibility, not just project-level tracking.
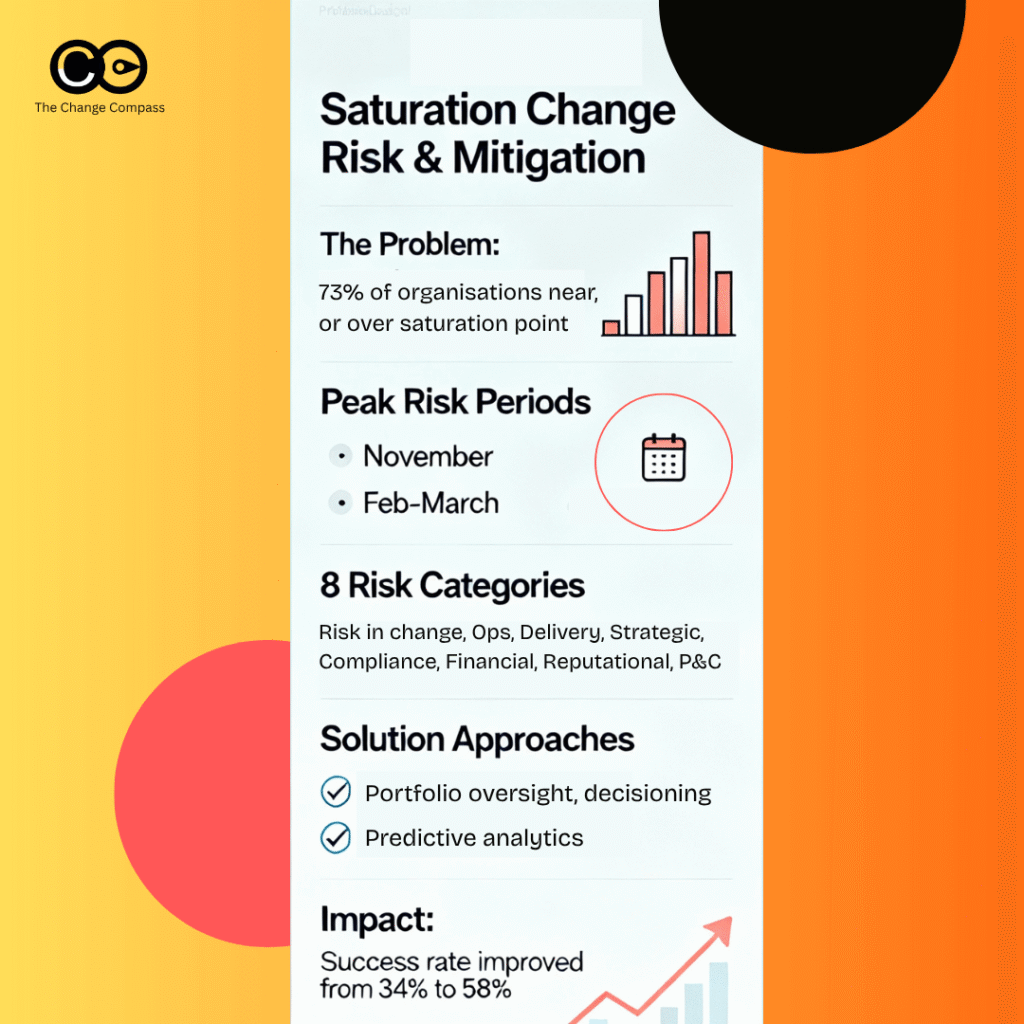
The statistics paint a sobering picture. Research indicates that 73% of organisations report being near, at or beyond their saturation point according to Prosci. For executives and boards tasked with driving transformation whilst maintaining operational excellence, understanding and managing change saturation has become a critical capability rather than an optional consideration.
The Reality of Change Saturation in Modern Organisations
Change saturation represents a fundamental mismatch between supply and demand. Organisations possess a finite change capacity determined by their culture, history, structure, and change management competency, yet they continuously face mounting pressure to transform faster, innovate quicker, and adapt more completely.
Why Change Saturation Is Accelerating
Several forces are driving the acceleration of change initiatives across industries. Digital transformation demands have compressed what were previously five-year horizons into immediate imperatives. Economic uncertainty and rapidly evolving industry conditions force companies to launch multiple strategic responses simultaneously rather than sequentially. Competition intensifies as organisations strive to maintain relevance, leading executives to greenlight numerous initiatives without fully considering cumulative impact.
Research by Mladenova highlights that multiple and overlapping change initiatives have become the norm rather than the exception, exerting additional pressure on organisations already struggling with increasing levels of unpredictability. The research found that the average organisation has undergone five major changes, creating an environment of continuous transformation that exceeds historical norms. Traditional linear change management models, designed for single initiatives, prove inadequate when organisations face simultaneous technological, structural, and cultural transformations.
Peak Saturation Periods: When Organisations Are Most Vulnerable
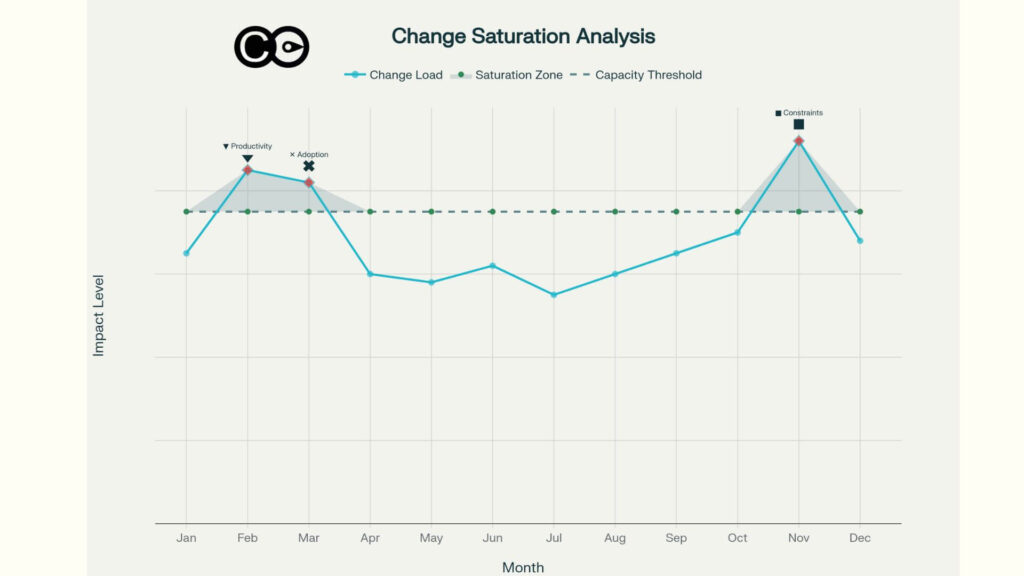
Analysis of Change Compass data reveals distinct seasonal patterns in change saturation levels. Organisations experience the most pronounced saturation during November, as teams rush to complete year-end initiatives whilst simultaneously planning for the following year’s portfolio. A secondary saturation peak emerges during the February and March period, when new strategic initiatives launch alongside ongoing projects that carried over from the previous year.
These predictable patterns create particular challenges for change practitioners and portfolio managers. November’s saturation stems from the convergence of multiple pressures, including financial year-end deadlines, budget utilisation requirements, and the desire to demonstrate progress before annual reviews. The February-March spike reflects the collision between enthusiasm for new strategic directions and the incomplete adoption of prior initiatives.
Change saturation patterns throughout the year, showing peak periods in November and February/March when change load exceeds organisational capacity
Understanding the Risks and Impacts of Change Saturation
When organisations exceed their change capacity threshold, the consequences cascade across multiple dimensions of performance. These impacts are neither abstract nor theoretical but manifest in measurable declines across operational, financial, and human capital metrics.
Productivity and Performance Impacts
The relationship between change saturation and productivity follows a predictable trajectory. Initially, as change initiatives increase, productivity may remain stable or even improve slightly. However, once saturation thresholds are crossed, productivity experiences sharp declines. Employees struggle to maintain focus across competing priorities, leading to task-switching costs that reduce overall efficiency.
Empirical research examining the phenomenon reveals that 48% of employees experiencing change fatigue report feeling more tired and stressed at work, whilst basic operational performance suffers as attention fragments across too many fronts. Research on role overload demonstrates the mechanism behind these productivity declines: a study of 250 employees found that enterprise digitalization significantly increased role overload, which in turn mediated the relationship between organizational change and employee burnout. The productivity dip manifests not just in individual output but in team coordination, decision quality, and the speed of execution across all initiatives.
Capacity Constraints and Resource Limitations
Change capacity represents a finite resource shaped by several critical factors:
Available time and attention of impacted employees
Leadership bandwidth to sponsor and support initiatives
Financial resources allocated to change activities
Technical and operational infrastructure to enable new ways of working
Organisational energy and willingness to embrace transformation
When organisations fail to account for these constraints in portfolio planning, capacity shortfalls emerge across the initiative landscape. Business functions find themselves overwhelmed with implementation demands beyond what is achievable, creating a vicious circle where incomplete adoption of one initiative reduces capacity for subsequent changes. Alarmingly, only 31% of employees report that their organisation effectively prevents them from becoming overloaded by change-related demands, indicating widespread capacity management failures.
Academic research confirms these dynamics. Studies of 313 middle managers found that organisational capacity for change mediates the influence of managerial capabilities on organisational performance, demonstrating that capacity constraints directly limit transformation outcomes regardless of individual leader quality. Research on middle managers’ role overload further reveals that workplace anxiety mediates the relationship between role overload and resistance to change, creating a reinforcing cycle that compounds capacity constraints.
Change Adoption Achievement Levels
Perhaps the most damaging consequence of saturation is the erosion of adoption quality. When organisations exceed capacity thresholds, changes simply do not stick. Employees may complete training and follow new processes initially, but without sufficient capacity to embed behaviours, they revert to previous methods once immediate oversight diminishes.
The adoption challenge intensifies when employees face simultaneous demands from multiple initiatives. From the employee perspective, the source of change matters less than the cumulative burden. Strategic transformations compete with business-as-usual improvements and regulatory compliance changes, all drawing from the same limited pool of attention and effort.
Prosci research provides compelling evidence of the adoption gap: whilst 76% of organisations that measured compliance with change met or exceeded project objectives, only 24% of those that did not measure compliance achieved their targets. This 52 percentage point difference underscores the critical link between saturation management, measurement discipline, and adoption outcomes. Studies examining change adoption demonstrate that organisations using structured portfolio approaches show significantly higher adoption rates compared to those managing initiatives in isolation, with improvements ranging from 25% to 35%.
Readiness Levels and Psychological Impact
Change saturation does not merely affect task completion but fundamentally undermines psychological readiness for transformation. When employees perceive themselves as drowning in initiatives, several concerning patterns emerge.
Change fatigue develops through constant exposure to transformation demands, manifesting as exhaustion and decreased agency. Research identifies that 54% of employees experiencing change fatigue actively look for new roles, representing a talent retention crisis that compounds capacity constraints. Among change-fatigued employees, only 43% plan to stay with their company, whereas 74% of those experiencing low fatigue intend to remain, revealing a 31 percentage point retention gap directly attributable to saturation. Employee satisfaction scores decline during sustained periods of high change load, creating resistance that undermines even well-designed initiatives.
The readiness dimension extends beyond individual psychology to encompass organisational culture and collective capacity. Organisations with limited change management competency experience saturation at lower initiative volumes compared to those with mature change capabilities. History matters as well. Teams that have experienced failed initiatives develop cynicism that reduces readiness for subsequent changes, regardless of the quality of planning.
Research on employee resistance reveals that 37% of employees resist organisational change, with the top drivers being lack of trust in leadership (41%), lack of awareness about why change is happening (39%), fear of the unknown (38%), insufficient information (28%), and changes to job roles (27%). These resistance patterns intensify under saturation conditions when communication resources are stretched thin and leadership attention is fragmented.
Comprehensive Risk Classification Framework
Change saturation creates a complex web of interconnected risks that extend across traditional risk management categories. Understanding these risk types enables organisations to develop targeted mitigation strategies and allocate appropriate governance attention.
Risk in Change
Risk in change represents threats directly attributable to the transformation initiatives themselves. These risks impact an organisation’s operations, culture, and bottom line throughout the change lifecycle. Change risk management requires a systematic framework that identifies potential obstacles early, enabling timely interventions that increase the likelihood of successful implementation.
Key change risks under saturation conditions include:
Adoption failure risk: the probability that intended changes will not be sustained beyond initial implementation
Readiness gap risk: insufficient stakeholder preparedness creating resistance and delayed adoption
Communication breakdown risk: message saturation and information overload preventing effective stakeholder engagement
Benefit realisation risk: failure to achieve anticipated returns due to incomplete implementation
Change management analytics provide data-based risk factors, including business readiness indicators and potential impact assessments, enabling risk professionals to make informed decisions about portfolio composition and sequencing.
Operational Risk
Operational risk in change saturation contexts stems from failures in internal processes, people, systems, or external events during transformation periods. The structured approach to operational risk management becomes particularly critical when organisations run multiple concurrent initiatives that strain existing control frameworks.
Saturation-amplified operational risks include:
Process integrity risk: critical processes failing or degrading as resources shift to change activities
Control effectiveness risk: required controls not operating correctly during transition periods
System stability risk: technology failures or performance degradation during implementation phases
Human error risk: mistakes increasing as employees navigate unfamiliar processes under time pressure
Data security risk: sensitive information exposed during system migrations or process changes
Operational risk management frameworks should incorporate formal change management processes to mitigate risks arising from modifications to operations, policies, procedures and controls. These frameworks must include mechanisms for preparing, approving, tracking, testing and implementing all changes to systems whilst maintaining an acceptable level of operational safety.
Research on change-oriented operational risk management in complex environments demonstrates that approximately 55% of total risk stems from human factors, followed by management, medium, and machine categories. This distribution underscores the importance of capacity-aware implementation that accounts for human limitations under saturation conditions.
Delivery Risk (Project)
Delivery risk encompasses threats to successful project execution, including timeline slippage, budget overruns, scope creep, and quality degradation. Under saturation conditions, delivery risks compound as resource contention, stakeholder fatigue, and competing priorities undermine traditional project management disciplines.
Project delivery risks intensified by saturation include:
Schedule risk: delays caused by resource availability constraints and stakeholder capacity limitations
Cost risk: budget overruns driven by extended timelines, rework, and unplanned resistance management
Scope risk: uncontrolled expansion or reduction of deliverables as stakeholders struggle to maintain focus
Quality risk: deliverable defects increasing as teams rush to meet deadlines across multiple initiatives
Resource risk: key personnel unavailable when needed due to competing project demands
Dependency risk: critical path delays when predecessor activities fail to complete due to capacity constraints
Project risk registers should identify risks that could arise during the project lifecycle through planning, design, procurement, construction, operations, maintenance and decommissioning. For each risk, teams must identify the consequences should risks eventuate, including impacts on timelines, costs and quality, as well as the likelihood of each consequence occurring.
Strategic Risk
Strategic risks emerge when saturation prevents organisations from achieving their intended strategic objectives or when transformation portfolios become misaligned with strategic priorities. These risks operate at a higher level than individual project failures, threatening competitive position and long-term viability.
Strategic risks manifesting through saturation include:
Competitive disadvantage risk: delayed capability development allowing competitors to capture market position
Strategic opportunity cost: resources locked in underperforming initiatives preventing investment in higher-value opportunities
Market timing risk: transformations completing too late to capture market windows or respond to threats
Strategic coherence risk: contradictory initiatives undermining overall strategic direction and confusing stakeholders
Research demonstrates that strategic business risks requiring different management approaches tend to be neglected compared to operational and compliance risks, despite operating in volatile, uncertain, complex and ambiguous environments where such neglect seems suboptimal. Portfolio-level risk assessment provides governance forums with visibility into where cumulative change creates strategic risk, enabling more informed decisions about sequencing, prioritisation and resource allocation.
Compliance and Regulatory Risk
Compliance risk under saturation arises when organisations struggle to maintain regulatory adherence and control effectiveness whilst implementing multiple concurrent changes. For regulated industries, this risk category carries particular severity as penalties for non-compliance can be substantial.
Saturation-driven compliance risks include:
Regulatory breach risk: failing to maintain compliance with relevant regulations during change processes
Control gap risk: required controls becoming ineffective or absent during transition periods
Audit finding risk: control weaknesses identified during periods of high change activity
Remediation timeline risk: insufficient capacity to address compliance gaps within required timeframes
Documentation risk: inadequate records of control operation and change decisions for regulatory review
In financial services specifically, operational leaders must consider regulatory risk exposure, processes remaining unaligned with regulatory requirements, remediation timelines, and forward-looking compliance risk as systems migrate and processes change. Continuous monitoring programmes that embed compliance checks at every step of delivery transform risk management from a gate to a guardrail, enabling pace whilst maintaining governance rigour.
Financial Risk
Financial risks extend beyond simple budget overruns to encompass broader economic impacts of saturation on organisational performance. These risks materialise through multiple channels, often in ways that exceed initial project cost estimates.
Financial risk categories under saturation include:
Sunk cost risk: wasted resources on failed initiatives that do not achieve adoption targets
Productivity cost risk: revenue losses from operational efficiency declines during change periods
Turnover cost risk: recruitment and training expenses driven by change-induced attrition
Benefit delay risk: postponed value realisation extending payback periods beyond planned horizons
Opportunity cost risk: capital and resources committed to underperforming changes rather than higher-return alternatives
Penalty cost risk: regulatory fines or contractual penalties from compliance failures during transformation
Reputational Risk
Reputational risk emerges when change saturation creates visible failures, stakeholder dissatisfaction, or public incidents that damage organisational standing. In an era of social media and instant communication, change-related problems can rapidly escalate into reputation crises.
Saturation-linked reputational risks include:
Customer experience risk: service disruptions or quality degradation noticed by external stakeholders
Employee reputation risk: public complaints from overworked staff or negative employer review ratings
Partner confidence risk: vendor or alliance partner concerns about organisational stability during transformation
Stakeholder trust risk: erosion of confidence among investors, regulators, or community stakeholders
Brand perception risk: market perception of organisational competence declining due to visible failures
Operational risk frameworks recognise that non-financial risks may have impacts harming the bottom line through reputation damage, making reputational risk assessment a critical component of comprehensive saturation management.
People and Culture Risk
People and culture risks represent threats to organisational capability, employee wellbeing, and cultural integrity during periods of intense transformation. These risks carry long-term consequences that extend beyond individual initiative success or failure.
Human capital risks amplified by saturation include:
Talent retention risk: loss of key personnel to competitors due to change fatigue and burnout
Capability degradation risk: skills erosion as development activities are postponed during intense change periods
Engagement risk: declining employee commitment and discretionary effort undermining performance
Health and wellbeing risk: stress-related illness and absenteeism increasing during sustained transformation
Cultural coherence risk: organisational values and norms fragmenting under contradictory change pressures
Leadership credibility risk: erosion of trust in management due to perceived mishandling of change demands
Research shows that 48% of change-fatigued employees feel more tired and stressed at work, whilst role overload significantly predicts job burnout through the mediating effect of workplace anxiety. These human impacts create reinforcing cycles that accelerate capability loss and reduce organisational resilience.
Financial and Strategic Consequences
The financial damage from poorly managed change saturation extends across six critical areas. Wasted resources and sunk project costs accumulate when initiatives fail to achieve adoption targets. Resistance-driven budget overruns occur as teams spend unplanned resources attempting to overcome saturation-induced obstacles. Operational efficiency declines as productivity dips reduce output across the business.
Revenue losses from delayed improvements compound when saturation prevents the realisation of anticipated benefits. Regulatory compliance penalties may arise if mandatory changes fail to achieve adoption within required timeframes. Supply chain relationship strain emerges when external partners experience the downstream effects of internal dysfunction.
Research quantifying these financial impacts demonstrates significant returns from effective saturation management. Studies show that organisations applying appropriate resistance management techniques increased adoption by 72% and decreased employee turnover by almost 10%, generating savings averaging USD $72,000 per company per year in training programmes alone. Conversely, 71% of employees in poorly managed change environments waste effort on the wrong activities due to leader-created change plans that are not directly relevant to their day-to-day work, representing massive productivity losses.
Perhaps most critically, organisations lose competitive position when transformation initiatives fail to deliver promised capabilities. In fast-moving markets, this strategic cost often exceeds the direct financial damage of failed projects. Research shows that successful change initiatives improve market competition by 40%, whilst companies with effective change management are 50% more likely to achieve long-term growth opportunities. The strategic opportunity cost of saturation-induced failure therefore dwarfs the immediate project-level losses.
Empirical Research on Change Saturation Levels
Academic and industry research provides robust evidence of the prevalence and impact of change saturation across different contexts and geographies. Understanding these research findings enables organisations to benchmark their own experiences and recognise early warning signs before saturation becomes critical.
Prevalence Across Industries
Prosci’s benchmarking data reveals that the percentage of organisations reaching change saturation has increased consistently over successive research cycles. This trend reflects the accelerating pace of business transformation combined with relatively static change capacity development. Research spanning multiple sectors demonstrates that saturation is not confined to specific industries but represents a universal challenge wherever organisations pursue concurrent improvement initiatives.
Analysis of transformation success rates reveals concerning patterns. The CEB Corporate Leadership Council found that whilst the average organisation has undergone five major changes, only one-third of those initiatives are successful. This 34% success rate reflects the cumulative burden of portfolio-level saturation rather than individual project deficiencies. When examined through a portfolio lens, the data suggests that many “failed” initiatives did not lack sound design or execution plans but were undermined by capacity constraints stemming from concurrent competing changes.
Impact on Change Success Probability
Research demonstrates clear correlations between saturation management practices and initiative success rates. Gartner research found that organisations applying open-source change management principles, which emphasise transparency and portfolio-level coordination, increased their probability of change success from 34% to 58%, representing a 24 percentage point improvement. This dramatic increase stems largely from better saturation management through coordinated planning and stakeholder engagement.
Prosci research provides additional granularity on the saturation-success relationship. Studies show that 76% of organisations encountering resistance managed to increase adoption by 72% when they applied appropriate resistance management techniques focused on capacity-aware implementation. This finding indicates that even when saturation creates resistance, targeted interventions can substantially improve outcomes if deployed proactively.
Measurement and Monitoring Research
Research on change measurement practices reveals significant gaps that exacerbate saturation challenges. Only 12% of organisations reported measuring change impact across their portfolio, meaning 88% lack the fundamental data needed to identify saturation before it undermines initiatives. This measurement gap prevents early intervention and forces organisations into reactive crisis management when saturation symptoms become severe.
Studies examining organisations that do implement robust measurement find substantial advantages. Research shows that organisations using continuous measurement and reassessment achieve 25% to 35% higher adoption rates than those conducting single-point readiness assessments. The improvement stems from the ability to detect emerging saturation patterns and adjust implementation pacing or resource allocation before capacity thresholds are breached.
MIT research on efficiency and adaptability challenges conventional assumptions about measurement overhead. Studies found that organisations implementing continuous change measurement with frequent assessment achieved 20-fold reductions in cycle time whilst maintaining adaptive capacity, contradicting the assumption that measurement slows transformation. This finding suggests that robust saturation monitoring actually accelerates change by preventing the costly delays associated with capacity-induced failures.
Employee Experience Research
Research examining employee perspectives provides critical insights into how saturation manifests at the individual level. Studies show that more than half of workplace leaders and staff report their organisations struggle to set well-defined measures of success for change initiatives, making progress tracking more difficult and intensifying the perception of endless transformation. This measurement ambiguity compounds saturation effects by preventing employees from recognising completion and moving forward.
Analysis of employee engagement during change reveals concerning trends. Only 37% of companies believe they are fully leveraging the employee experience during transformation efforts, meaning nearly two-thirds miss opportunities to understand and respond to saturation signals from frontline perspectives. Research demonstrates that employee engagement during change increases intent to stay by 46%, highlighting the strategic importance of saturation management for talent retention.
Studies on communication effectiveness underscore the challenge of maintaining clarity under saturation conditions. Communication leaders report that 45.6% struggle with information overload and 35.6% find it difficult to adapt to digital trends and new technologies. These challenges intensify when multiple initiatives compete for communication bandwidth, creating message saturation that parallels initiative overload.
Comparative Research on Change Approaches
Empirical research comparing different change management approaches reveals that methodology significantly influences saturation resilience. Studies examining iterative versus linear change found that 42% of iterative change projects succeeded whilst only 13% of linear ones did, representing a 29 percentage point success differential. The iterative advantage stems from continuous feedback mechanisms that enable early detection of capacity constraints and adaptive responses.
Research on change communication strategies demonstrates that companies with effective communication increase success by 38% compared to those with poor communication practices. This improvement reflects better stakeholder alignment and reduced confusion under saturation conditions when clear messaging becomes critical.
Studies examining purpose-driven change reveal that companies driven by purpose are three times more successful in fostering innovation and leading transformation compared to other organisations. These purpose-driven entities experience 30% greater innovation and 40% higher employee retention rates than industry peers, suggesting that clear strategic rationale helps buffer against saturation-induced resistance.
Measuring and Monitoring Change Saturation
Effective saturation management begins with accurate measurement. Organisations cannot manage what they do not measure, and change saturation requires portfolio-level visibility that transcends individual initiative tracking.
Establishing Baseline Capacity
The first step in saturation measurement involves determining organisational change capacity. Unlike fixed metrics, capacity varies by department, team, and even individual depending on several factors.
Capacity assessment should consider current workload, historical change absorption rates, skills and competencies of impacted groups, and leadership bandwidth to support transformation. Organisations should identify periods when multiple initiatives resulted in negative operational indicators or leader feedback about change disruption, recording these levels as exceeding the saturation point for specific departments.
A lot of change practitioners use a high level indication of High, Medium, Low in rating change impacts overall at a project level. The problem with this approach is that it is difficult for leaders to understand what this really means and how to make key decisions using such a high level indication. In this approach it is not clear exactly what role type, in what business unit, in what team, in what period of time is impacted and the types of impact. Using tools like The Change Compass, change impact can be expressed in terms of hours of impact per week, providing a quantifiable measure against which capacity thresholds can be plotted. This approach enables visualisation of saturation risk before initiatives launch rather than discovering capacity constraints during implementation.
Portfolio-Level Impact Assessment
Traditional change management often focuses on individual initiatives in isolation, missing the cumulative picture that employees actually experience. Portfolio-level assessment requires aggregating data across all concurrent changes to identify total burden on specific stakeholder groups.
Effective impact assessment frameworks should identify cumulative change impacts across projects, avoid change fatigue and capacity overload through proactive planning, and prioritise initiatives based on organisational capacity and readiness. By tracking concurrent and overlapping changes, leaders can identify where resistance may emerge and proactively address saturation before it derails initiatives.
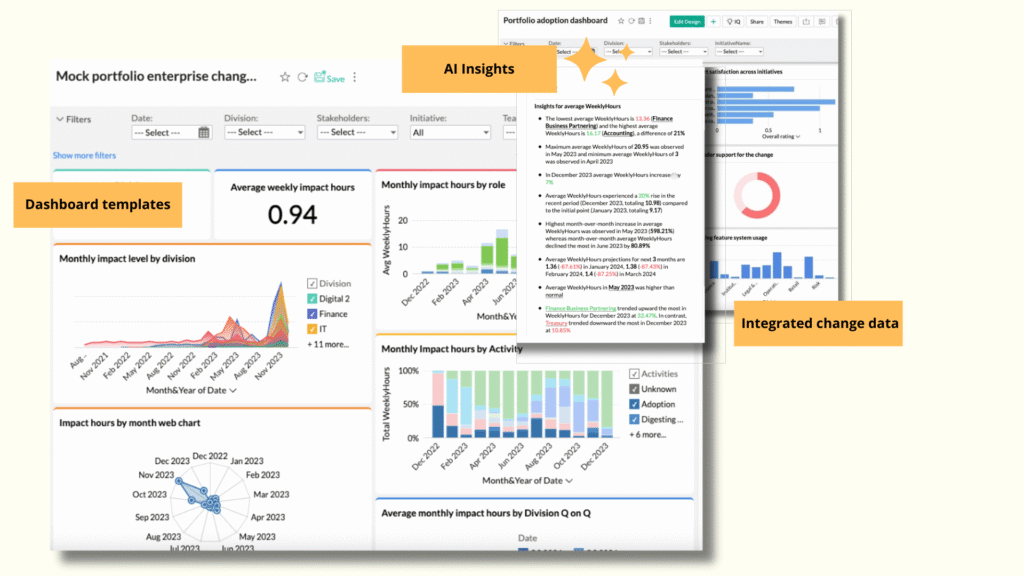
Digital platforms make portfolio management more feasible by centralising change data, prompting initiative owners to update information regularly, and enabling instant report generation that provides portfolio visibility. These systems function as change portfolio air traffic control, helping organisations safely land multiple initiatives without collisions.
Leading and Lagging Indicators
Comprehensive saturation monitoring requires both leading indicators that predict emerging problems and lagging indicators that confirm outcomes.
Leading indicators for saturation risk include the number of concurrent initiatives per stakeholder group, total planned hours of change impact per department, stakeholder sentiment scores and engagement survey results, change readiness assessment scores, and training completion rates relative to timelines. These metrics enable early intervention before saturation creates irreversible damage.
Lagging indicators confirm the impact of saturation after it occurs. These include initiative adoption rates, productivity metrics for impacted groups, employee turnover and absenteeism, project timeline slippage, and benefit realisation against targets. Whilst lagging indicators cannot prevent saturation, they validate the accuracy of capacity models and inform adjustments for future planning.
Reporting Portfolio Health and Saturation Risks to Leadership
Translating complex change data into actionable executive insights represents a critical capability for change portfolio managers. Boards and senior leaders require clear, strategic-level information that enables rapid decision-making without overwhelming detail.
Principles for Executive Reporting
Executive change management reports must transcend departmental boundaries and speak to broader organisational impact. The focus should centre on portfolio-level insights and key strategic initiatives rather than individual project minutiae. Metrics should align with strategic goals, showcasing how change initiatives contribute to overarching business objectives.
Critically, executives require understanding of totality. What do all these changes collectively mean for the organisation? What employee experiences emerge across multiple initiatives? Reporting should also illuminate how the nature and volume of changes impact overall business performance, as executives remain focused on maintaining operational success during transformation with minimum disruption.
Avoiding certain reporting traps proves equally important. Vanity metrics that showcase activity without demonstrating impact undermine credibility. Activity-focused measurements such as training sessions conducted or newsletters distributed fail to answer whether changes are actually adopted. Overly cost-centric reporting that emphasises expenditure without linking to outcomes misses the strategic value equation.
Data Visualisation Techniques for Saturation Reporting
The choice of visualisation technique significantly impacts how effectively leaders grasp saturation dynamics. Different data types and insights require specific visual approaches.
Heat Maps excel at displaying saturation distribution across departments or time periods. By colour-coding change impact levels, heat maps instantly reveal which areas face the highest saturation risk and when peak periods occur. This visualisation enables rapid identification of imbalances where some departments are overwhelmed whilst others have spare capacity.
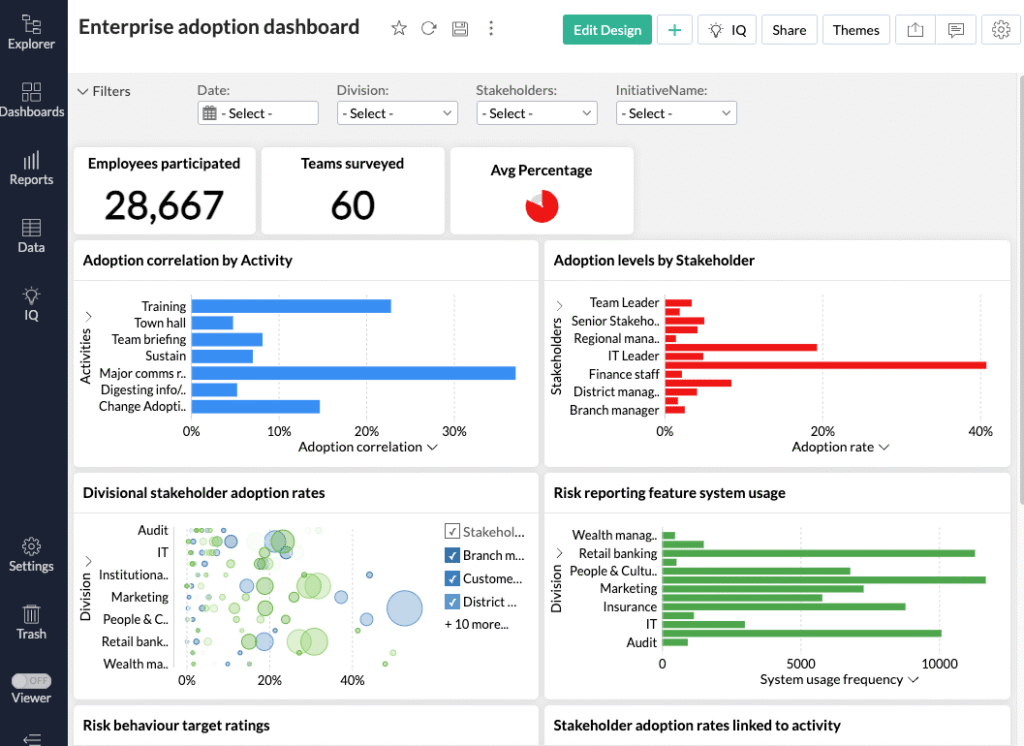
Portfolio Dashboard Tiles provide at-a-glance status indicators for key metrics. These data tiles can show current saturation levels relative to capacity, number of initiatives in various stages, adoption rates across the portfolio, and alerts for initiatives exceeding risk thresholds. Tile-based dashboards prevent information overload by summarising complex data into digestible insights.
Trend Line Charts effectively communicate changes in saturation levels over time. By plotting actual change load against capacity thresholds across months or quarters, these visualisations reveal patterns, predict future saturation points, and demonstrate the impact of portfolio decisions on capacity utilisation.
Bubble Charts can display multiple dimensions simultaneously, showing initiative size, impact level, timing, and risk status in a single view. This multidimensional perspective helps executives understand not just how many initiatives are running but their relative significance and saturation contribution.
Comparison Tables work well for presenting adoption metrics, readiness scores, or capacity utilisation across different business units. Tables enable precise numerical comparison whilst supporting quick scanning for outliers requiring attention.
Modern dashboards should incorporate a mixture of visualisation types to aid stakeholder understanding and avoid data saturation. Combining charts with key text descriptions and data tiles creates a balanced information environment that serves diverse executive preferences.
Content Types for Board-Level Reporting
Beyond visualisation techniques, the content structure of portfolio health reports should follow specific patterns that resonate with board priorities.
Strategic Alignment Summary demonstrates how the change portfolio connects to strategic objectives, showing which initiatives drive which goals and identifying gaps where strategic priorities lack supporting changes. This content type answers the fundamental question of whether the organisation is changing in the right directions.
Saturation Risk Assessment presents current capacity utilisation across the portfolio, highlights departments or periods approaching or exceeding thresholds, and identifies collision risks where multiple initiatives impact the same groups. This section should include clear risk ratings and recommended mitigation actions, with data illustrating fluctuations in the volume of change initiatives to help leaders understand whether the organisation is overburdened or maintaining appropriate flow.
Adoption Progress Tracking reports on how effectively changes are being embedded, comparing actual adoption rates against targets and identifying initiatives at risk of failing to achieve intended benefits. This content connects change activities to business outcomes, demonstrating return on transformation investment.
Capacity Outlook projects future saturation based on planned initiatives, enabling proactive decisions about sequencing, resource allocation, or portfolio adjustments. Forward-looking content prevents surprises by giving leaders visibility into emerging capacity constraints before they materialise, pinpointing potential capacity risks in various parts of the business so senior leaders can address looming challenges.
Decision Points highlight specific areas requiring executive intervention, whether approving additional resources, delaying lower-priority initiatives, or adjusting adoption expectations. Effective board reporting does not just inform but explicitly calls out what decisions leaders need to make.
Reporting Cadence and Governance
The frequency and forum for saturation reporting should match the pace of change in the organisation. Organisations managing high volumes of transformation typically require monthly portfolio reviews with leadership, using dashboards as the anchor for discussions on priorities, performance, and strategic fit.
Between formal reviews, dashboards should function as early-warning systems with automated alerts flagging delayed milestones, adoption shortfalls, or emerging saturation risks. Real-time dashboard updates eliminate the lag between problems emerging and leaders becoming aware, enabling faster response.
Portfolio governance bodies should include participation from programme management offices, senior business leaders, and portfolio change managers, with a focus on reporting change saturation indicators, risks identified, and critical decisions on sequencing, prioritisation, and capacity mitigation. This governance structure ensures saturation management receives ongoing executive attention rather than episodic crisis response.
Building Effective Reporting Capabilities
Developing robust portfolio reporting capabilities requires both technology and process. Digital platforms centralise change data, automate routine assessments, and allow fast recognition of leading and lagging indicators. However, technology serves as an enabler rather than a replacement for skilled analysis and strategic judgement.
Organisations should start with their current scale and goals, potentially beginning with structured spreadsheets before investing in dedicated portfolio management platforms. Integration with other business systems enables seamless reporting and reduces manual data entry burden.
Building team skills in data visualisation, stakeholder communication, and analytical interpretation proves equally critical. The most sophisticated dashboard delivers little value if change managers cannot translate data into compelling narratives that drive executive action.
Practical Strategies for Managing Change Saturation
Understanding saturation risks and reporting on portfolio health represents only the starting point. Organisations must implement practical strategies that prevent saturation from occurring and rapidly respond when capacity constraints emerge.
Portfolio Prioritisation and Sequencing
Not all initiatives deserve equal priority, yet organisations often treat them as if they do. Effective saturation management requires making hard choices about which changes proceed, which pause, and which are cancelled entirely.
Prioritisation frameworks should assess strategic value, urgency, resource requirements, and capacity impact of each initiative. Initiatives delivering high strategic value with manageable capacity consumption should proceed first, whilst lower-value, high-impact changes should be delayed until capacity becomes available.
Sequencing decisions must account for interdependencies between initiatives. Some changes create prerequisites for others, requiring thoughtful ordering rather than parallel implementation. Staggering rollouts for overloaded teams prevents collision risks and enables more focused adoption support.
Capacity Enhancement Approaches
Whilst capacity possesses inherent limits, organisations can expand these constraints through targeted interventions. Building change management competency across the organisation increases the efficiency with which teams absorb transformation.
Investing in leadership development ensures sponsors and managers provide consistent support that accelerates adoption. Providing temporary resources or relief for units under strain prevents burnout and maintains productivity during peak change periods.
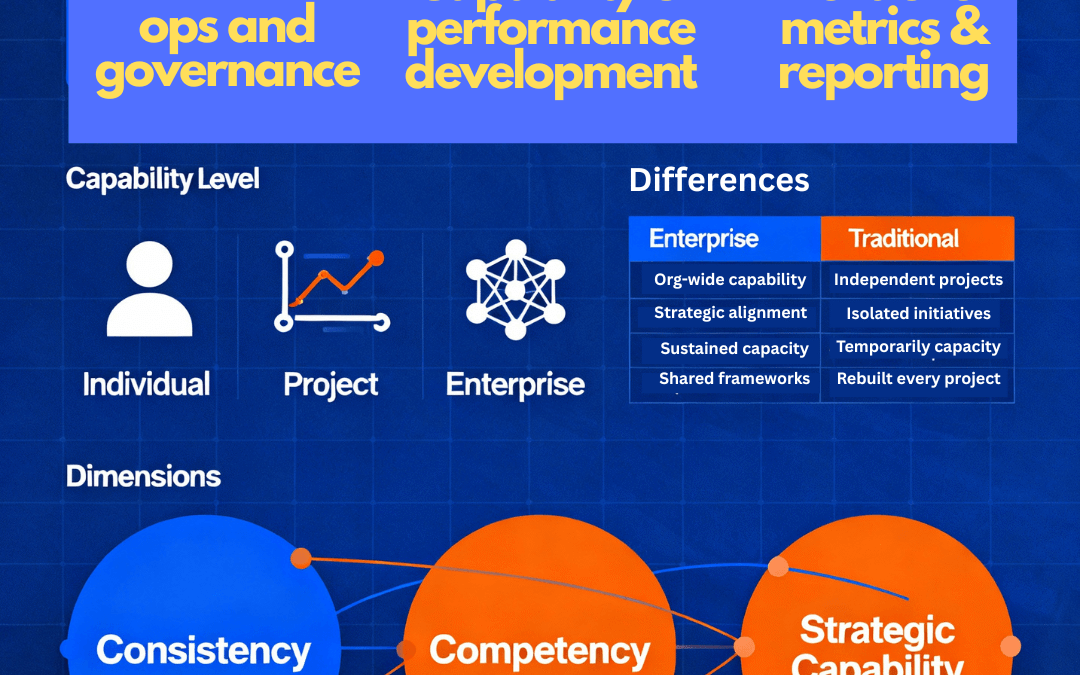
Developing enterprise change management capabilities standardises approaches, establishes governance, and creates reporting mechanisms that improve efficiency across the portfolio. Organisations with mature change capabilities experience saturation at higher initiative volumes compared to those managing change in ad hoc ways.
Intervention Triggers and Adjustment
Monitoring data should drive action when warning signs emerge. Organisations need predefined trigger points that automatically prompt intervention. For instance, when adoption metrics fall 10% below targets or stakeholder sentiment scores drop into negative ranges, predetermined responses should activate.
Potential interventions include adjusting timelines to reduce pace pressure, providing additional support resources to struggling teams, modifying adoption expectations when capacity proves insufficient, and pausing lower-priority initiatives to free capacity for critical changes.
Speed of response matters critically. The lag between identifying saturation signals and implementing adjustments determines whether interventions succeed or merely slow inevitable failure. Real-time dashboards and automated alerts compress this response time, enabling proactive adjustment.
Building Sustainable Change Capability
Beyond managing immediate saturation risks, organisations must develop sustainable approaches that prevent chronic overload. This requires shifting from reactive crisis management to proactive portfolio governance and capacity planning.
Enterprise change management represents the strategic framework for sustainable transformation. Rather than treating each initiative in isolation, enterprise approaches embed change capability throughout the organisation through standardised methodologies, portfolio-level governance, continuous stakeholder engagement, and ongoing measurement and improvement.
Organisations implementing enterprise change management establish central governance boards, standardise change processes, introduce regular engagement forums, and build continuous feedback loops. These structural elements create the foundation for managing multiple concurrent changes without overwhelming the organisation.
Success requires balancing standardisation with flexibility. Whilst consistent frameworks improve efficiency, different initiatives require tailored approaches based on context, stakeholder needs, and change characteristics. The goal is not rigid uniformity but thoughtful adaptation within coherent systems.
——— —
Frequently Asked Questions
What is change saturation and how do I know if my organisation is experiencing it?
Change saturation occurs when your organisation implements more changes than employees can effectively adopt. Signs include declining productivity, increased employee turnover (particularly the 54% of change-fatigued employees who actively seek new roles), missed project deadlines, low adoption rates despite extensive training, and feedback from managers about overwhelming change demands. Research shows 73% of organisations are near, at, or beyond their saturation point.
How much change can an organisation handle at one time?
There is no universal answer, as change capacity varies by organisation based on culture, history, change management maturity, and current operational demands. The key is measuring your specific organisation’s capacity by tracking when negative impacts emerge, then setting thresholds below those levels. Research demonstrates that organisations with mature change capabilities experience saturation at higher initiative volumes than those with limited competency.
What is the difference between change saturation and change fatigue?
Change saturation describes an organisational state where initiative volume exceeds capacity. Change fatigue represents the individual psychological response to constant change, characterised by exhaustion, cynicism, and decreased willingness to engage with transformation. Saturation often causes fatigue, with research showing that change-fatigued employees are 54% more likely to consider finding new jobs and only 43% plan to stay with their company compared to 74% of those with low fatigue.
How can I measure change saturation in my organisation?
Measure saturation by assessing the number and impact of concurrent initiatives, calculating total change burden on specific stakeholder groups using hours of impact per week, tracking adoption rates and productivity metrics, monitoring employee sentiment and engagement scores, and comparing current change load against historical capacity thresholds. The Prosci Change Saturation Model provides a structured framework for this assessment.
What should I include in a change portfolio dashboard for executives?
Executive dashboards should include strategic alignment summaries, current saturation levels relative to capacity, adoption progress across key initiatives, risk alerts for programmes exceeding thresholds, capacity outlook for planned changes, and specific decision points requiring leadership action. Research shows that mixing visualisation types (heat maps, trend lines, data tiles) aids stakeholder understanding whilst avoiding data overload.
When are organisations most vulnerable to change saturation?
Based on Change Compass data, organisations experience peak saturation during November as year-end pressures converge, and during February and March when new strategic initiatives launch alongside incomplete prior-year changes. However, individual organisations may have different patterns based on their fiscal calendars and planning cycles.
Can we increase our change capacity or are we stuck with inherent limits?
Organisations can expand change capacity through several approaches, including building change management competency across the workforce, developing leadership capabilities in sponsorship and support, investing in tools and processes that improve efficiency, creating enterprise change management frameworks, and learning from previous initiatives to improve effectiveness. Research demonstrates that organisations applying appropriate resistance management techniques increased adoption by 72% and reduced turnover by almost 10%.
What is the first step in preventing change saturation?
Begin by establishing portfolio-level visibility of all current and planned initiatives. Research shows only 12% of organisations measure change impact across their portfolio, meaning 88% lack fundamental data to identify saturation risks. Without understanding the complete change landscape, you cannot identify saturation risks or make informed prioritisation decisions. Map all changes affecting each employee group to reveal overlaps and cumulative burden.
How do risk professionals classify change-related risks?
Risk professionals classify change-related risks across multiple dimensions: Risk in Change (adoption failure, readiness gaps, benefit realisation), Operational Risk (process integrity, control effectiveness, system stability), Delivery Risk (schedule, cost, scope, quality), Strategic Risk (competitive disadvantage, misalignment), Compliance Risk (regulatory breaches, control gaps), Financial Risk (sunk costs, productivity losses), Reputational Risk (stakeholder dissatisfaction), and People Risk (talent retention, burnout, cultural fragmentation). Each category requires specific mitigation strategies and governance attention to manage effectively under saturation conditions.
Measuring change saturation effectively requires moving beyond gut feel to structured, data-driven assessment. Use this practical recipe to measure change saturation using The Change Compass, including step-by-step analysis and formulating recommendations your stakeholders can act on immediately.
Change management has long operated on assumptions. Traditional linear models as a part of a change management process were built on the premise that if you follow the steps correctly, organisational transformation will succeed. But in recent years, large-scale empirical research has provided something far more valuable than theory: hard evidence that challenges this assumption.
The data is unambiguous. Organisations using iterative, feedback-driven change approaches achieve dramatically higher success rates than those using linear, static methodologies. This isn’t a matter of opinion or preference. It’s quantifiable. And when measuring change management effectiveness and success metrics, the difference is transformational.
The Scale of the Difference: What the Numbers Actually Show
When the Standish Group analysed thousands of project outcomes across 2013-2020, they found something remarkable about change management success. Organisations using Agile (iterative) methodologies succeeded at a 42% rate, compared to just 13% for Waterfall (linear) approaches. That’s not a marginal improvement. That’s a 3.2-fold increase in success likelihood—a critical finding for anyone measuring change management success.
The implications are staggering for change management performance metrics. Failed projects? Agile projects fail at 11%. Linear projects fail at 59% – more than five times higher. These aren’t theoretical predictions. These are outcomes from thousands of real projects across multiple industries and organisational types.
Independent research from Ambysoft’s 2013 Project Success Rates Survey confirmed this change management effectiveness pattern. Agile methodologies achieved a 64% success rate versus 49% for Waterfall – a consistent 15-percentage-point advantage when measuring change management results.
When you aggregate data at this scale, random noise and one-off circumstances wash out. What remains is signal. And the signal is clear: iterative change management approaches beat linear ones by a substantial margin. For organisations seeking to improve change management success metrics, this empirical evidence on change management effectiveness is definitive.
The Serrador & Pinto Landmark Study: Quantifying Why Iterative, Agile Change Management Works
The most comprehensive empirical analysis of change management effectiveness comes from a 2015 study by Pedro Serrador and Jeffrey Pinto, published in the International Journal of Project Management. This research examined 1,002 projects across multiple industries and countries – representing one of the largest field studies directly comparing linear and iterative change management methodologies.
The study measured change success on two dimensions that matter for change management success metrics: efficiency (meeting cost, time, and scope targets) and stakeholder satisfaction (meeting broader organisational goals).
The findings were unequivocal. Agile change management approaches showed statistically significant positive impact on both efficiency and stakeholder satisfaction. But the really important finding came from examining the relationship between degree of Agile implementation and success. There was a positive correlation: the more an organisation embraced iterative change practices, the higher the change success rate.
This is crucial because it means the difference isn’t philosophical – it’s not that iterative practitioners are simply more conscientious. The degree of iteration itself drives change management success. More iteration correlates with better outcomes. For those developing a change management strategy template or measuring change management effectiveness, this empirical relationship is essential.
One nuance from the study deserves particular attention: the research found no significant difference in upfront planning effort between Agile and linear approaches. Both require planning. The critical distinction lies in what happens next. In linear change management processes, planning is front-loaded, then execution follows. In iterative change management approaches, planning continues throughout. Planning isn’t abandoned; it’s distributed. This finding is key for understanding how to design change management processes that optimise both planning and adaptability.
Speed to Delivery: The Change Management Efficiency Multiplier
Empirical research on change management effectiveness consistently demonstrates that iterative change approaches don’t just produce better outcomes – they produce them faster. For organisations measuring change management effectiveness and tracking change management KPIs, this metric is critical.
Meta-analysis of 25 peer-reviewed studies examining change management performance metrics found that iterative projects complete 28% faster than linear projects on average. Companies adopting iterative change initiatives reported a 25% reduction in time-to-market when implementing change management best practices.
This speed advantage compounds. In linear change management processes, scope changes accumulate throughout execution, then pile up at the end when they’re most expensive to address. In iterative change approaches, changes are incorporated continuously, preventing the backlog that creates schedule pressure and derails change management success.
PwC’s 2017 research on change management effectiveness found that iterative projects are 28% more successful than traditional linear approaches. But equally important: they reach viable solutions faster, meaning organisations realize benefits sooner. This directly impacts how to measure change management success and what change management analytics should track.
The Organisational Change Capability Study: Measuring Adaptive Capacity and Change Management Success
More recent empirical research by Vanhengel et al. (2025) developed and validated a measurement scale for organisational change capability across 15 components measuring change processes and content. This research examined multiple organisations implementing change management initiatives and change management best practices.
The key finding for change management success metrics: organisations with higher change capability which is characterized by multidimensional adaptability rather than rigid sequential approaches – achieved significantly higher success rates in change implementation (p < 0.05 across all components). This is critical data for how to measure change management effectiveness.
What constituted “higher change capability” in these organisations using iterative change management approaches? The research identified dimensions including stakeholder engagement, resource allocation, monitoring and feedback mechanisms, and adaptive decision-making. These are iterative, not linear, characteristics. For organisations seeking to design change management processes or develop a change management strategy template, these dimensions should be prioritized.
In other words, empirical measurement of what actually characterizes successful organisational change revealed iterative features as dominant success factors in managing change successfully.
Perhaps the single most actionable empirical finding concerning change management effectiveness concerns feedback loops. McKinsey & Company research (2020) revealed that organisations with robust feedback loops were 6.5 times more likely to experience effective change compared to those without.
That’s a staggering multiple. Not percentage-point improvements. A 6.5-fold increase in likelihood of change management success. For measuring change management effectiveness, this metric is transformational.
The mechanisms are worth examining. In a healthcare case study featured in McKinsey research on change management approaches, involving frontline staff in revising procedures through iterative feedback loops resulted in a 40% improvement in patient satisfaction scores. This wasn’t achieved through better planning before implementation. It was achieved through continuous change monitoring and feedback during implementation.
A tech startup’s case study on implementing change management best practices showed that implementing regular feedback loops and change management initiatives resulted in:
40% increase in employee engagement following implementation of monthly check-ins and anonymous suggestion boxes
Dramatically improved change adoption as teams rallied around collective goals informed by their input
Adecco’s experience with change management success demonstrated that responding to employee feedback through focus groups and integration into change management plan rollout generated a 30% increase in employee engagement and smoother transitions. These findings are central to understanding how to measure change management success.
These aren’t marginal improvements. These are transformational multipliers. And they emerge specifically from continuous feedback mechanisms, which are inherently iterative rather than linear. This is why change monitoring and change management analytics are critical to change management success metrics.
Agile Change Management Work Practices: Empirical Impact on Implementation Success
Rietze et al. (2022) empirically examined agile work practices including iterative planning, incremental delivery, and self-organized teamwork in change management contexts. The research provided specific evidence on how these iterative change management techniques improve outcomes and change management effectiveness:
Iterative planning and short work cycles (1-5 weeks) enable teams to integrate feedback constantly rather than discovering misalignment after extended delivery cycles. This is central to modern change management process design. The empirical implication: problems are caught early when they’re inexpensive to fix, rather than late when they require extensive rework. This directly impacts change management KPIs and how to measure change management success.
Incremental delivery allows experimentation and prototype refinement throughout iterations, reducing late-stage rework. This isn’t just theoretical efficiency in change management approaches. It’s measurable reduction in project churn and missed change management success metrics.
Self-organized teamwork and regular retrospectives enhance team perception of control, increasing perceived efficacy and reducing resistance. This is particularly significant in organisational change contexts, where people often experience change as something done to them. Iterative change management approaches with retrospectives create a sense of agency and participation, key factors in change management success.
Quantitative feedback mechanisms (adoption tracking dashboards, change management KPI scorecards) and demonstration meetings provide visibility of achieved performance at regular intervals, supporting continuous improvement. Critically, this constant change monitoring prevents the false confidence that plagues linear approaches—the situation where everything appears on-track until suddenly it isn’t. This is why change management analytics and change management metrics dashboards are essential for measuring change management results.
The MIT Finding: Efficiency and Adaptability Are Complements, Not Substitutes in Change Management
One of the more surprising empirical discoveries regarding change management effectiveness comes from MIT research on continuous change management processes. The study found that efficiency and adaptability are complements, not substitutes – meaning iterative change management approaches don’t sacrifice efficiency for flexibility. They achieve both simultaneously.
The quantitative finding for change management success metrics: organisations implementing continuous change with frequent measurement and monitoring actually achieved a twenty-fold reduction in manufacturing cycle time while simultaneously maintaining adaptive capacity. This finding is revolutionary for change management approaches and change management best practices.
This directly contradicts the assumption embedded in many linear change management frameworks: that you can be efficient or flexible, but not both. The empirical evidence suggests this is false. When you measure change continuously and adjust iteratively through effective change management processes, you can optimize for both efficiency and adaptability. This is transformational for anyone developing a change management strategy or designing change management methodology.
Implementation Science: The Barriers Discovery Problem in Change Management
A systematic review of implementation outcome measures (Mettert et al., 2020) identified a critical gap in how organisations measure change management effectiveness. Only four of 102 implementation outcome measures had been tested for responsiveness or sensitivity to change over time.
This represents an empirical problem for organisations measuring change management success and change management metrics. Most organisations lack validated instruments to detect whether change implementation efforts are actually working. They measure at the end, not continuously – a significant blind spot in change management analytics.
Iterative change approaches inherently solve this problem through continuous monitoring and change management KPIs. You’re not waiting until go-live to discover barriers. You’re identifying them mid-iteration when they’re addressable. This is why change monitoring and continuous change management assessment are essential to change management objectives.
The Continuous Feedback Multiplier: Large-Scale Evidence on Change Management Effectiveness
Beyond individual studies, the empirical pattern across 25+ peer-reviewed studies examining continuous feedback mechanisms and change management performance metrics is consistent: organisations that institutionalize rapid feedback loops experience 30-40% improvements in adoption rates compared to those with annual or quarterly measurement cycles. This is a critical finding for measuring change management success.
The mechanism is straightforward. In linear change management processes, you discover problems through retrospective analysis. You’ve already missed six months of opportunity to address them. In iterative change management approaches, you discover problems within weeks through continuous change monitoring.
That speed differential compounds across a full change implementation. Each barrier identified early through change management analytics prevents cascading failures downstream. This is why change management metrics dashboards and change management analytics are becoming essential to change management success.
What Empirical Research Reveals About Readiness for Change Model Assessment Failure
Remember the core problem with linear change management approaches: readiness assessments capture a moment in time, not a prediction of future readiness. Empirical research on change readiness models validates this concern and challenges traditional change management process design.
Organisational readiness is dynamic. External factors shift. Market conditions change. Competing priorities emerge. Other organisational change initiatives consume capacity. Leadership changes disrupt continuity. A readiness assessment conducted in Q1 becomes obsolete by Q3. Understanding this is central to developing effective change management strategy template and change management approach.
The empirical solution: continuous reassessment and continuous change monitoring. Organisations that track readiness throughout implementation using iterative cycles and continuous measurement show adoption rates 25-35% higher than those conducting single-point readiness assessments. This finding is transformative for organisations seeking to improve change management success metrics.
This isn’t because continuous reassessment uncovers problems. It’s because continuous change monitoring and iterative change management approaches enable early intervention when problems emerge, preventing them from cascading into adoption failure. For those managing change and seeking to measure change management effectiveness, this continuous approach is essential.
Why Linear Change Models Fail Empirically: Understanding Change Management Challenges
When you examine the empirical research across multiple dimensions, several patterns emerge about why linear change management models struggle – patterns critical for anyone learning about change management or seeking to implement change management best practices.
Static assumptions become invalid. Readiness assessed upfront changes. Capability grows or stalls. Resistance emerges or dissipates. Environment shifts. Linear change management frameworks treat these as either plan failures or execution failures, rather than recognizing them as expected aspects of complex systems. Understanding change management challenges requires this flexibility.
Barriers aren’t discovered until they’re expensive to fix. Linear approaches discover change management implementation barriers during implementation phases, when significant resources have already been committed. Iterative change management approaches discover them in earlier cycles, when adjustment is less costly. This difference is fundamental to how to measure change management success and design effective change management processes.
Feedback isn’t incorporated. Without regular feedback loops and continuous change monitoring, organisations continue executing change plans even when early data suggests misalignment. Empirically, this continuation despite misalignment is a primary driver of change management failure. This is why change management analytics and change management KPIs are so critical to change management objectives.
Problems compound unchecked. In linear change management processes, adoption problems in Phase 1 are addressed only after complete rollout. By then, they’ve cascaded, creating multiple interconnected barriers. Iterative change management approaches address problems in real-time before they compound. This directly impacts how to measure change management success.
Learning isn’t transferred. What works brilliantly in one geography or business unit fails in another. Linear change management frameworks often treat each phase as independent. Iterative change management approaches explicitly transfer learning between phases and segments through continuous change monitoring and change management analytics.
Integrating the Evidence: A Coherent Picture of Change Management Success
Across large-scale quantitative studies (Serrador & Pinto’s 1,002 projects on change management effectiveness), longitudinal surveys (Standish Group’s 15-year analysis of change management success metrics), systematic reviews (25+ studies on change management performance), and focused empirical research (Vanhengel, Rietze, McKinsey on measuring change management effectiveness), a coherent picture emerges about what drives change management success.
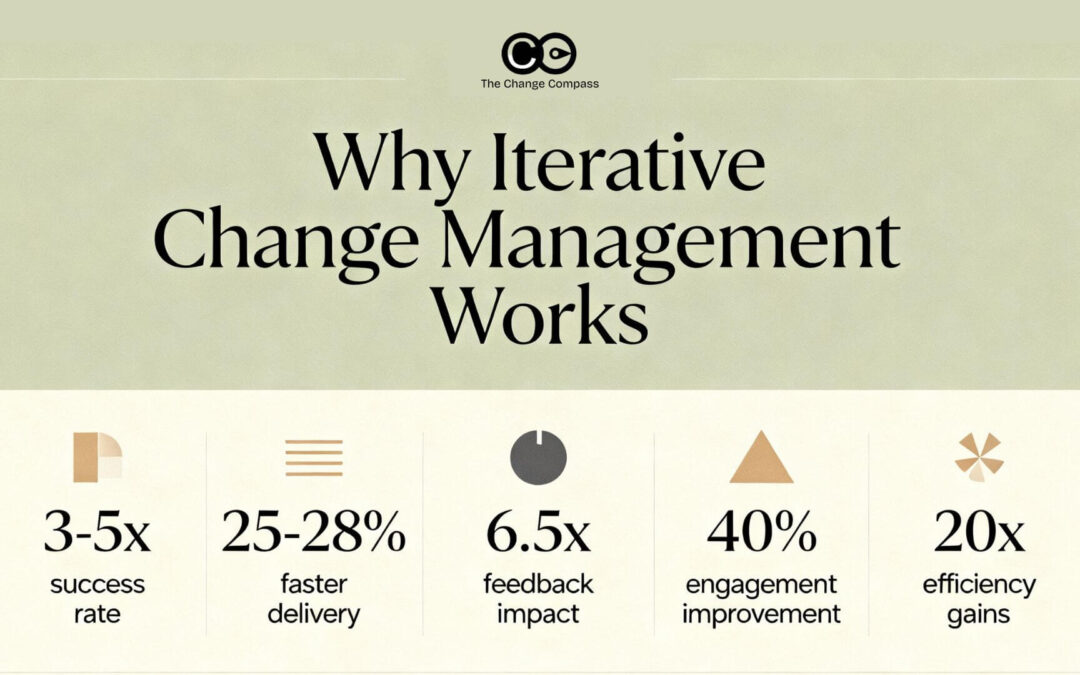
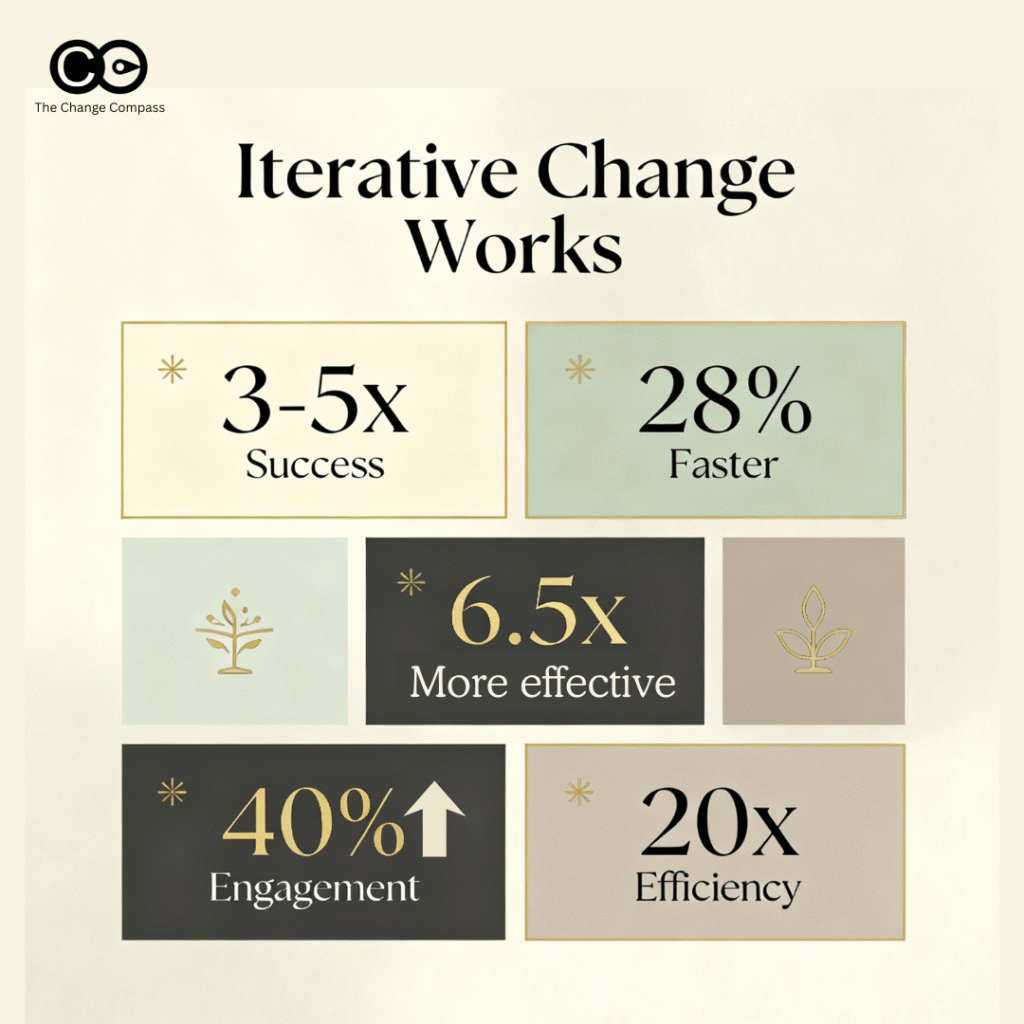
3-5x higher success rates than linear approaches in change management success metrics
25-28% faster time-to-delivery when implementing change management best practices
6.5x higher likelihood of effective change when feedback mechanisms are robust
40% improvement in engagement and adoption when continuous feedback is embedded
20x improvements in both efficiency and adaptability when done well through iterative change management processes
These aren’t marginal improvements in change management effectiveness. They’re transformational multipliers. And they’re consistent across industry, organization size, and geography. Understanding these multipliers is essential for anyone seeking to measure change management success and develop effective change management strategy.
The empirical evidence isn’t suggesting you abandon structured change management. The data shows structured approaches improve outcomes. But the specific structure that works – the change management approach that delivers results is iterative, not linear. It’s feedback-driven, not predetermined. It treats organisational change as an adaptive system that reveals itself through iteration, not a project that follows a predetermined plan.
What This Means for Change Leadership and Practitioners
The empirical findings create an imperative for change leaders and organisations pursuing change management initiatives. The evidence is sufficiently robust that continuing to use linear change management processes despite empirical evidence of inferior outcomes becomes difficult to defend, particularly when measuring change management success is critical to organisational strategy.
But moving to iterative, agile change management approaches and continuous change monitoring creates different challenges. Organisations need:
Continuous measurement capability and infrastructure for change management analytics
Comfort with planning that extends throughout implementation – a key change management principle
Willingness to adjust approaches based on emerging data and change monitoring insights
Organisational readiness to move at the required pace of iterative change management
Governance and leadership comfort with adaptive decision-making in change management strategy
Change management KPI dashboards and metrics to track change management performance
These aren’t trivial requirements. Many organisations will struggle with the shift from traditional change management frameworks to iterative approaches. But the empirical evidence is clear: the investment in this shift to modern change management best practices is repaid through dramatically improved change management success metrics and organisational outcomes.
The Future: Data at Scale and Advanced Change Management Analytics
The empirical findings discussed here are based on measurement at current scale. As organisations invest in digital platforms and AI-powered analytics for change management initiatives, the measurement fidelity will improve. Patterns invisible at current scale will become visible. Predictions of adoption risk and change management success will improve through advanced change management analytics.
But the fundamental finding won’t change. Iterative change management approaches with continuous measurement and feedback outperform linear approaches in achieving change management success. The data has already spoken. The empirical evidence on change management effectiveness is clear.
The only question is whether organisations will listen.
FAQ: Empirical Research on Iterative, Agile vs. Linear Change Management
What is the main empirical finding comparing iterative and linear change management approaches?
Large-scale empirical research, including analysis of over 1,000 projects by Serrador & Pinto (2015), demonstrates that iterative change management approaches achieve 3-5x higher success rates than linear approaches. Organisations using iterative methodologies succeed at rates of 42-64%, compared to just 13-49% for linear methods.
How much faster do iterative change management processes deliver results?
Meta-analysis of 25 peer-reviewed studies shows that iterative change approaches deliver 25-28% faster time-to-market than linear change management processes. This speed advantage compounds because iterative approaches address barriers and incorporate feedback continuously, rather than discovering problems after full rollout.
What is the impact of feedback loops on change management success?
Empirical research from McKinsey & Company found that organisations with robust feedback loops are 6.5 times more likely to experience effective change than those without. Case studies show 40% improvements in adoption metrics when continuous feedback mechanisms are embedded in change management processes.
Do organisations need different planning approaches for iterative vs. linear change management?
The Serrador & Pinto study found no significant difference in upfront planning effort between iterative and linear approaches. The critical difference is that iterative change management distributes planning throughout implementation rather than front-loading it. Both approaches require planning; they differ in when and how.
How does organisational readiness change during implementation?
Empirical research demonstrates that organisational readiness is dynamic, not static. External factors, competing priorities, and personnel changes alter readiness throughout implementation. Organisations using continuous measurement and reassessment achieve 25-35% higher adoption rates than those conducting single-point readiness assessments.
How does MIT’s research on efficiency vs. adaptability challenge traditional change management thinking?
MIT research found that efficiency and adaptability are complements, not substitutes. Organisations implementing continuous change with frequent measurement achieved 20x reductions in cycle time while maintaining adaptive capacity—contradicting the assumption that efficiency requires sacrificing flexibility in change management approaches.
What are change management KPIs and performance metrics I should track?
Critical change management metrics include adoption rates (by phase and segment), time-to-readiness, resistance indicators, feedback response time, implementation fidelity, and benefit realization. Importantly, these should be measured continuously throughout change initiatives, not just at completion. Change management analytics dashboards enable real-time tracking of these change management success metrics.
How do iterative change management approaches handle barriers and resistance?
Iterative approaches identify barriers through continuous change monitoring rather than discovering them after rollout. This enables early intervention when problems are less costly to address. Case studies show that continuous feedback integration achieves 40% higher engagement and smoother adoption compared to linear approaches.
What is organisational change capability, and why does it predict change management success?
Organisational change capability encompasses stakeholder engagement, resource allocation, feedback mechanisms, and adaptive decision-making across 15 measured dimensions. Empirical research found significant positive correlation (p < 0.05) between change capability and change implementation success, suggesting that adaptability and iteration—not rigid adherence to plans—drive organisational change outcomes.
Why do some organisations fail despite following a structured change management framework?
Empirical research shows that simply following a change management methodology (whether Kotter’s 8-step model or another framework) doesn’t guarantee success. How the methodology is used matters more than which methodology is chosen. Organisations that treat frameworks as fixed scripts fail more often than those that adapt frameworks based on emerging data and feedback.
How should organisations transition from linear to iterative change management approaches?
Transitioning requires building continuous measurement infrastructure, extending planning throughout implementation rather than front-loading it, developing comfort with adaptive decision-making, and creating governance structures that support iteration. Organisations also need change management analytics capabilities and regular feedback mechanisms to move from static, linear change management to adaptive, iterative approaches.
References: Peer-Reviewed Academic Research
Mettert, K. D., Saldana, L., Sarmiento, K., Gbettor, Y., Hamiltton, M., Perrow, P., & Stamatakis, K. A. (2020). Measuring implementation outcomes: An updated systematic review. Implementation Science, 15(1), 55.
Rietze, P., Häusle, R., Szymczak, S., & Möhrle, M. G. (2022). Relationships between agile work practices and work outcomes: A systematic review. International Journal of Project Management, 40(1), 1-15.
Serrador, P., & Pinto, J. K. (2015). Does Agile work?—A quantitative analysis of agile project success. International Journal of Project Management, 33(5), 1040-1051.
Vanhengel, R., De Vos, A., Meert, N., & Verhoeven, J. C. (2025). The organizational change capability of public organizations: Development and validation of an instrument. Journal of Organizational Change Management, 38(2), 245-267.
Large-Scale Research and Surveys
Errida, A., & Lotfi, B. (2021). The determinants of organizational change management success. International Journal of Organizational Leadership, 10(1), 37-56.
Serrador, P., Noonan, K., Pinto, J. K., & Brown, M. (2015). A quantitative analysis of agile project success rates and their impact. Project Management Institute, Research Report.
McKinsey & Company. (2020). Building the organization of the future: Organizing feedback loops for faster learning and change. McKinsey & Company.
PwC. (2017). The agile advantage: How organizations are building a competitive advantage through more agile and responsive operations.
Implementation Science References
Mettert, K. D., Saldana, L., Stamatakis, K. A., et al. (2020). Measuring implementation outcomes: An updated systematic review. Implementation Science, 15(1), 55.
Noonan, K., & Serrador, P. (2014). The agile shift: A Comparative study of incremental and waterfall approaches to project delivery. IEEE Software, 31(4), 21-28.
Complex Adaptive Systems and Organisational Change
Vanhengel et al. (2025). Organizational change capability development: Implications for change management practice. Organization Development Journal, 43(1), 22-39.
Healthcare and Case Study Evidence
Harvard Business Review. (2020). The agile approach to change management in healthcare. Harvard Business Review, 98(5), 76-84.
MIT Sloan Management Review. (2019). Continuous change management: Lessons from manufacturing excellence. MIT Sloan Management Review, 60(3), 44-52.
Enterprise change management represents a fundamental evolution beyond traditional project-based change approaches. Rather than treating change as a series of isolated initiatives, enterprise change management (ECM) establishes systematic change capability across the entire organisation. According to Prosci’s research, ECM is defined as “the systematic deployment of change management skills, tools and processes throughout an organisation”. Beyond this limited interpretation, ECM is about embedding a system of change capabilities across the organisation to achieve business results.
This strategic approach transforms how organisations build, deploy, and sustain change capability. Unlike project-level change management that focuses on specific initiatives, ECM creates an organisational competency that enables rapid, effective response to changing business conditions whilst maintaining operational performance.
The core distinction lies in scope and integration. Traditional change management applies methodologies to individual projects or departments. Enterprise change management, however, embeds change capability into the organisational fabric itself, creating what researchers describe as “a strategic capability that enables the organisation to be agile, change ready and responsive to marketplace changes”.
The three levels of enterprise change capability
ECM operates across three integrated levels, each requiring different capabilities and governance structures. Research shows that organisations achieve sustainable transformation when they address all three levels systematically.
Individual level focuses on building personal change competency throughout the workforce. This means employees at all levels develop skills in navigating uncertainty, adapting to new processes, and contributing positively to transformation efforts. The goal is creating a change-ready workforce rather than relying on external change resources for each initiative.
Project level applies structured change management to specific initiatives whilst connecting them to broader organisational capabilities. Rather than treating each project as completely distinct, mature organisations leverage shared frameworks, common language, and integrated measurement systems that compound effectiveness across initiatives.
Enterprise level represents the systematic integration of change capability into organisational strategy, culture, and operations. At this level, change management becomes a core business competency that enables strategic agility and competitive advantage.
How enterprise change management differs from traditional approaches
The differences between traditional project-based change management and enterprise approaches are substantial and measurable. Traditional change management focuses on specific projects or departments, often operating in isolation with limited coordination across initiatives. The Project Management Office (PMO) may coordinate initiatives from a project resourcing or technical release perspective, but not from a people change perspective.
Scope of influence represents the most significant difference. Project-level change management targets only those directly impacted by a specific initiative, using output-based indicators like training completion rates or survey participation. Enterprise change management, however, builds organisational capability that scales across multiple initiatives simultaneously.
Strategic integration distinguishes mature ECM approaches from tactical project applications. Research from APMG International shows that ECM aligns all change initiatives with strategic goals, ensuring consistency and reducing confusion whilst increasing efficiency. This contrasts with project-specific approaches where different initiatives may define value differently, creating inconsistent outcomes.
Sustainability and learning transfer become possible only through enterprise approaches. Traditional project-based change management typically loses capability when projects end, requiring organisations to rebuild change capacity repeatedly. ECM creates persistent organisational learning that compounds across initiatives.
The research is clear about the performance implications. According to studies of enterprise versus traditional approaches, organisations implementing ECM report significantly higher success rates because “being a model that surrounds and sustains individual projects by ‘wrapping’ them into an organisation-wide view, ECM enables that aspect of change that is sometimes missing in other approaches: growth of the change capability itself”.
The three dimensions of enterprise change management
Effective ECM requires development across three interconnected dimensions, each contributing to overall organisational change capability.
Consistency involves applying common change management methods across all projects and initiatives. This creates organisational efficiency by eliminating the need to repeatedly train people on different methodologies, using the same language to avoid confusion and more effective from a capability development perspective. More importantly, consistency enables coordination across concurrent changes, reducing conflicts and competing demands on stakeholders.
Competency focuses on building and strengthening change management skills at every organisational level. This goes beyond training programs to encompass leadership competency from supervisors to senior executives. Research shows that sustainable ECM requires “a leadership competency at all levels of the organisation”, not just designated change professionals.
Strategic capability elevates change management to a key competency within business strategy itself. At this level, change management becomes integral to how the organisation plans, makes decisions, and executes strategic initiatives. This represents the most mature form of ECM, where change capability enables competitive advantage.
Why enterprise change management matters now
Today’s business environment demands more sophisticated approaches to managing change. Research indicates that organisations face unprecedented volumes of concurrent transformation initiatives, with 73% reporting being near, at, or beyond the point of change saturation. Traditional project-by-project approaches cannot effectively manage this complexity.
The velocity of change has also increased dramatically. Markets demand faster response to competitive threats and opportunities. Organisations with mature ECM capability can “respond more quickly to market dynamics because they don’t need to build change capacity from scratch for each new initiative”. They already have the frameworks, skills, and governance structures needed for rapid, effective transformation.
The financial implications are substantial. Organisations with effective ECM report higher success rates, faster implementation timelines, and sustained adoption of new capabilities. As the Change Management Institute’s research demonstrates, building enterprise-wide change maturity enables organisations to achieve “level 3 or 4 of change management maturity, characterised by consistent approaches, embedded processes, application-focused learning, coaching support, and leadership-led change”.
Enterprise change management frameworks and processes
The Change Management Institute’s integrated approach
The Change Management Institute (CMI) has developed one of the most comprehensive frameworks for building enterprise change capability through their integrated approach to organisational change maturity. The CMI framework recognises that sustainable enterprise change management requires systematic development across three core domains that work together synergistically.
Project Change Management represents the foundation level, focusing on building consistent change management capability at the individual project level. This domain ensures organisations can effectively manage the people side of change for specific initiatives whilst building transferable skills and methodologies that scale across the enterprise.
Business Change Readiness addresses the organisational capability to anticipate, prepare for, and respond to change demands. This domain focuses on developing the cultural readiness, resource allocation, and strategic alignment necessary for sustained transformation capability.
Strategic Change Leadership represents the most mature level, where change management becomes integrated into strategic planning, decision-making, and organisational culture. At this level, change capability enables competitive advantage and strategic agility.
The CMI framework differs significantly from project-specific approaches because it explicitly builds organisational capability that persists beyond individual initiatives. Research shows that organisations achieving maturity across all three domains can respond more quickly to market dynamics because they don’t need to rebuild change capacity for each new initiative.
The CMI Change Practice Framework: a structured process approach
The Change Management Institute’s Change Practice Framework provides a practical process model for implementing enterprise change management through four integrated dimensions: Define, Analyse, Co-design, and Refine. This circular, iterative process ensures continuous improvement and adaptation whilst maintaining focus on sustainable outcomes.
Define establishes the vision for change, benefits mapping, change approach and roadmap, desired outcomes, and target timeframes. At the enterprise level, this phase ensures alignment between individual changes and broader organisational strategy whilst considering change portfolio impacts and resource allocation.
Analyse encompasses change impacts assessment, success indicators development, stakeholder identification, change maturity evaluation, change capability assessment, change readiness analysis, and determining the degree and scale of change required. This comprehensive analysis enables organisations to understand not just what needs to change, but the organisational capacity and capability required for success.
Co-design and Engage focuses on developing communication and engagement strategies, co-designed solutions, organisational redesign approaches, new ways of working, implementation planning, and risk mitigation strategies. The co-design approach ensures stakeholder involvement and ownership whilst building internal capability for future changes.
Align and Refine includes leadership coaching, tracking success criteria, real-time problem solving, testing and refining approaches, and organisational realignment activities. This phase ensures sustainable adoption whilst capturing learning that enhances future change capability.
Competency-based framework implementation
The CMI Change Manager Competency Models provide the foundation for building individual and organisational capability across three progressive levels: Foundation, Specialist, and Master. These models identify specific behavioural competencies required for success at each level, creating clear development pathways for building enterprise change capability.
Foundation level competencies focus on understanding change principles, supporting change implementation, and developing basic skills in impact assessment, communication, and project management. Foundation practitioners provide essential support whilst building capabilities that prepare them for more complex roles.
Specialist level competencies encompass strategic thinking, coaching for change, advanced influencing skills, and the ability to assess and respond to complex organisational dynamics. Specialist practitioners can lead change initiatives whilst contributing to broader organisational change capability development.
Master level competencies include advanced strategic thinking, organisational diagnosis, change leadership across multiple initiatives, and the ability to develop change capability in others. Master practitioners drive enterprise-wide change capability whilst influencing organisational culture and strategic decision-making.
The competency models address eleven core skill areas that span technical change management capabilities and interpersonal effectiveness skills. Research shows that organisations using competency-based approaches to building change capability achieve higher success rates and sustained adoption because they develop comprehensive capability rather than focusing solely on tools and processes.
Maturity-based progression framework
Enterprise change management requires systematic progression through defined maturity levels. The CMI framework aligns with broader industry recognition that organisations must develop through predictable stages to achieve sustainable change capability.
Level 1 maturity represents ad-hoc or absent change management where organisations apply change approaches reactively and inconsistently. Most organisations begin at this level, with change management applied only when projects encounter resistance or difficulties.
Level 2 maturity involves isolated project applications where change management is recognised as valuable but applied inconsistently across initiatives. Organisations at this level may achieve project-specific success but don’t build enterprise capability.
Level 3 maturity represents the beginning of enterprise approaches, with defined processes and consistent application across projects. Organisations at this level have established change management methodologies and are building internal capability systematically.
Level 4 maturity involves organisational standards where change management is embedded in project governance and business processes. Organisations achieve consistent application whilst building change leadership capability across multiple levels.
Level 5 maturity represents organisational competency where change management becomes part of organisational culture and strategic capability. At this level, change management enables sustained competitive advantage and strategic agility.
Integrating frameworks for enterprise implementation
Successful enterprise change management requires integration across multiple framework elements rather than applying individual components in isolation. The most effective implementations combine the CMI maturity progression with competency development and structured process application.
Governance integration connects change portfolio management with strategic planning cycles, ensuring change investments align with business priorities whilst maintaining organisational change capacity. This requires governance structures that can coordinate across multiple concurrent initiatives whilst building sustainable capability.
Learning integration ensures insights from individual changes enhance organisational capability rather than remaining project-specific knowledge. Mature organisations establish learning systems that capture and transfer change capability across initiatives and business units.
Cultural integration embeds change management principles into organisational culture, making change capability a shared competency rather than specialist expertise. This requires leadership development, communication strategies, and recognition systems that reinforce change-positive behaviours and capabilities.
Research demonstrates that organisations implementing integrated approaches achieve significantly higher success rates than those focusing on individual framework components. The integration enables compound benefits where each change initiative strengthens organisational capability for subsequent transformations.
Implementing enterprise change management: measurement, networks, and business integration
Successful enterprise change management requires structured measurement approaches that go beyond traditional project metrics. Unlike project-level success indicators such as training completion rates or survey scores, enterprise measurement focuses on organisational capability development, portfolio-level performance, and strategic impact on business outcomes.
Leading indicators of enterprise change capability include change readiness assessments across business units, change leadership competency scores, and business operational performance linked to change impacts. These predictive measures enable organisations to identify capability gaps before they impact transformation outcomes. Research shows that organisations tracking leading indicators achieve significantly higher success rates because they can address capability deficits proactively rather than reactively.
Portfolio-level metrics provide visibility into the collective impact of change initiatives rather than individual project success. These include change portfolio health scores, resource utilisation across concurrent changes, and stakeholder engagement effectiveness across multiple initiatives. Advanced organisations track change saturation levels, ensuring they don’t exceed organisational capacity to absorb transformation.
Business performance integration represents the most strategic measurement approach, connecting change management effectiveness directly to operational and financial outcomes. This includes metrics such as productivity maintenance during transformation, revenue impact from improved adoption rates, and competitive advantage gained through superior change capability. Academic research demonstrates that organisations integrating change metrics with business performance measurement achieve compound benefits from their transformation investments.
The key insight is that enterprise measurement requires different analytical frameworks than project-level assessment. Enterprise metrics focus on building sustainable capability rather than achieving specific deliverables, creating compound value that increases over successive transformations.
Building enterprise change champion networks
Enterprise change management success depends heavily on distributed leadership through structured change champion networks. Unlike traditional approaches that rely on designated change professionals, enterprise approaches develop change capability throughout the organisational structure, creating what researchers describe as “embedded change capacity”.
Strategic network design requires careful consideration of organisational structure, culture, and change demands. The most effective networks combine formal authority relationships with informal influence patterns, ensuring change champions have both positional credibility and peer respect across different organisational layers. Research shows that well-designed champion networks increase adoption rates by 15-25 percentage points.
Bi-directional communication channels enable both top-down strategic alignment and bottom-up insight gathering. Champion networks serve as early warning systems for emerging resistance, resource constraints, and implementation challenges. They also provide channels for sharing success stories and best practices across business units, creating organisational learning that compounds across initiatives.
Competency development within networks ensures change champions have the skills needed for success whilst building organisational capability for future changes. This includes training in change principles, coaching techniques, communication strategies, and problem-solving approaches. The Change Management Institute’s research emphasises that sustainable champion networks require structured competency development rather than relying solely on enthusiasm and goodwill.
Successful champion networks become self-reinforcing systems that strengthen with use. Each change initiative provides opportunities for champions to develop skills, build relationships, and enhance credibility, creating increasing capability for subsequent transformations.
Integrating change management with business operations
The most mature enterprise change management approaches seamlessly integrate change capability with standard business operations rather than treating change as separate organisational function. This integration creates sustainable capability whilst reducing the administrative overhead associated with parallel change management processes.
Business planning integration ensures change capacity planning becomes part of standard strategic and operational planning cycles. This includes assessing change demands during annual planning, allocating change resources based on business priorities, and sequencing initiatives to optimise organisational capacity utilisation. Research demonstrates that organisations integrating change planning with business planning achieve 20-30% better resource efficiency compared to separate planning approaches.
Performance management integration embeds change-related objectives and competencies into standard performance evaluation and development processes. This includes change leadership expectations for managers, change collaboration requirements for individual contributors, and change capability development objectives across all roles. Integration ensures change capability development receives ongoing attention rather than episodic focus during transformation initiatives.
Governance structure integration connects change portfolio management with strategic decision-making processes, ensuring change investments align with business priorities whilst maintaining organisational capacity for transformation. This requires governance bodies with authority to sequence changes, allocate resources, and escalate systemic issues that individual projects cannot resolve.
Real-world success through data-driven enterprise change management
Leading organisations are achieving measurable business value through a structured data-driven approaches to enterprise change management. The Change Compass platform exemplifies this evolution, enabling organisations to embed change management within general business management rather than treating it as separate organisational function. Case Study 4.
A major global financial services corporation transformed their approach to change management by integrating change metrics with standard business reporting. Within one year, they achieved remarkable results: leadership began prioritising change management as part of strategic oversight, business leaders increasingly requested proactive change support, and the organisation developed consistent change management practices across previously disconnected business units. Case Study 4.
The transformation occurred through strategic data integration rather than additional bureaucracy. By partnering with their Business Intelligence team and utilising Change Compass data capabilities, the corporation embedded change management insights into routine business tracking, making change visibility part of standard leadership decision-making processes.
The shift from “push” to “pull” model represents a fundamental change in how organisations approach change support. Rather than change teams offering services that business leaders may or may not utilise, leaders began actively seeking change management support as they recognised its impact on business performance. This cultural shift enhanced change management maturity across the enterprise whilst improving transformation outcomes. Case Study 2.
Enhanced decision-making through integrated reporting enabled leaders to understand the connection between change management effectiveness and business performance. By combining operational metrics with change management insights, executives could make more informed decisions about resource allocation, timing, and implementation approaches. The results included measurable improvements in project delivery timelines, reduced implementation costs, and sustained adoption of new capabilities.
Capability development through data insights became possible when organisations could track change management effectiveness over time and identify patterns that enhanced future performance. Rather than relying on subjective assessments or anecdotal evidence, mature organisations use data analytics to understand which change approaches work best in their specific context, enabling continuous improvement in change capability. Case Study 3.
The strategic value of integrated change management platforms
Modern enterprise change management requires sophisticated technology tools that can integrate with existing business systems whilst providing change-specific analytics and insights to augment what is currently missing. The Change Compass platform demonstrates how organisations can achieve enterprise change management maturity through strategic technology implementation rather than organisational restructuring.
Data integration capabilities enable organisations to connect change management metrics with business performance indicators, creating comprehensive dashboards that support strategic decision-making. This integration provides leaders with real-time visibility into change portfolio health, resource utilisation, and business impact, enabling proactive management rather than reactive problem-solving.
Predictive analytics for change planning help organisations anticipate change capacity requirements, identify potential resource conflicts, and optimise transformation sequencing. By analysing historical change data alongside business planning information, organisations can make more informed decisions about when to launch initiatives, how to allocate resources, and where to focus capability development efforts.
Competency tracking and development becomes systematic when organisations can monitor change management skills across the enterprise whilst identifying development needs and tracking progress over time. This creates targeted capability building that addresses specific organisational gaps rather than generic training approaches.
Building your enterprise change management capability
Enterprise change management represents one of the most significant opportunities for competitive advantage in today’s rapidly changing business environment. Organisations that build systematic change capability position themselves to respond more quickly to market dynamics, implement strategic initiatives more effectively, and sustain transformation outcomes over time.
The evidence is compelling: enterprise change management delivers measurable ROI through improved project success rates, reduced implementation costs, faster time-to-value, and sustained adoption of new capabilities. More importantly, organisations with mature change capability can pursue strategic opportunities that competitors cannot effectively implement.
The Change Compass platform empowers organisations to accelerate their journey toward enterprise change management maturity through data-driven insights, integrated measurement, and systematic capability development. The Change Compass enables transformation through strategic enhancement of existing processes and systems.
Leading organisations are already experiencing the benefits: enhanced leadership decision-making through integrated change and business metrics, improved resource efficiency through portfolio-level visibility, and sustained capability development through systematic tracking and analytics. These results create compound value that increases with each transformation initiative.
The opportunity for competitive advantage through superior change capability has never been greater. Market conditions demand rapid response to changing customer needs, competitive threats, and regulatory requirements. Organisations with enterprise change management capability can adapt faster, implement more effectively, and sustain transformation outcomes that create lasting competitive advantage.
Ready to transform your organisation’s change capability and start delivering measurable business value through enterprise change management? Discover how The Change Compass can help you build the data-driven change capability your organisation needs to thrive in today’s dynamic business environment.
Performance metrics are the compass that guides change practitioners through complex transformation initiatives. Yet despite their critical importance, many organisations unknowingly employ flawed metrics that provide misleading insights and potentially sabotage their change efforts. A closer look reveals some of the danger of conventional change management performance metrics and offers a strategic approach to measurement that truly drives success.
In fact, a quick Google search revealed a list of recommended change management performance metrics. However, some of these are potentially dangerous to incorporate without a closer understanding of the type of change being implemented, the change environment, stakeholder needs and overall change approach required. Let’s go through some of these ‘hidden dangers’ in this article.
The Measurement Imperative in Change Management
Change management has long been criticised as being too “soft” to measure effectively. This perception persists despite overwhelming evidence that data-driven approaches significantly enhance change outcomes. Research consistently demonstrates that organisations measuring change management performance are more likely to meet or exceed project objectives.
The resistance to measurement often stems from change practitioners’ preference for people-focused approaches over numerical analysis. In today’s data-rich environment, where artificial intelligence and predictive analytics are reshaping business operations, change management must embrace measurement to remain relevant and demonstrate value.
Modern organisations rely on data across all functions – from finance and operations to risk management and procurement. Without data, these departments cannot function effectively or determine whether they are achieving their targets. The same principle applies to change management: effective measurement enables practitioners to track progress, identify issues early, and make informed adjustments to their strategies.
The Problem with Traditional Adoption and Usage Metrics
Adoption and usage represent the ultimate goal of any change initiative, yet this seemingly straightforward metric harbours significant complexities. Most organisations measure adoption superficially—tracking whether people are using new systems or processes without examining the quality or effectiveness of that usage.
True adoption requires achieving full benefit realisation, which depends on several interconnected outcomes:
• Accurate impact assessment that understands how change affects specific stakeholder groups • Effective engagement strategies tailored to different audiences • Continuous tracking and reinforcement mechanisms • Clear definition of required behaviours for success
Generic change approaches might achieve some adoption at best, but to get full adoption there is a series of outcomes you need to have achieved. The behaviours need to be clear, specific and actionable, yet many organisations fail to establish these precise behavioural indicators.
Furthermore, adoption measurements often ignore the temporal dimension. Early adoption rates may appear promising, but without sustained reinforcement and measurement, initial enthusiasm frequently wanes. Effective adoption metrics must track behaviour change over extended periods and identify the specific interventions needed to maintain momentum.
Employee Readiness and Engagement: Beyond Surface-Level Satisfaction
Employee readiness and engagement form the cornerstone of successful change initiatives, yet these areas suffer from widespread measurement inadequacies. Most change practitioners focus extensively on these metrics, but their approaches often lack the sophistication required for meaningful insights.
The Critical Role of Impact Assessment
Accurate impact assessment serves as the foundation for effective readiness and engagement measurement. Any inaccuracy in understanding how change affects specific stakeholder groups inevitably leads to insufficient preparation and engagement strategies. This fundamental flaw cascades through the entire change process, undermining subsequent measurement efforts.
Impact assessment requires deep analysis of how change affects different roles, departments, and individual circumstances. Generic assessments fail to capture these nuances, leading to one-size-fits-all engagement strategies that satisfy no one effectively.
Participation Versus Meaningful Involvement
Employee participation metrics suffer from significant limitations related to change type and context. The key lies in measuring relevant participation rather than absolute participation rates:
For compliance-driven changes: • Focus on communication effectiveness and readiness preparation • Track understanding levels and procedure adherence • Monitor feedback on implementation challenges
For transformational changes: • Emphasise co-creation opportunities and stakeholder input • Measure feedback integration and stakeholder influence on change design • Track collaborative problem-solving activities
Maximum participation might seem desirable, but the nature of the change determines appropriate participation levels. Significant restructuring initiatives or regulatory compliance changes naturally limit meaningful participation opportunities compared to voluntary improvement projects.
The Satisfaction Survey Trap
Employee satisfaction surveys present particular challenges for change measurement. The purpose of satisfaction surveys requires careful definition:
• Are you seeking feedback on training content quality? • Is the focus on communication channels effectiveness? • Are you measuring leadership session impact? • Do you want to assess overall transformation experience?
Without specific focus, satisfaction surveys generate ambiguous data that provides limited actionable insight. More problematically, satisfaction may not align with change necessity. Employees might express dissatisfaction with change approaches that are nonetheless essential for regulatory compliance or competitive survival. In these situations, satisfaction becomes irrelevant, and measurement should focus on understanding effectiveness and identifying improvement opportunities within necessary constraints.
Training and Communication: Moving Beyond Binary Effectiveness
Training and communication effectiveness represent the most commonly measured aspects of change management, yet this narrow focus creates dangerous blind spots. Whilst these elements are undoubtedly important delivery vehicles, they represent only partial components of comprehensive change strategies.
The Capability Development Ecosystem
Training effectiveness measurement often conflates learning with capability development. Effective capability building requires diverse interventions beyond traditional training:
• Coaching and personalised support sessions • Structured feedback mechanisms • Sandbox practice environments for skill development • Team discussions and peer learning opportunities • Mentoring relationships and knowledge transfer
Modern capability development leverages technology-enhanced approaches that traditional training metrics fail to capture:
• Gamified content delivery and interactive learning modules • Micro-learning sequences and just-in-time training • Multimedia integration with videos, simulations, and virtual reality • Avatar-based instruction and AI-powered tutoring systems • Adaptive learning pathways that personalise content delivery
Measuring effectiveness in these environments requires sophisticated metrics that track engagement, retention, application, and long-term behaviour change across multiple learning modalities.
Communication Beyond Hit Rates
Communication effectiveness measurement typically focuses on reach metrics—how many people viewed content or attended sessions. These “hit rate” measurements provide limited insight into actual communication effectiveness, which depends on:
• Comprehension levels and message clarity • Information retention and recall accuracy • Perceived relevance to individual roles • Action generation and behaviour change
Advanced communication measurement utilises sophisticated analytics available through modern platforms:
Microsoft Viva Engage and Teams Analytics: • User engagement patterns and interaction frequency • Device usage behaviours across different communication channels • Community reach statistics and network analysis • Conversation quality indicators and response rates
A/B Testing Methodologies: • Test different messages or formats with smaller audience segments • Identify the most effective approaches before broader deployment • Transform communication from educated guesswork into data-driven optimisation • Measure conversion rates and action completion across message variants
Financial Performance: Beyond Cost-Focused ROI
Financial metrics in change management suffer from fundamental conceptual limitations that undermine their utility for strategic decision-making. The predominant focus on return on investment (ROI) and cost management treats change as an expense rather than a value creation opportunity.
Traditional ROI calculations examine financial benefits of change management spending against change outcomes. Whilst this approach provides some insight, it fundamentally limits change management to a cost-minimisation function rather than recognising its potential for:
• Enhanced organisational agility and adaptability • Improved employee engagement and retention rates • Reduced future change resistance and implementation time • Accelerated innovation adoption and competitive positioning • Strengthened stakeholder relationships and trust building
More sophisticated financial measurement approaches assess change management’s contribution to organisational capability building, risk mitigation, and strategic option creation. These broader value considerations provide more accurate assessment of change management’s true organisational impact.
The Resistance Metrics Minefield
Resistance metrics represent perhaps the most problematic area in change management measurement. The conventional approach of monitoring resistance levels and aiming for minimal resistance creates dangerous dynamics that undermine change effectiveness.
Resistance monitoring often leads to labelling stakeholders as “resistant” and focusing efforts on reducing negative feedback. This approach fundamentally misunderstands resistance as a natural and potentially valuable component of change processes.
Transforming Resistance into Feedback
Rather than minimising resistance, effective change management should encourage comprehensive feedback from all stakeholder groups. The goal shifts from resistance reduction to feedback optimisation:
Feedback Quality Indicators: • Specificity of concerns raised and solutions suggested • Constructive nature of criticism and improvement ideas • Stakeholder willingness to engage in problem-solving discussions • Implementation feasibility of suggested modifications
Implementation Tracking: • Percentage of feedback items addressed in change plans • Time from feedback receipt to response or action • Stakeholder perception of influence on change processes • Communication quality regarding feedback disposition
Effective resistance can highlight legitimate concerns, identify implementation risks, and strengthen final solutions through stakeholder input. The question becomes: What specific aspects of change generate concern, and how can legitimate resistance improve change outcomes?
Compliance and Adherence: The Missing Reinforcement Link
Compliance and adherence metrics represent critical but often overlooked components of change measurement. These metrics assess how effectively employees follow new policies and procedures—the ultimate test of change success.
The challenge lies in measurement timing and responsibility allocation:
Common Gaps: • Change teams fail to design compliance measurement into their change processes • Assessment is left for post-implementation periods when project teams have moved on • Timing gaps create measurement blind spots precisely when reinforcement is most critical • Lack of clear ownership for ongoing compliance monitoring
Effective Measurement Approaches: • Digital systems providing automated compliance tracking • Leadership follow-up protocols and structured audit processes • Operational integration rather than separate evaluation activities • Real-time dashboards showing compliance trends and exceptions
The key is embedding measurement into operational processes rather than treating it as a separate evaluation activity. This integration ensures continuous monitoring and rapid identification of compliance issues before they become systemic problems.
Establishing Effective Change Management Metrics
Developing effective change management metrics requires systematic approach that addresses the limitations of traditional measurement while leveraging modern technological capabilities.
The Three-Level Performance Framework
Leading organisations utilise comprehensive measurement frameworks that address multiple performance levels simultaneously:
Change Management Performance: • Completion of change management plans and milestone delivery • Activation of core roles like sponsors and change champions • Progress against planned activities and timeline adherence • Quality of change management deliverables and stakeholder feedback
Individual Performance (using frameworks like ADKAR): • Awareness levels and understanding of change rationale • Desire for change and motivation to participate • Knowledge acquisition through training and communication • Ability to implement required behaviours and skills • Reinforcement mechanisms and behaviour sustainability
Organisational Performance: • Achievement of intended business outcomes and strategic objectives • Financial performance improvements and cost reductions • Operational efficiency gains and process improvements • Customer satisfaction improvements and market position
This approach recognises the interdependent nature of change success across organisational, individual, and change management performance dimensions.
Leveraging Modern Technology for Enhanced Measurement
Contemporary change management measurement can exploit advanced technologies that were unavailable to previous generations of practitioners:
AI-Powered Analytics: • Sentiment analysis processing large volumes of text feedback • Pattern detection identifying predictive indicators of change success • Automated insights generation from multiple data sources • Real-time risk assessment and early warning systems
Predictive Capabilities: • Forecasting change outcomes based on early indicators • Proactive intervention before problems become critical • Historical pattern analysis for correlation identification • Capacity planning and resource optimisation
Real-Time Monitoring: • Continuous dashboards and automated reporting systems • Immediate identification of emerging issues • Rapid response to developing challenges • Data-driven optimisation throughout change processes
Building Measurement Into Change Strategy
Effective change measurement requires integration into change strategy from the earliest planning stages rather than being added as an afterthought. This integration ensures measurement serves strategic purposes rather than merely satisfying reporting requirements.
Defining Success Before Beginning
Successful change measurement begins with clear definition of desired outcomes and success criteria:
Primary Sponsor Requirements: • Articulate specific, measurable objectives aligned with organisational benefits • Connect change outcomes to strategic goals and performance indicators • Define acceptable risk levels and tolerance thresholds • Establish timeline expectations and milestone definitions
Stakeholder Engagement: • Include leaders, subject matter experts, and project managers in success definition • Ensure shared understanding across all stakeholder groups • Align measurement focus on outcomes that matter to everyone • Avoid narrow technical achievements without business relevance
Selecting Appropriate Metrics for Context
Different types of change require different measurement approaches:
Regulatory Compliance Changes: • Focus on adherence rates and audit readiness • Track training completion and competency verification • Monitor risk mitigation and control effectiveness • Measure timeline compliance and regulatory approval
Cultural Transformation Initiatives: • Emphasise behaviour change and value demonstration • Track engagement levels and participation quality • Monitor leadership modelling and reinforcement • Measure employee sentiment and satisfaction trends
Technology Implementation Projects: • Focus on system usage rates and functionality adoption • Track user proficiency and support requirement reduction • Monitor performance improvements and efficiency gains • Measure integration success and data quality
Measurement complexity should align with change complexity and organisational capability. Simple changes in mature organisations might require only basic metrics, whilst complex transformations in change-inexperienced organisations demand comprehensive measurement frameworks.
Future Directions in Change Management Measurement
The future of change management measurement lies in sophisticated integration of human insight with technological capability. Several key trends are reshaping measurement approaches:
Predictive Change Management: • Historical data enables forecasting of change outcomes • Proactive optimisation of change approaches before issues arise • Real-time adjustment based on predictive indicators • Continuous learning from measurement data across initiatives
Integrated Organisational Systems: • Connection to broader business performance metrics • Direct demonstration of change impact on customer satisfaction • Integration with financial and operational reporting systems • Holistic view of organisational health and capability
Continuous Change Capability: • Measurement of organisational change capacity and resilience • Tracking of adaptation speed and learning effectiveness • Building change capability as core organisational competency • Supporting ongoing transformation rather than discrete projects
The evolution toward continuous change requires measurement systems that support ongoing transformation rather than discrete project evaluation. These systems must track organisational change capability, adaptation speed, and resilience development as essential business capabilities.
Measuring What Matters
Change management performance metrics represent both opportunity and risk for organisations pursuing transformation. Traditional measurement approaches harbour significant limitations that can mislead practitioners and undermine change success. However, sophisticated measurement systems that leverage modern technology and address these limitations can dramatically enhance change effectiveness.
The path forward requires abandoning simplistic metrics that provide false comfort in favour of comprehensive measurement frameworks that capture the complexity of organisational change. Key principles for effective measurement include:
Strategic Focus: • Serve genuine business purposes rather than administrative requirements • Enable better decisions and drive continuous improvement • Demonstrate measurable value of professional change management • Connect change outcomes to organisational success metrics
Technological Integration: • Leverage AI and machine learning for enhanced analytical precision • Utilise real-time monitoring and predictive capabilities • Integrate with broader organisational data systems • Automate routine measurement while preserving human insight
Comprehensive Approach: • Address multiple performance levels simultaneously • Balance quantitative metrics with qualitative insights • Include temporal dimensions and sustainability factors • Measure capability building alongside immediate outcomes
Most importantly, effective change measurement must serve strategic purposes rather than administrative requirements. Metrics should enable better decisions, drive continuous improvement, and demonstrate the value that professional change management brings to organisational success.
The organisations that master sophisticated change measurement will possess significant competitive advantages in an era of accelerating change. They will anticipate challenges before they emerge, optimise interventions in real-time, and build organisational capabilities that enable sustained transformation success. The question is not whether to measure change management performance, but whether to measure it effectively enough to create lasting competitive advantage.
Data Foundations and the Limits of Traditional Reporting
Change and transformation leaders are increasingly tasked with supporting decision making through robust, actionable reporting. Despite the rise of specialist tools, teams still lean heavily on Excel and Power BI because of their familiarity, ease and widespread adoption. However, as the pace and scale of organisational change accelerate, these choices reveal critical limitations, especially in supporting nuanced organisational insights.
Why High, Medium, Low Reporting Falls Short
Many change teams default to tracking change impact and volume using simple “high, medium, low” traffic light metrics. While this method offers speed and clarity for basic reporting, it fails to capture context, regional nuance, or the real intensity of change across diverse teams. This coarse approach risks obscuring important details, leaving senior leaders without the depth needed to target interventions or accurately forecast operational risks.
Change practitioners are often short on time and choosing whatever is easier and faster often becomes the default choice, i.e. Excel. This short-sighted approach focuses on quickly generating an output to try and meeting stakeholder needs without thinking strategically what makes sense at an organisational level, and the value of change data to drive strategy and manage implementation risks.
Data Capture: Getting the Inputs Right
Excel’s flexibility lets teams start capturing change data quickly, but often at the expense of structure. When fields and templates vary, information can’t be standardized or consistently compared. Manual entry introduces duplication, missing values, and divergent interpretations of change categories. Power BI requires disciplined and structured underlying data to function well; without careful source management, output dashboards reflect input chaos rather than clarity. Therefore, when pairing Excel with Power BI chart generation, often a BI (business intelligence) specialist is required to help configure and structure the chart outputs in Power BI.
Tips for effective data capture:
Establish clear data templates and definitions before rolling out change tracking.
Centralize where possible to avoid data silos and redundant records.
Assign responsibilities for maintaining quality and completeness at the point of entry.
Data Cleansing and Auditing: Maintaining Integrity
Excel and Power BI users are frequently responsible for manual data validation. The process is time-consuming, highly error-prone, and often fails to catch hidden inconsistencies, especially as data volumes grow. Excel’s lack of built-in auditing makes it tough to track changes or attribute ownership, increasing risks for compliance and reliability.
Best practices for cleansing and auditing:
Automate as much validation as possible, using scripts or built-in platform features.
Use a single master source rather than local versions to simplify updates.
Develop version control and change logs to support traceability and confidence in reporting.
Visualization, Dashboarding, and Interpretation Challenges in Change Reporting
After establishing robust data foundations, the next hurdle for senior change practitioners is translating raw information into clear, actionable insights. While Excel and Power BI each provide capabilities for visualizing change data, both bring unique challenges that can limit their effectiveness in supporting strategic decision making.
Visualization and Dashboard Design
Excel’s charting options are familiar and flexible for simple visualizations, but quickly become unwieldy as complexity grows. Static pivot charts and tables, combined with manual refreshing, reduce the potential for interactive analysis. Power BI offers more engaging, dynamic visuals and interactive dashboards, yet users frequently run into formatting frustrations, such as limited customization, bulky interfaces, and difficulties aligning visuals to precise narrative goals.
Some specific visualization and dashboard challenges include:
Difficulty representing complex, multidimensional change metrics within simplistic dashboards, e.g. impact by stakeholder by location by business unit by type of change.
Limited ability in both tools to customize visual details such as consistent colour themes or layered insights without significant effort.
Dashboard performance degradation with very large or complex datasets, reducing responsiveness and usability.
Interpreting Data and Supporting Decision Making
Effective dashboards must not only display data properly but also guide users toward meaningful interpretation. Both Excel and Power BI outputs can suffer when change teams focus too heavily on volume metrics or simple aggregated scores (like high/medium/low, or counting activities such as communication sent) without contextualizing underlying drivers. This can mislead executives into overgeneralized conclusions or missed risks.
Challenges include:
Dashboards overwhelmed by numbers without narrative or highlight indicators.
Difficulty embedding qualitative insights alongside quantitative data in either tool.
Sparse real-time feedback loops; often snapshots lag behind ongoing operational realities.
Tips and Tricks for Effective Visualization and Insights
Limit dashboard visuals to key metrics that align tightly with decision priorities; avoid clutter.
Use conditional formatting or custom visuals (in Power BI) to draw attention to anomalies or trends.
Build interactive filters and drill-downs to enable users to explore data layers progressively.
Combine quantitative data with qualitative notes or commentary fields to bring context to numbers.
Schedule regular dashboard updates and ensure data pipelines feed timely, validated information.
Once the foundation of reliable data capture and cleansing is set, the next major hurdle for senior change practitioners is transforming raw change data into clear, actionable insights. Excel and Power BI both offer visualization and dashboarding capabilities, yet each presents challenges that can limit their effectiveness in supporting strategic decision-making.
Visualization and dashboard design challenges
Excel’s charting features are familiar and flexible for simple visuals but quickly become cumbersome as complexity grows. Its static pivot charts and manual refresh cycles limit interactive exploration. Power BI adds interactive and dynamic visualizations but users often encounter limitations such as restricted formatting options, bulky interfaces, and considerable effort required to tailor visuals to convey precise change narratives.
Specific challenges include:
Struggling to represent complex, multi-dimensional change metrics adequately within simplistic dashboards.
Limited ability to apply consistent colour schemes or layered insights without advanced customization.
Performance degradation in dashboards when datasets become large or complex, impacting responsiveness and user experience.
Data interpretation and decision-making support
A dashboard’s true value comes from guiding users towards meaningful interpretation rather than just presentation of numbers. Both Excel and Power BI outputs may fall short if change teams rely excessively on aggregated volume metrics or high/medium/low scales without embedding context or deeper qualitative insight. This risks executives making generalized conclusions or overlooking subtle risks.
Key challenges include:
Dashboards overrun with numbers lacking narrative or prioritized highlights.
Difficulty integrating qualitative insights alongside quantitative data within either platform.
Reporting often static or delayed, providing snapshots that lag behind real-time operational realities.
Tips and tricks for more effective visualization and insight generation
Restrict dashboards to key metrics closely aligned with leadership priorities to avoid clutter.
Leverage conditional formatting or Power BI’s custom visuals to highlight trends, outliers or emerging risks.
Incorporate interactive filters and drill-downs allowing users to progressively explore data layers themselves.
Pair quantitative dashboards with qualitative commentary fields or summary narratives to provide context.
Implement disciplined refresh schedules ensuring data pipelines are timely and validated for ongoing accuracy.
Practical advice for change teams and when to consider dedicated change management tools
Change teams vary widely in size, maturity, and complexity of their reporting needs. For less mature or smaller teams just starting out, Excel often remains the most accessible and cost-effective platform for capturing and communicating change-related data. However, as organisational demands grow in complexity and leadership expects richer insights to support timely decisions, purpose-built change management tools become increasingly valuable.
Excel as a starting point
For teams in the early stages of developing change reporting capabilities, Excel offers several advantages:
Familiar user interface widely known across organisations.
Low entry cost with flexible options for data input, simple visualizations, and ad hoc analysis.
Easy to distribute offline or via basic file-sharing when centralised platforms are unavailable.
However, small teams should be mindful of Excel’s limitations and implement these best practices:
Design standardised templates with clear field definitions to improve consistency.
Concentrate on key metrics and avoid overly complex sheets to reduce error risk.
Apply version control discipline and regular data audits to maintain data accuracy.
Plan for future scalability by documenting data sources and formulas for easier migration.
Progressing to Power BI and beyond
As reporting needs mature, teams can leverage Power BI to create more dynamic, interactive dashboards for leadership. The platform offers:
Integration with multiple data sources, enabling holistic organisational views.
Rich visualizations and real-time data refresh capabilities.
Role-based access control improving collaboration and data governance.
Yet Power BI demands some specialist skills and governance protocols:
Teams should invest in upskilling or partnering internally to build and maintain reports.
Establish rigorous data governance to avoid “data swamp” issues.
Define clear escalation paths for dashboard issues to maintain reliability and trust.
When to adopt purpose-built change management platforms
For organisations undergoing complex change or those needing to embed change reporting deeply in strategic decision making, specialist tools like The Change Compass provide clear advantages:
Tailored data models specific to change management, capturing impact, readiness, resistance, and other essential dimensions.
Automated data capture integrations from multiple enterprise systems reducing manual effort and errors.
Advanced analytics and visualizations designed to support executive decision making with predictive insights and scenario planning, leveraging AI capabilities.
Ease of creating/editing chart and dashboards to match stakeholder needs, e.g. The Change Compass has 50+ visuals to cater for the most discerning stakeholder
Collaboration features aligned to change team workflows.
Built-in auditing, compliance, and performance monitoring focused on change initiatives.
Purpose-built platforms significantly reduce the effort required to turn change data into trusted, actionable insights, freeing change leaders to focus on driving transformation rather than managing reporting challenges.
Summary advice for change teams
Stage
Recommended tools
Focus areas
Starting out
Excel
Standardise templates, focus on core metrics, enforce data discipline
Purpose-built enterprise platforms (e.g. The Change Compass)
Integrate systems, leverage tailored analytics, support operations and executive decisions
Selecting the right reporting approach depends on organisational scale, available skills, and leadership needs. Recognising when traditional tools have reached their limits and investing in specialist change management platforms ensures reporting evolves as a strategic asset rather than a bottleneck.
This staged approach supports both incremental improvements and long-term transformation in how change teams provide decision support through high-quality, actionable reporting.
Practical advice for change teams and when to consider dedicated change management tools
Change teams vary widely in size, maturity, and complexity of their reporting needs. For less mature or smaller teams just starting out, Excel often remains the most accessible and cost-effective platform for capturing and communicating change-related data. However, as organisational demands grow in complexity and leadership expects richer insights to support timely decisions, purpose-built change management tools become increasingly valuable.
Excel as a starting point
For teams in the early stages of developing change reporting capabilities, Excel offers several advantages:
Familiar user interface widely known across organisations.
Low entry cost with flexible options for data input, simple visualizations, and ad hoc analysis.
Easy to distribute offline or via basic file-sharing when centralised platforms are unavailable.
However, small teams should be mindful of Excel’s limitations and implement these best practices:
Design standardised templates with clear field definitions to improve consistency.
Concentrate on key metrics and avoid overly complex sheets to reduce error risk.
Apply version control discipline and regular data audits to maintain data accuracy.
Plan for future scalability by documenting data sources and formulas for easier migration.
Progressing to Power BI and beyond
As reporting needs mature, teams can leverage Power BI to create more dynamic, interactive dashboards for leadership. The platform offers:
Integration with multiple data sources, enabling holistic organisational views.
Rich visualizations and real-time data refresh capabilities.
Role-based access control improving collaboration and data governance.
Yet Power BI demands some specialist skills and governance protocols:
Teams should invest in upskilling or partnering internally to build and maintain reports.
Establish rigorous data governance to avoid “data swamp” issues.
Define clear escalation paths for dashboard issues to maintain reliability and trust.
When to adopt purpose-built change management platforms
For organisations with complex change environments or those needing to embed change reporting deeply in strategic decision making, specialist tools like The Change Compass provide clear advantages:
Tailored data models specific to change management, capturing impact, readiness, resistance, and other essential dimensions.
Automated data capture integrations from multiple enterprise systems reducing manual effort and errors.
Advanced analytics and visualizations designed to support executive decision making with predictive insights.
Collaboration features aligned to change team workflows.
Built-in auditing, compliance, and performance monitoring focused on change initiatives.
Purpose-built platforms significantly reduce the effort required to turn change data into trusted, actionable insights, freeing change leaders to focus on driving transformation rather than managing reporting challenges.
Selecting the right reporting approach depends on organisational scale, available skills, and leadership needs. Recognising when traditional tools have reached their limits and investing in specialist change management platforms ensures reporting evolves as a strategic asset rather than a bottleneck.
This staged approach supports both incremental improvements and long-term transformation in how change teams provide decision support through high-quality, actionable reporting. With greater maturity, change teams also start to invest in various facets of data management, from data governance, data cleansing and data insights to provide a significant lift in perceived value by senior business stakeholders.