Latest findings from academic studies reveal the real drivers behind successful organisational transformation
If you’re leading organisational change, you’ve probably wondered why some change initiatives take off while others crash and burn despite having similar resources and executive support. The good news is that decades of academic research have cracked the code on what actually drives change adoption success. And the findings might surprise you.
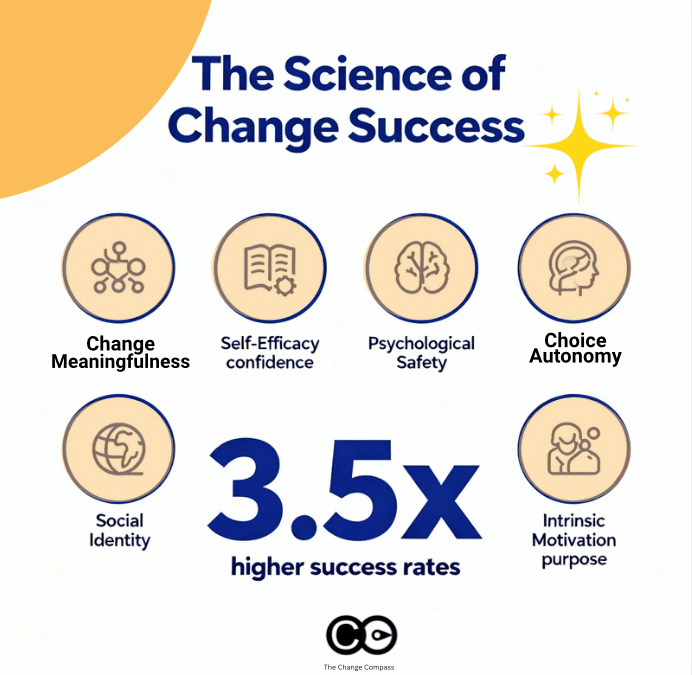
Recent meta-analyses tracking thousands of change initiatives across industries have identified six psychological factors that predict up to 88% of the variance in whether people will embrace or resist organisational change. This isn’t theoretical fluff – these are measurable, actionable insights that can transform your change management approach.
The traditional change management process isn’t enough
Most change management frameworks focus heavily on communication plans, training schedules, and governance structures. While these do matter, research shows they’re not the primary drivers of adoption success. A longitudinal study published in the Journal of Applied Social Psychology found that traditional change management activities only explained about 30% of adoption outcomes.
The real game-changers happen at the psychological level – how people feel about the change, whether they believe they can succeed with it, and if it aligns with their sense of identity and purpose.
What the research reveals about change readiness
The strongest predictor of change adoption isn’t how well you communicate the business case or how comprehensive your training programme is. According to research from Albrecht and colleagues published in Frontiers in Psychology, three psychological conditions together explain 88% of the variance in employee change engagement:
Change-related meaningfulness: Do people understand how this change helps them make a meaningful contribution? When employees see clear connections between the change and their deeper sense of purpose, intrinsic motivation kicks in. This isn’t about vague mission statements – it’s about helping people see tangible ways the change enhances their ability to do work that matters.
Change-related self-efficacy: Do people believe they can successfully navigate and master the change? Confidence in one’s ability to adapt is a powerful predictor of proactive change behaviour. Teams with higher change self-efficacy don’t just comply – they innovate and find better ways to implement changes.
Change-related psychological safety: Can people express concerns, ask questions, and make mistakes without fear? When psychological safety is high, resistance transforms into constructive dialogue. People move from defending against change to collaborating on making it work better.
These three factors work together. You can’t just focus on one and expect miraculous results. But when all three are present, the research shows dramatic improvements in both adoption speed and sustainability.
The autonomy factor that changes everything
Self-determination theory research, with effect sizes sustained over 13-month periods, reveals three autonomy-supportive conditions that dramatically improve change adoption:
• Providing clear rationale: People need to understand not just what’s changing, but why it’s necessary. This goes beyond business cases to help individuals connect the change to broader organisational or societal purposes.
• Offering choices in implementation: Even limited choice in how to implement changes preserves people’s sense of agency. Teams with input into change processes show 65% higher engagement levels.
• Acknowledging feelings and concerns: Counter-intuitively, acknowledging negative emotions about change actually facilitates acceptance. When concerns are heard and addressed, psychological reactance decreases.
This research challenges the traditional “tell and sell” approach to change management. Instead of trying to overcome resistance, successful change leaders create conditions where people can choose to embrace change because it serves their psychological needs.
Social identity: the hidden driver of change success
One of the most overlooked aspects of change management is how changes affect people’s sense of identity and group belonging. Social identity theory research identifies two distinct pathways for successful change adoption:
Identity maintenance pathway: People more readily adopt change when they can preserve core aspects of their existing identity while adapting to new circumstances. This works through continuity mechanisms – maintaining connection to valued aspects of organisational culture and relationships while evolving others.
Identity gain pathway: Alternatively, individuals embrace change when they perceive it will enhance their social identity or provide access to more valued group memberships. This operates through aspiration mechanisms – change becomes attractive when it offers opportunities for growth or alignment with desired characteristics.
The practical implication? Before launching your change initiative, map out how the change affects different groups’ identities (I,e, your change impacts). Then design your approach to either preserve valued identities or provide compelling identity gains.
Rogers’ innovation characteristics still matter
Diffusion of innovation theory, validated across thousands of studies, identifies five characteristics that predict adoption rates and collectively explain 50-90% of adoption variance:
• Relative advantage: The degree to which change is perceived as better than existing approaches • Compatibility: How well change aligns with existing values and experiences • Simplicity: The perceived ease of understanding and implementing change • Trialability: The ability to experiment before full commitment • Observability: The visibility of change results to others
These factors operate through different psychological mechanisms. Relative advantage works through comparison processes, compatibility through cognitive consonance, and observability through social proof. Smart change leaders deliberately design their initiatives to optimise these characteristics.
Measuring what matters: change adoption metrics that predict success
Traditional change management metrics often miss the mark. Tracking training completion rates or communication reach tells you about activities, not outcomes. Research-based change assessment focuses on measuring the psychological conditions that predict adoption:
Early indicators of success: • Meaningfulness ratings: Do people see how the change connects to their purpose? • Self-efficacy scores: How confident are teams about succeeding with the change? • Psychological safety levels: Can people express concerns without fear? • Autonomy support perception: Were rationale, choice, and concerns adequately addressed?
Behavioural indicators: • Proactive change behaviour: Are people finding ways to improve implementation? • Help-seeking behaviour: Are teams asking questions and sharing challenges? • Innovation around the change: Are people adapting the change to work better in their context?
These metrics give you leading indicators of adoption success, allowing you to intervene before problems become entrenched.
The intrinsic motivation advantage
Research consistently shows that intrinsic motivation produces more sustainable change adoption than external incentives. Studies on intrinsic motivation in workplace change show it operates through three fundamental psychological needs:
Autonomy: The need to feel self-directed rather than controlled. Changes that preserve or enhance autonomy see higher sustained adoption rates.
Mastery: The desire to develop competence and skill. Changes that provide growth opportunities tap into learning motivation, making adaptation engaging rather than threatening.
Purpose: The need to contribute to something meaningful. Changes that enhance sense of purpose leverage powerful intrinsic motivators.
Organisations that cultivate intrinsic motivation during change see 83% higher likelihood of innovation, improved retention, and more positive cultures that become self-reinforcing for future changes.
Loss aversion: People psychologically weight potential losses twice as heavily as equivalent gains. This means change communications focusing only on benefits may be insufficient to overcome perceived risks.
Status quo bias: The tendency to prefer current conditions even when alternatives might be superior. This operates through familiarity preferences and psychological comfort with predictability.
Confirmation bias: Selective processing of information that confirms existing beliefs while dismissing contradictory evidence. This particularly affects how people interpret change communications and early experiences.
Successful change initiatives address these barriers directly rather than trying to overpower them with rational arguments. Research shows that change programmes acknowledging and working with psychological barriers have significantly higher success rates.
• Create psychological safety through their own vulnerability and openness to feedback • Provide clear rationale that connects to employees’ values and sense of purpose • Offer genuine choices in how changes are implemented at the team level • Acknowledge the emotional impact of change rather than dismissing concerns • Model the mindset and behaviours they want to see in others
Putting it all together: a psychological systems approach
The most significant finding from this research is that these psychological mechanisms aren’t individual preferences – they represent universal human needs. When addressed systematically, they can dramatically improve change outcomes. Organisations that invest in understanding and supporting these psychological processes see 3.5 times higher success rates in change initiatives.
This research fundamentally challenges traditional change management practice. Instead of an engineering mindset focused on processes and structures, successful change requires a psychological science approach that prioritises human motivation, meaning, and social dynamics.
Practical steps for change leaders:
• Start with meaningfulness: Help people understand how the change enhances their ability to contribute meaningfully • Build confidence: Provide skills, support, and early wins to develop change self-efficacy • Create safety: Establish norms where concerns can be expressed and mistakes are learning opportunities • Preserve autonomy: Provide rationale, offer choices, and acknowledge feelings throughout the process • Consider identity: Map how the change affects group identities and design accordingly • Optimise innovation characteristics: Make changes obviously beneficial, compatible, simple, testable, and visible
The future of change management
Recent studies on the evolution of change management suggest we’re moving toward more psychologically informed approaches. Organisations that integrate these research findings into their change management frameworks are seeing:
• 40% faster adoption rates • 60% higher employee satisfaction during change • 50% lower resistance and turnover • More sustainable behaviour change that persists beyond formal change programmes
The evidence is clear: successful change is fundamentally a human psychological phenomenon. When we address the underlying needs for autonomy, meaning, competence, and social connection, people don’t just comply with change – they embrace it, improve it, and become advocates for future transformation.
As you plan your next change initiative, remember that the most sophisticated project plans and communication strategies won’t overcome basic psychological resistance. But when you create conditions that support human psychological needs, change adoption becomes not just possible, but inevitable.
Understanding what research shows about predicting change adoption isn’t just about improving success rates – it’s about creating more humane, engaging, and sustainable approaches to organisational transformation. And in today’s rapidly changing business environment, that might be the most important competitive advantage you can develop.
If you are looking for a way to easily track change readiness and eventual change adoption leveraging the science of what works through a digital platform, reach out and get in touch.
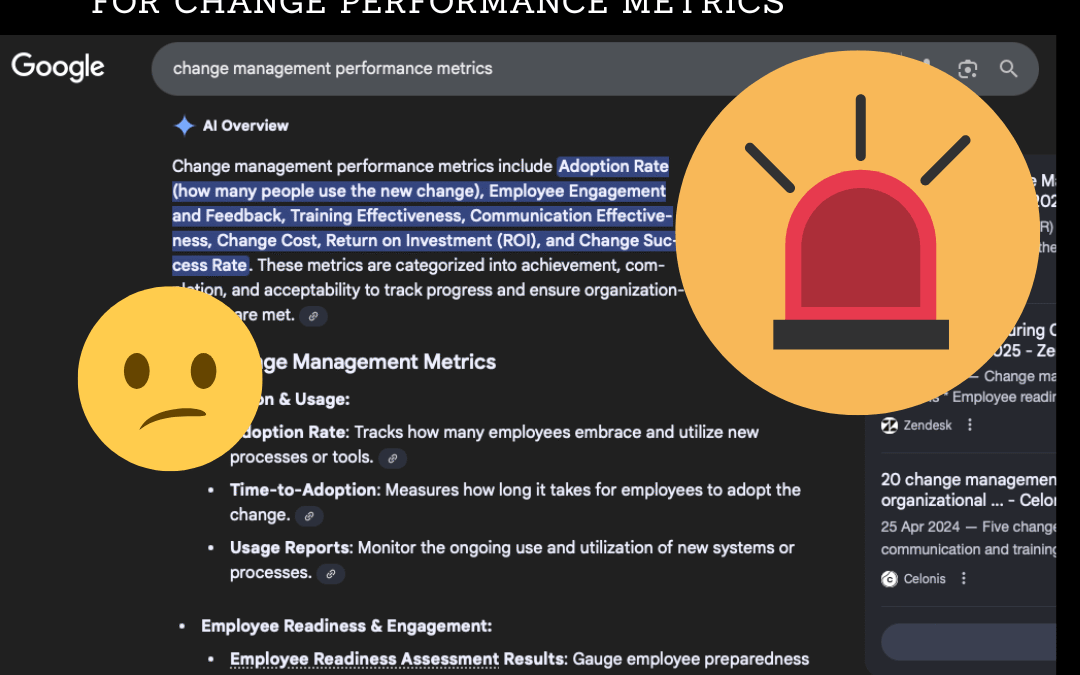
Performance metrics are the compass that guides change practitioners through complex transformation initiatives. Yet despite their critical importance, many organisations unknowingly employ flawed metrics that provide misleading insights and potentially sabotage their change efforts. A closer look reveals some of the danger of conventional change management performance metrics and offers a strategic approach to measurement that truly drives success.
In fact, a quick Google search revealed a list of recommended change management performance metrics. However, some of these are potentially dangerous to incorporate without a closer understanding of the type of change being implemented, the change environment, stakeholder needs and overall change approach required. Let’s go through some of these ‘hidden dangers’ in this article.
The Measurement Imperative in Change Management
Change management has long been criticised as being too “soft” to measure effectively. This perception persists despite overwhelming evidence that data-driven approaches significantly enhance change outcomes. Research consistently demonstrates that organisations measuring change management performance are more likely to meet or exceed project objectives.
The resistance to measurement often stems from change practitioners’ preference for people-focused approaches over numerical analysis. In today’s data-rich environment, where artificial intelligence and predictive analytics are reshaping business operations, change management must embrace measurement to remain relevant and demonstrate value.
Modern organisations rely on data across all functions – from finance and operations to risk management and procurement. Without data, these departments cannot function effectively or determine whether they are achieving their targets. The same principle applies to change management: effective measurement enables practitioners to track progress, identify issues early, and make informed adjustments to their strategies.
The Problem with Traditional Adoption and Usage Metrics
Adoption and usage represent the ultimate goal of any change initiative, yet this seemingly straightforward metric harbours significant complexities. Most organisations measure adoption superficially—tracking whether people are using new systems or processes without examining the quality or effectiveness of that usage.
True adoption requires achieving full benefit realisation, which depends on several interconnected outcomes:
• Accurate impact assessment that understands how change affects specific stakeholder groups • Effective engagement strategies tailored to different audiences • Continuous tracking and reinforcement mechanisms • Clear definition of required behaviours for success
Generic change approaches might achieve some adoption at best, but to get full adoption there is a series of outcomes you need to have achieved. The behaviours need to be clear, specific and actionable, yet many organisations fail to establish these precise behavioural indicators.
Furthermore, adoption measurements often ignore the temporal dimension. Early adoption rates may appear promising, but without sustained reinforcement and measurement, initial enthusiasm frequently wanes. Effective adoption metrics must track behaviour change over extended periods and identify the specific interventions needed to maintain momentum.
Employee Readiness and Engagement: Beyond Surface-Level Satisfaction
Employee readiness and engagement form the cornerstone of successful change initiatives, yet these areas suffer from widespread measurement inadequacies. Most change practitioners focus extensively on these metrics, but their approaches often lack the sophistication required for meaningful insights.
The Critical Role of Impact Assessment
Accurate impact assessment serves as the foundation for effective readiness and engagement measurement. Any inaccuracy in understanding how change affects specific stakeholder groups inevitably leads to insufficient preparation and engagement strategies. This fundamental flaw cascades through the entire change process, undermining subsequent measurement efforts.
Impact assessment requires deep analysis of how change affects different roles, departments, and individual circumstances. Generic assessments fail to capture these nuances, leading to one-size-fits-all engagement strategies that satisfy no one effectively.
Participation Versus Meaningful Involvement
Employee participation metrics suffer from significant limitations related to change type and context. The key lies in measuring relevant participation rather than absolute participation rates:
For compliance-driven changes: • Focus on communication effectiveness and readiness preparation • Track understanding levels and procedure adherence • Monitor feedback on implementation challenges
For transformational changes: • Emphasise co-creation opportunities and stakeholder input • Measure feedback integration and stakeholder influence on change design • Track collaborative problem-solving activities
Maximum participation might seem desirable, but the nature of the change determines appropriate participation levels. Significant restructuring initiatives or regulatory compliance changes naturally limit meaningful participation opportunities compared to voluntary improvement projects.
The Satisfaction Survey Trap
Employee satisfaction surveys present particular challenges for change measurement. The purpose of satisfaction surveys requires careful definition:
• Are you seeking feedback on training content quality? • Is the focus on communication channels effectiveness? • Are you measuring leadership session impact? • Do you want to assess overall transformation experience?
Without specific focus, satisfaction surveys generate ambiguous data that provides limited actionable insight. More problematically, satisfaction may not align with change necessity. Employees might express dissatisfaction with change approaches that are nonetheless essential for regulatory compliance or competitive survival. In these situations, satisfaction becomes irrelevant, and measurement should focus on understanding effectiveness and identifying improvement opportunities within necessary constraints.
Training and Communication: Moving Beyond Binary Effectiveness
Training and communication effectiveness represent the most commonly measured aspects of change management, yet this narrow focus creates dangerous blind spots. Whilst these elements are undoubtedly important delivery vehicles, they represent only partial components of comprehensive change strategies.
The Capability Development Ecosystem
Training effectiveness measurement often conflates learning with capability development. Effective capability building requires diverse interventions beyond traditional training:
• Coaching and personalised support sessions • Structured feedback mechanisms • Sandbox practice environments for skill development • Team discussions and peer learning opportunities • Mentoring relationships and knowledge transfer
Modern capability development leverages technology-enhanced approaches that traditional training metrics fail to capture:
• Gamified content delivery and interactive learning modules • Micro-learning sequences and just-in-time training • Multimedia integration with videos, simulations, and virtual reality • Avatar-based instruction and AI-powered tutoring systems • Adaptive learning pathways that personalise content delivery
Measuring effectiveness in these environments requires sophisticated metrics that track engagement, retention, application, and long-term behaviour change across multiple learning modalities.
Communication Beyond Hit Rates
Communication effectiveness measurement typically focuses on reach metrics—how many people viewed content or attended sessions. These “hit rate” measurements provide limited insight into actual communication effectiveness, which depends on:
• Comprehension levels and message clarity • Information retention and recall accuracy • Perceived relevance to individual roles • Action generation and behaviour change
Advanced communication measurement utilises sophisticated analytics available through modern platforms:
Microsoft Viva Engage and Teams Analytics: • User engagement patterns and interaction frequency • Device usage behaviours across different communication channels • Community reach statistics and network analysis • Conversation quality indicators and response rates
A/B Testing Methodologies: • Test different messages or formats with smaller audience segments • Identify the most effective approaches before broader deployment • Transform communication from educated guesswork into data-driven optimisation • Measure conversion rates and action completion across message variants
Financial Performance: Beyond Cost-Focused ROI
Financial metrics in change management suffer from fundamental conceptual limitations that undermine their utility for strategic decision-making. The predominant focus on return on investment (ROI) and cost management treats change as an expense rather than a value creation opportunity.
Traditional ROI calculations examine financial benefits of change management spending against change outcomes. Whilst this approach provides some insight, it fundamentally limits change management to a cost-minimisation function rather than recognising its potential for:
• Enhanced organisational agility and adaptability • Improved employee engagement and retention rates • Reduced future change resistance and implementation time • Accelerated innovation adoption and competitive positioning • Strengthened stakeholder relationships and trust building
More sophisticated financial measurement approaches assess change management’s contribution to organisational capability building, risk mitigation, and strategic option creation. These broader value considerations provide more accurate assessment of change management’s true organisational impact.
The Resistance Metrics Minefield
Resistance metrics represent perhaps the most problematic area in change management measurement. The conventional approach of monitoring resistance levels and aiming for minimal resistance creates dangerous dynamics that undermine change effectiveness.
Resistance monitoring often leads to labelling stakeholders as “resistant” and focusing efforts on reducing negative feedback. This approach fundamentally misunderstands resistance as a natural and potentially valuable component of change processes.
Transforming Resistance into Feedback
Rather than minimising resistance, effective change management should encourage comprehensive feedback from all stakeholder groups. The goal shifts from resistance reduction to feedback optimisation:
Feedback Quality Indicators: • Specificity of concerns raised and solutions suggested • Constructive nature of criticism and improvement ideas • Stakeholder willingness to engage in problem-solving discussions • Implementation feasibility of suggested modifications
Implementation Tracking: • Percentage of feedback items addressed in change plans • Time from feedback receipt to response or action • Stakeholder perception of influence on change processes • Communication quality regarding feedback disposition
Effective resistance can highlight legitimate concerns, identify implementation risks, and strengthen final solutions through stakeholder input. The question becomes: What specific aspects of change generate concern, and how can legitimate resistance improve change outcomes?
Compliance and Adherence: The Missing Reinforcement Link
Compliance and adherence metrics represent critical but often overlooked components of change measurement. These metrics assess how effectively employees follow new policies and procedures—the ultimate test of change success.
The challenge lies in measurement timing and responsibility allocation:
Common Gaps: • Change teams fail to design compliance measurement into their change processes • Assessment is left for post-implementation periods when project teams have moved on • Timing gaps create measurement blind spots precisely when reinforcement is most critical • Lack of clear ownership for ongoing compliance monitoring
Effective Measurement Approaches: • Digital systems providing automated compliance tracking • Leadership follow-up protocols and structured audit processes • Operational integration rather than separate evaluation activities • Real-time dashboards showing compliance trends and exceptions
The key is embedding measurement into operational processes rather than treating it as a separate evaluation activity. This integration ensures continuous monitoring and rapid identification of compliance issues before they become systemic problems.
Establishing Effective Change Management Metrics
Developing effective change management metrics requires systematic approach that addresses the limitations of traditional measurement while leveraging modern technological capabilities.
The Three-Level Performance Framework
Leading organisations utilise comprehensive measurement frameworks that address multiple performance levels simultaneously:
Change Management Performance: • Completion of change management plans and milestone delivery • Activation of core roles like sponsors and change champions • Progress against planned activities and timeline adherence • Quality of change management deliverables and stakeholder feedback
Individual Performance (using frameworks like ADKAR): • Awareness levels and understanding of change rationale • Desire for change and motivation to participate • Knowledge acquisition through training and communication • Ability to implement required behaviours and skills • Reinforcement mechanisms and behaviour sustainability
Organisational Performance: • Achievement of intended business outcomes and strategic objectives • Financial performance improvements and cost reductions • Operational efficiency gains and process improvements • Customer satisfaction improvements and market position
This approach recognises the interdependent nature of change success across organisational, individual, and change management performance dimensions.
Leveraging Modern Technology for Enhanced Measurement
Contemporary change management measurement can exploit advanced technologies that were unavailable to previous generations of practitioners:
AI-Powered Analytics: • Sentiment analysis processing large volumes of text feedback • Pattern detection identifying predictive indicators of change success • Automated insights generation from multiple data sources • Real-time risk assessment and early warning systems
Predictive Capabilities: • Forecasting change outcomes based on early indicators • Proactive intervention before problems become critical • Historical pattern analysis for correlation identification • Capacity planning and resource optimisation
Real-Time Monitoring: • Continuous dashboards and automated reporting systems • Immediate identification of emerging issues • Rapid response to developing challenges • Data-driven optimisation throughout change processes
Building Measurement Into Change Strategy
Effective change measurement requires integration into change strategy from the earliest planning stages rather than being added as an afterthought. This integration ensures measurement serves strategic purposes rather than merely satisfying reporting requirements.
Defining Success Before Beginning
Successful change measurement begins with clear definition of desired outcomes and success criteria:
Primary Sponsor Requirements: • Articulate specific, measurable objectives aligned with organisational benefits • Connect change outcomes to strategic goals and performance indicators • Define acceptable risk levels and tolerance thresholds • Establish timeline expectations and milestone definitions
Stakeholder Engagement: • Include leaders, subject matter experts, and project managers in success definition • Ensure shared understanding across all stakeholder groups • Align measurement focus on outcomes that matter to everyone • Avoid narrow technical achievements without business relevance
Selecting Appropriate Metrics for Context
Different types of change require different measurement approaches:
Regulatory Compliance Changes: • Focus on adherence rates and audit readiness • Track training completion and competency verification • Monitor risk mitigation and control effectiveness • Measure timeline compliance and regulatory approval
Cultural Transformation Initiatives: • Emphasise behaviour change and value demonstration • Track engagement levels and participation quality • Monitor leadership modelling and reinforcement • Measure employee sentiment and satisfaction trends
Technology Implementation Projects: • Focus on system usage rates and functionality adoption • Track user proficiency and support requirement reduction • Monitor performance improvements and efficiency gains • Measure integration success and data quality
Measurement complexity should align with change complexity and organisational capability. Simple changes in mature organisations might require only basic metrics, whilst complex transformations in change-inexperienced organisations demand comprehensive measurement frameworks.
Future Directions in Change Management Measurement
The future of change management measurement lies in sophisticated integration of human insight with technological capability. Several key trends are reshaping measurement approaches:
Predictive Change Management: • Historical data enables forecasting of change outcomes • Proactive optimisation of change approaches before issues arise • Real-time adjustment based on predictive indicators • Continuous learning from measurement data across initiatives
Integrated Organisational Systems: • Connection to broader business performance metrics • Direct demonstration of change impact on customer satisfaction • Integration with financial and operational reporting systems • Holistic view of organisational health and capability
Continuous Change Capability: • Measurement of organisational change capacity and resilience • Tracking of adaptation speed and learning effectiveness • Building change capability as core organisational competency • Supporting ongoing transformation rather than discrete projects
The evolution toward continuous change requires measurement systems that support ongoing transformation rather than discrete project evaluation. These systems must track organisational change capability, adaptation speed, and resilience development as essential business capabilities.
Measuring What Matters
Change management performance metrics represent both opportunity and risk for organisations pursuing transformation. Traditional measurement approaches harbour significant limitations that can mislead practitioners and undermine change success. However, sophisticated measurement systems that leverage modern technology and address these limitations can dramatically enhance change effectiveness.
The path forward requires abandoning simplistic metrics that provide false comfort in favour of comprehensive measurement frameworks that capture the complexity of organisational change. Key principles for effective measurement include:
Strategic Focus: • Serve genuine business purposes rather than administrative requirements • Enable better decisions and drive continuous improvement • Demonstrate measurable value of professional change management • Connect change outcomes to organisational success metrics
Technological Integration: • Leverage AI and machine learning for enhanced analytical precision • Utilise real-time monitoring and predictive capabilities • Integrate with broader organisational data systems • Automate routine measurement while preserving human insight
Comprehensive Approach: • Address multiple performance levels simultaneously • Balance quantitative metrics with qualitative insights • Include temporal dimensions and sustainability factors • Measure capability building alongside immediate outcomes
Most importantly, effective change measurement must serve strategic purposes rather than administrative requirements. Metrics should enable better decisions, drive continuous improvement, and demonstrate the value that professional change management brings to organisational success.
The organisations that master sophisticated change measurement will possess significant competitive advantages in an era of accelerating change. They will anticipate challenges before they emerge, optimise interventions in real-time, and build organisational capabilities that enable sustained transformation success. The question is not whether to measure change management performance, but whether to measure it effectively enough to create lasting competitive advantage.
Data Foundations and the Limits of Traditional Reporting
Change and transformation leaders are increasingly tasked with supporting decision making through robust, actionable reporting. Despite the rise of specialist tools, teams still lean heavily on Excel and Power BI because of their familiarity, ease and widespread adoption. However, as the pace and scale of organisational change accelerate, these choices reveal critical limitations, especially in supporting nuanced organisational insights.
Why High, Medium, Low Reporting Falls Short
Many change teams default to tracking change impact and volume using simple “high, medium, low” traffic light metrics. While this method offers speed and clarity for basic reporting, it fails to capture context, regional nuance, or the real intensity of change across diverse teams. This coarse approach risks obscuring important details, leaving senior leaders without the depth needed to target interventions or accurately forecast operational risks.
Change practitioners are often short on time and choosing whatever is easier and faster often becomes the default choice, i.e. Excel. This short-sighted approach focuses on quickly generating an output to try and meeting stakeholder needs without thinking strategically what makes sense at an organisational level, and the value of change data to drive strategy and manage implementation risks.
Data Capture: Getting the Inputs Right
Excel’s flexibility lets teams start capturing change data quickly, but often at the expense of structure. When fields and templates vary, information can’t be standardized or consistently compared. Manual entry introduces duplication, missing values, and divergent interpretations of change categories. Power BI requires disciplined and structured underlying data to function well; without careful source management, output dashboards reflect input chaos rather than clarity. Therefore, when pairing Excel with Power BI chart generation, often a BI (business intelligence) specialist is required to help configure and structure the chart outputs in Power BI.
Tips for effective data capture:
Establish clear data templates and definitions before rolling out change tracking.
Centralize where possible to avoid data silos and redundant records.
Assign responsibilities for maintaining quality and completeness at the point of entry.
Data Cleansing and Auditing: Maintaining Integrity
Excel and Power BI users are frequently responsible for manual data validation. The process is time-consuming, highly error-prone, and often fails to catch hidden inconsistencies, especially as data volumes grow. Excel’s lack of built-in auditing makes it tough to track changes or attribute ownership, increasing risks for compliance and reliability.
Best practices for cleansing and auditing:
Automate as much validation as possible, using scripts or built-in platform features.
Use a single master source rather than local versions to simplify updates.
Develop version control and change logs to support traceability and confidence in reporting.
Visualization, Dashboarding, and Interpretation Challenges in Change Reporting
After establishing robust data foundations, the next hurdle for senior change practitioners is translating raw information into clear, actionable insights. While Excel and Power BI each provide capabilities for visualizing change data, both bring unique challenges that can limit their effectiveness in supporting strategic decision making.
Visualization and Dashboard Design
Excel’s charting options are familiar and flexible for simple visualizations, but quickly become unwieldy as complexity grows. Static pivot charts and tables, combined with manual refreshing, reduce the potential for interactive analysis. Power BI offers more engaging, dynamic visuals and interactive dashboards, yet users frequently run into formatting frustrations, such as limited customization, bulky interfaces, and difficulties aligning visuals to precise narrative goals.
Some specific visualization and dashboard challenges include:
Difficulty representing complex, multidimensional change metrics within simplistic dashboards, e.g. impact by stakeholder by location by business unit by type of change.
Limited ability in both tools to customize visual details such as consistent colour themes or layered insights without significant effort.
Dashboard performance degradation with very large or complex datasets, reducing responsiveness and usability.
Interpreting Data and Supporting Decision Making
Effective dashboards must not only display data properly but also guide users toward meaningful interpretation. Both Excel and Power BI outputs can suffer when change teams focus too heavily on volume metrics or simple aggregated scores (like high/medium/low, or counting activities such as communication sent) without contextualizing underlying drivers. This can mislead executives into overgeneralized conclusions or missed risks.
Challenges include:
Dashboards overwhelmed by numbers without narrative or highlight indicators.
Difficulty embedding qualitative insights alongside quantitative data in either tool.
Sparse real-time feedback loops; often snapshots lag behind ongoing operational realities.
Tips and Tricks for Effective Visualization and Insights
Limit dashboard visuals to key metrics that align tightly with decision priorities; avoid clutter.
Use conditional formatting or custom visuals (in Power BI) to draw attention to anomalies or trends.
Build interactive filters and drill-downs to enable users to explore data layers progressively.
Combine quantitative data with qualitative notes or commentary fields to bring context to numbers.
Schedule regular dashboard updates and ensure data pipelines feed timely, validated information.
Once the foundation of reliable data capture and cleansing is set, the next major hurdle for senior change practitioners is transforming raw change data into clear, actionable insights. Excel and Power BI both offer visualization and dashboarding capabilities, yet each presents challenges that can limit their effectiveness in supporting strategic decision-making.
Visualization and dashboard design challenges
Excel’s charting features are familiar and flexible for simple visuals but quickly become cumbersome as complexity grows. Its static pivot charts and manual refresh cycles limit interactive exploration. Power BI adds interactive and dynamic visualizations but users often encounter limitations such as restricted formatting options, bulky interfaces, and considerable effort required to tailor visuals to convey precise change narratives.
Specific challenges include:
Struggling to represent complex, multi-dimensional change metrics adequately within simplistic dashboards.
Limited ability to apply consistent colour schemes or layered insights without advanced customization.
Performance degradation in dashboards when datasets become large or complex, impacting responsiveness and user experience.
Data interpretation and decision-making support
A dashboard’s true value comes from guiding users towards meaningful interpretation rather than just presentation of numbers. Both Excel and Power BI outputs may fall short if change teams rely excessively on aggregated volume metrics or high/medium/low scales without embedding context or deeper qualitative insight. This risks executives making generalized conclusions or overlooking subtle risks.
Key challenges include:
Dashboards overrun with numbers lacking narrative or prioritized highlights.
Difficulty integrating qualitative insights alongside quantitative data within either platform.
Reporting often static or delayed, providing snapshots that lag behind real-time operational realities.
Tips and tricks for more effective visualization and insight generation
Restrict dashboards to key metrics closely aligned with leadership priorities to avoid clutter.
Leverage conditional formatting or Power BI’s custom visuals to highlight trends, outliers or emerging risks.
Incorporate interactive filters and drill-downs allowing users to progressively explore data layers themselves.
Pair quantitative dashboards with qualitative commentary fields or summary narratives to provide context.
Implement disciplined refresh schedules ensuring data pipelines are timely and validated for ongoing accuracy.
Practical advice for change teams and when to consider dedicated change management tools
Change teams vary widely in size, maturity, and complexity of their reporting needs. For less mature or smaller teams just starting out, Excel often remains the most accessible and cost-effective platform for capturing and communicating change-related data. However, as organisational demands grow in complexity and leadership expects richer insights to support timely decisions, purpose-built change management tools become increasingly valuable.
Excel as a starting point
For teams in the early stages of developing change reporting capabilities, Excel offers several advantages:
Familiar user interface widely known across organisations.
Low entry cost with flexible options for data input, simple visualizations, and ad hoc analysis.
Easy to distribute offline or via basic file-sharing when centralised platforms are unavailable.
However, small teams should be mindful of Excel’s limitations and implement these best practices:
Design standardised templates with clear field definitions to improve consistency.
Concentrate on key metrics and avoid overly complex sheets to reduce error risk.
Apply version control discipline and regular data audits to maintain data accuracy.
Plan for future scalability by documenting data sources and formulas for easier migration.
Progressing to Power BI and beyond
As reporting needs mature, teams can leverage Power BI to create more dynamic, interactive dashboards for leadership. The platform offers:
Integration with multiple data sources, enabling holistic organisational views.
Rich visualizations and real-time data refresh capabilities.
Role-based access control improving collaboration and data governance.
Yet Power BI demands some specialist skills and governance protocols:
Teams should invest in upskilling or partnering internally to build and maintain reports.
Establish rigorous data governance to avoid “data swamp” issues.
Define clear escalation paths for dashboard issues to maintain reliability and trust.
When to adopt purpose-built change management platforms
For organisations undergoing complex change or those needing to embed change reporting deeply in strategic decision making, specialist tools like The Change Compass provide clear advantages:
Tailored data models specific to change management, capturing impact, readiness, resistance, and other essential dimensions.
Automated data capture integrations from multiple enterprise systems reducing manual effort and errors.
Advanced analytics and visualizations designed to support executive decision making with predictive insights and scenario planning, leveraging AI capabilities.
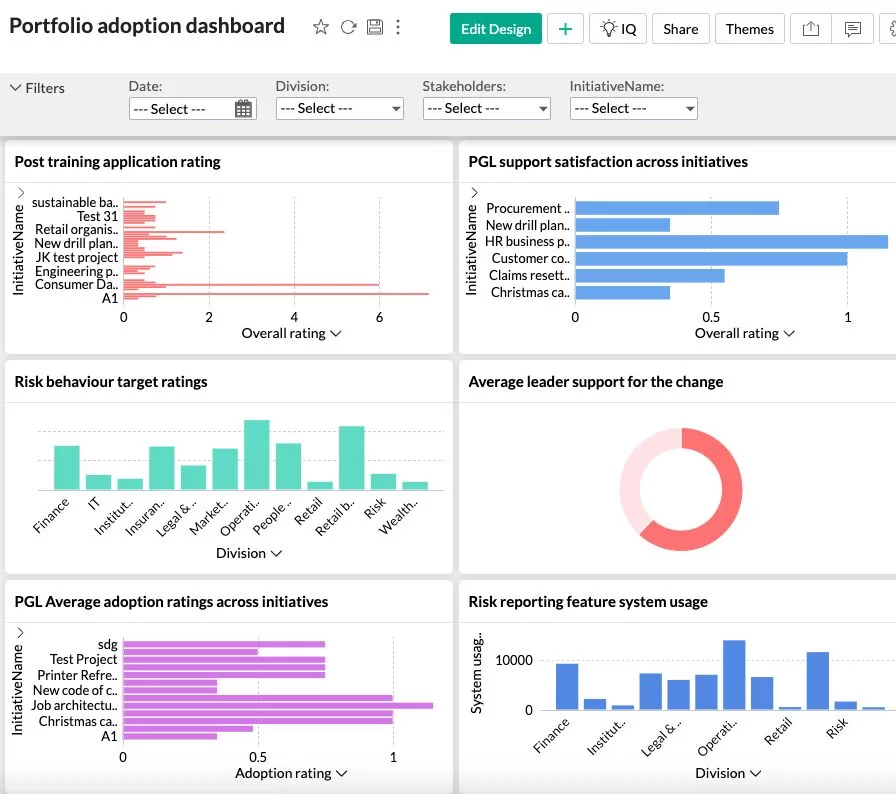
Ease of creating/editing chart and dashboards to match stakeholder needs, e.g. The Change Compass has 50+ visuals to cater for the most discerning stakeholder
Collaboration features aligned to change team workflows.
Built-in auditing, compliance, and performance monitoring focused on change initiatives.
Purpose-built platforms significantly reduce the effort required to turn change data into trusted, actionable insights, freeing change leaders to focus on driving transformation rather than managing reporting challenges.
Summary advice for change teams
Stage
Recommended tools
Focus areas
Starting out
Excel
Standardise templates, focus on core metrics, enforce data discipline
Purpose-built enterprise platforms (e.g. The Change Compass)
Integrate systems, leverage tailored analytics, support operations and executive decisions
Selecting the right reporting approach depends on organisational scale, available skills, and leadership needs. Recognising when traditional tools have reached their limits and investing in specialist change management platforms ensures reporting evolves as a strategic asset rather than a bottleneck.
This staged approach supports both incremental improvements and long-term transformation in how change teams provide decision support through high-quality, actionable reporting.
Practical advice for change teams and when to consider dedicated change management tools
Change teams vary widely in size, maturity, and complexity of their reporting needs. For less mature or smaller teams just starting out, Excel often remains the most accessible and cost-effective platform for capturing and communicating change-related data. However, as organisational demands grow in complexity and leadership expects richer insights to support timely decisions, purpose-built change management tools become increasingly valuable.
Excel as a starting point
For teams in the early stages of developing change reporting capabilities, Excel offers several advantages:
Familiar user interface widely known across organisations.
Low entry cost with flexible options for data input, simple visualizations, and ad hoc analysis.
Easy to distribute offline or via basic file-sharing when centralised platforms are unavailable.
However, small teams should be mindful of Excel’s limitations and implement these best practices:
Design standardised templates with clear field definitions to improve consistency.
Concentrate on key metrics and avoid overly complex sheets to reduce error risk.
Apply version control discipline and regular data audits to maintain data accuracy.
Plan for future scalability by documenting data sources and formulas for easier migration.
Progressing to Power BI and beyond
As reporting needs mature, teams can leverage Power BI to create more dynamic, interactive dashboards for leadership. The platform offers:
Integration with multiple data sources, enabling holistic organisational views.
Rich visualizations and real-time data refresh capabilities.
Role-based access control improving collaboration and data governance.
Yet Power BI demands some specialist skills and governance protocols:
Teams should invest in upskilling or partnering internally to build and maintain reports.
Establish rigorous data governance to avoid “data swamp” issues.
Define clear escalation paths for dashboard issues to maintain reliability and trust.
When to adopt purpose-built change management platforms
For organisations with complex change environments or those needing to embed change reporting deeply in strategic decision making, specialist tools like The Change Compass provide clear advantages:
Tailored data models specific to change management, capturing impact, readiness, resistance, and other essential dimensions.
Automated data capture integrations from multiple enterprise systems reducing manual effort and errors.
Advanced analytics and visualizations designed to support executive decision making with predictive insights.
Collaboration features aligned to change team workflows.
Built-in auditing, compliance, and performance monitoring focused on change initiatives.
Purpose-built platforms significantly reduce the effort required to turn change data into trusted, actionable insights, freeing change leaders to focus on driving transformation rather than managing reporting challenges.
Selecting the right reporting approach depends on organisational scale, available skills, and leadership needs. Recognising when traditional tools have reached their limits and investing in specialist change management platforms ensures reporting evolves as a strategic asset rather than a bottleneck.
This staged approach supports both incremental improvements and long-term transformation in how change teams provide decision support through high-quality, actionable reporting. With greater maturity, change teams also start to invest in various facets of data management, from data governance, data cleansing and data insights to provide a significant lift in perceived value by senior business stakeholders.
The topic of change is often inundated with literature stressing that it is about people, feeling, attitudes and behaviour. While these are important, lot of articles centred about the human-nature of change often ignore the importance of data during the change and transformation process. This is no different for the topic of employee readiness for change. People’s attitudes and behaviour need to be observed, measured and tracked during change.
Employee readiness for change is a critical factor that determines the outcome of organisational transformations. By leveraging data-driven insights, companies can proactively assess and enhance their employees’ preparedness, paving the way for smoother transitions and improved business results.
Let’s explore the concept of employee readiness for change and delve into strategies for using data to optimise readiness during transformations. We will discuss key metrics, change readiness assessments, employee engagement techniques, and real-time monitoring to help organisations navigate change effectively.
What is Employee Readiness for Change?
Employee readiness for change refers to the extent to which individuals within an organisation are prepared, willing, and capable of embracing and implementing change. It encompasses their understanding of the change, their motivation to support it, and their ability to adapt and perform effectively in the new environment.
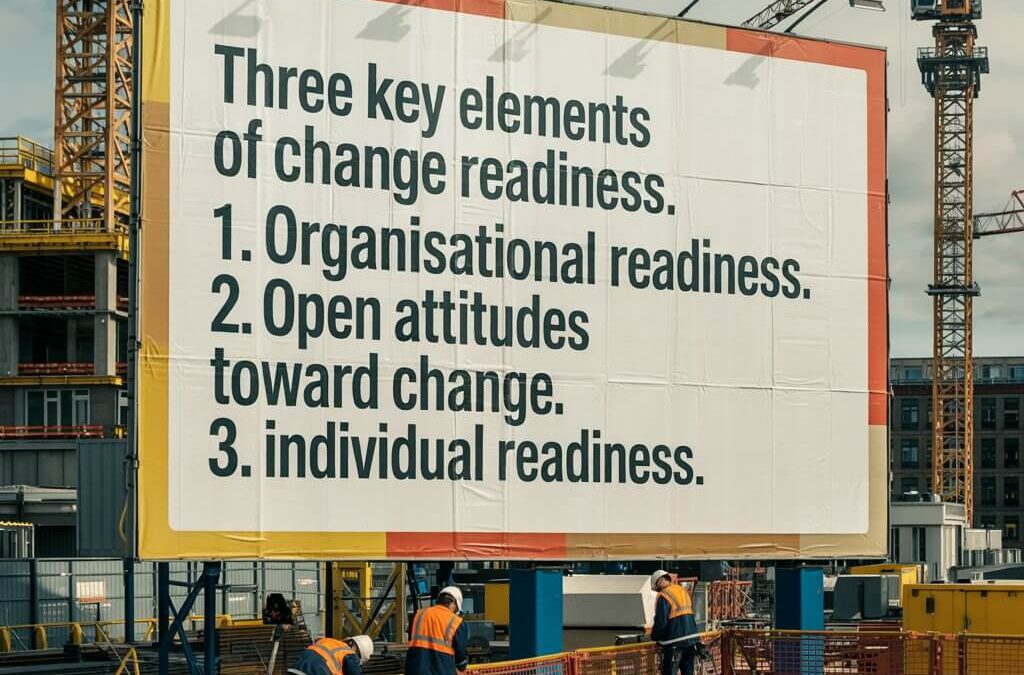
Assessing employee readiness involves evaluating three key elements:
Organisational readiness: This aspect focuses on the company’s overall preparedness for change, including factors such as leadership commitment, resource availability, and clear objectives.
Open attitudes toward change: Gauging employees’ understanding and willingness to embrace change is crucial. Positive attitudes contribute to successful resistance management and building change readiness.
Individual readiness: On a personal level, assessing each employee’s readiness, willingness, and ability to adapt to change is essential. This involves considering their skills, knowledge, and emotional preparedness.
Note that individual readiness is only one component of the overall readiness. A lot of people only focus on this to the detriment of truly assessing the overall readiness.
By conducting a comprehensive assessment of these elements, organisations can gain valuable insights into their employees’ readiness for change. This information serves as a foundation for developing targeted strategies to enhance readiness and facilitate successful transformations.
How to Use Data to Improve Employee Readiness During Transformations
Harnessing the power of data analytics is essential for enhancing workforce preparedness during organisational transformations. By systematically gathering and interpreting relevant data, organisations can uncover potential obstacles and craft bespoke strategies to bolster readiness and ensure seamless transitions.
Determining Critical Metrics for Change Preparedness
To effectively utilize data, organisations must first establish the critical metrics that will serve as indicators of readiness. These metrics provide a foundation for assessing the current state and tracking future progress:
Engagement indices: Measure the degree to which employees are actively involved and invested in organisational activities. High engagement suggests a supportive environment for change initiatives.
Flexibility indicators: Evaluate employees’ capacity to adjust to new roles and technologies. This metric identifies those who may benefit from targeted support.
Completion rates of developmental programs: Monitor the percentage of the workforce completing essential training. This figure highlights areas where skill enhancement is necessary.
Executing a Holistic Change Preparedness Evaluation
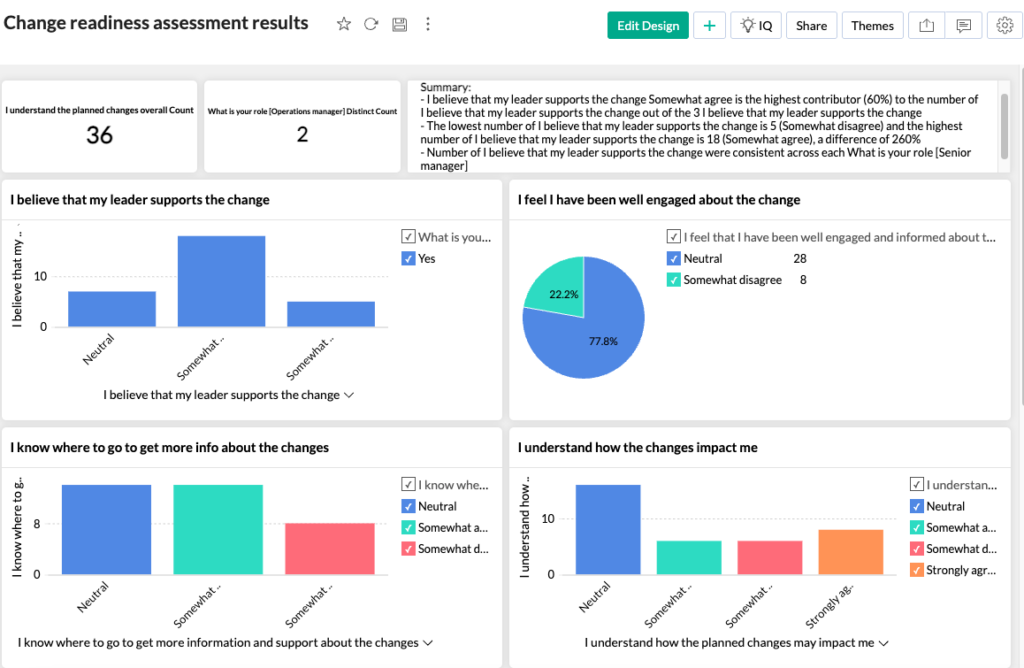
With metrics in place, conduct a thorough evaluation of change preparedness at both organisational and individual levels. Utilize surveys, interviews, and focus groups to gather rich data. This comprehensive approach reveals resistance points and directs attention to intervention opportunities:
Cultural assessment: Analyse underlying cultural traits that influence how change is perceived and implemented. Insights into assertiveness and hierarchy can guide communication strategies.
Leadership analysis: Assess the readiness and skillset of leaders to champion change. Effective leadership is pivotal for the success of transformation efforts.
Enhancing Workforce Involvement Through Data Insights
Data-driven insights can significantly enhance employee involvement during periods of change. By examining workforce data, organisations can tailor communication and training to better resonate with their employees:
Customized messaging: Develop communication that speaks directly to the needs and concerns of various employee segments. This ensures messages are impactful and engaging.
Focused learning initiatives: Identify specific knowledge gaps and create targeted training programs. Customized learning enhances employees’ ability to adapt to change confidently.
Continuous Strategy Adaptation via Real-Time Data
Ongoing monitoring of strategy effectiveness through real-time analytics is vital. This continuous process allows organisations to refine their approaches based on evolving data patterns, maintaining high levels of readiness:
Regular data collection: Actively seek feedback from employees regarding their transition experiences. This input is crucial for identifying areas needing adjustment.
Dynamic decision-making: Leverage real-time (or least recent) data to inform strategic decisions and optimize change management initiatives, ensuring they remain aligned with organisational goals.
1. Identify Key Metrics for Change Readiness
Establishing a robust framework of metrics is fundamental to accurately gauge change readiness within an organisation. These metrics function as critical indicators, allowing leaders to monitor the pulse of their workforce during transformation initiatives. A well-defined set of metrics provides a structured approach to assessing readiness and identifying areas requiring attention.
Engagement Indicators
Evaluating employee engagement is crucial for understanding the workforce’s readiness for change. This involves gathering insights into how employees perceive their roles and the organisation’s objectives. A workforce that demonstrates high levels of commitment and enthusiasm tends to be more agile and supportive of change efforts. Methods such as employee sentiment analysis and engagement surveys can help capture these dynamics, offering a nuanced view of organisational health.
Flexibility Metrics
Flexibility metrics provide a window into the ease with which employees can transition to new processes and systems. This involves examining historical data on change adaptability and using tools like behavioural assessments to gauge employees’ readiness for new challenges. Understanding the flexibility of employees can guide targeted support and interventions, ensuring smoother transitions during organisational shifts.
Completion Rates of Educational Programs
Monitoring the completion rates of educational initiatives is essential to assess how prepared employees are for impending changes. This metric reflects the organisation’s dedication to equipping its workforce with the skills needed for transformation. Analysing completion data, alongside post-training assessments, can offer insights into the effectiveness of learning interventions and highlight areas for development.
Together, these metrics form a comprehensive picture of an organisation’s change readiness. By establishing a baseline for these indicators, organisations can track progress over time, adjusting strategies as necessary to enhance readiness and facilitate successful transformations.
2. Conduct a Comprehensive Change Readiness Assessment
To pave the way for a successful transformation, conducting a comprehensive change readiness assessment becomes imperative. This systematic evaluation delves into the organisation’s preparedness at both the macro and micro levels, providing insights that are critical for shaping effective change strategies. Utilizing a blend of qualitative and quantitative methods, the assessment illuminates the landscape of readiness, offering a strategic foundation for decision-making.
Strategic Evaluation Components
A multifaceted readiness assessment encompasses several strategic components, each designed to gather a holistic understanding of the organisational climate:
Cultural Insight Analysis: Delve into the organisational culture to uncover factors that may affect acceptance of change. This involves exploring existing communication styles, shared values, and prevalent behaviours that could influence the transformation journey. Gaining a clear picture of these cultural dynamics aids in crafting initiatives that resonate with the workforce’s inherent beliefs.
Leadership Capacity Evaluation: Determine the readiness and effectiveness of leadership in spearheading change efforts. Examine their ability to inspire and motivate, as well as their capacity to navigate the complexities of organisational transformation. Strong leadership commitment is essential for instilling confidence and guiding the organisation through change.
Resource Readiness Check: Evaluate the sufficiency and distribution of resources critical for supporting change initiatives. Consider the existing technological capabilities, financial support, and human resources available to drive the transformation. Addressing resource gaps early ensures that the organisation is well-prepared to meet the demands of change.
Analysing Data for Targeted Interventions
Upon gathering data through the readiness assessment, a thorough analysis is essential to uncover insights that inform strategic interventions. This analysis should focus on identifying potential resistance points and areas ripe for development:
Resistance Identification: Detect and chart areas where reluctance to change may manifest. Utilize employee feedback, trends from past projects, and current mood assessments to pinpoint these zones. Understanding these resistance factors allows for proactive measures to encourage acceptance and reduce pushback.
Opportunity Leveraging: Spot areas with high readiness levels that can be used to propel change efforts forward. Recognize organisational strengths and existing competencies that can be harnessed to support the transition. By leveraging these opportunities, organisations can accelerate progress and cultivate a culture of continuous growth.
Conducting a comprehensive change readiness assessment provides a strategic lens through which organisations can navigate the complexities of transformation. By systematically evaluating readiness and leveraging data-driven insights, organisations can craft tailored strategies that enhance employee preparedness and drive successful change outcomes.
3. Utilise Data Analytics to Foster Employee Engagement
Employing data analytics is essential to deepening employee involvement during change processes. By utilizing advanced analytical tools, organisations can uncover key drivers of motivation and engagement within their workforce. This enables the development of strategies that are not only data-informed but also tailored to enhance a culture of commitment and adaptability.
Strategic Communication Approaches
Data analytics offer organisations the ability to refine communication strategies in a way that aligns with the diverse preferences and needs of employees. By examining patterns in communication effectiveness and gathering feedback, companies can create messaging frameworks that are clear and meaningful. This strategic approach ensures that communication is not just disseminated but absorbed, fostering a sense of inclusion and understanding across the organisation.
Customised Development Pathways
Insights from analytics enable the design of development pathways that cater to the specific learning and growth needs of employees. Analysing performance metrics and capability assessments allows organisations to pinpoint where support is most needed, leading to bespoke development initiatives. These pathways not only address skill gaps but also promote a learning culture that equips employees for future challenges.
Ongoing Engagement Assessment
Real-time analytics provide a robust mechanism for continuously assessing employee engagement throughout the transformation journey. Establishing metrics that reflect engagement sentiment and participation levels helps organisations react swiftly to shifts in morale. This proactive engagement assessment ensures that initiatives remain aligned with employee expectations and organisational objectives, fostering a sustained commitment to change.
4. Monitor and Adapt Strategies Using Real-Time Data
Leveraging real-time data analytics is crucial for dynamically guiding change initiatives. This approach enables organisations to continuously evaluate the effectiveness of their strategies, ensuring they remain aligned with shifting business needs and employee expectations. By integrating adaptive feedback mechanisms, companies can refine their tactics, promoting an environment of agility and responsiveness.
Dynamic Data Acquisition
Establishing a robust system for dynamic data acquisition is essential to maintain an accurate understanding of organisational and employee dynamics. Real-time analytics platforms and dashboards provide comprehensive insights into change progress, such as engagement indices, performance metrics, and sentiment analysis. Regularly capturing this data allows organisations to proactively identify patterns and shifts that may influence the success of change initiatives.
Strategic Insights-Driven Adjustments
The insights obtained from real-time data empower organisations to make calculated adjustments to their strategies. This adaptive approach ensures that interventions remain pertinent and effective, addressing emerging challenges and capitalizing on new opportunities:
Incorporating Employee Perspectives: Integrate direct insights from employees into strategic refinements. Understanding their experiences and perceptions offers a nuanced perspective of the change process, allowing for precise enhancements.
Pattern Recognition: Use data patterns to recognize trends that may require strategic shifts. For example, a downward trend in engagement metrics could indicate the need for improved communication or support mechanisms.
Efficient Resource Deployment: Employ data insights to enhance resource deployment, ensuring that efforts are concentrated where they are most impactful. This targeted approach enhances the effectiveness of change initiatives and maximizes results.
Proactive Decision-Making
Real-time data analytics enable proactive decision-making, empowering leaders to swiftly adjust to evolving conditions. This capability is vital for sustaining momentum and ensuring that change efforts remain aligned with organisational objectives. By adopting a data-informed mindset, organisations can navigate the complexities of transformation with confidence and precision.
By harnessing the power of data analytics, organisations can proactively assess and enhance employee readiness during transformations, paving the way for smoother transitions and improved business outcomes. Embracing a data-driven approach to change management is no longer optional; it is a strategic imperative for organisations seeking to thrive in an ever-evolving landscape. If you’re ready to transform your change management processes and unlock the full potential of your workforce, chat to us to explore how we can help you leverage data and insights to navigate change with confidence and precision.
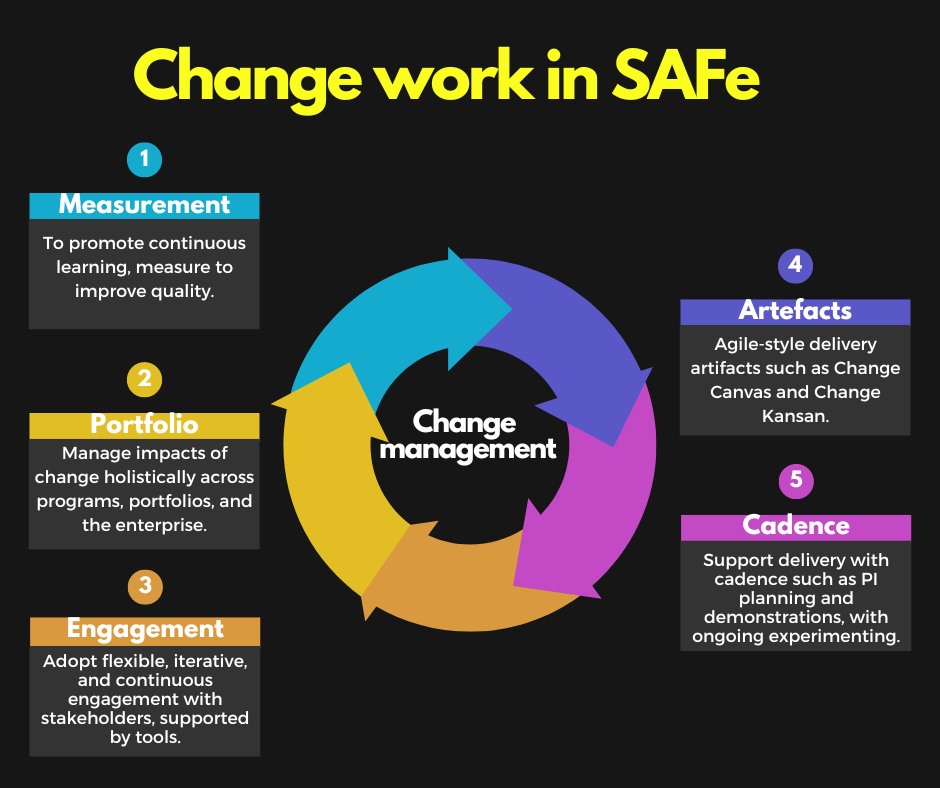
The need for organizations to remain flexible and responsive to market demands has never been more critical, and scaled agile (SAFe) provide the framework to achieve this. Integrating change management work with SAFe is essential for seamless product delivery but yet is not clearly articulated in literature. However, for agile product delivery to be successful, it must be supported by robust change management work steps. Those that not ensures that all stakeholders are aligned and engaged throughout the process and also that the consecutive changes delivered are adopted. Let’s explore how change managers can effectively integrate their approaches with scaled agile methodologies to enhance product delivery.
Understanding the Intersection of Change Management and Agile
Change management and agile methodologies both aim to facilitate successful project outcomes, but they approach this goal from different angles. Change management focuses on the people side of change, ensuring that stakeholders are prepared, equipped, and supported throughout the transition through to benefit realisation. Agile methodologies, on the other hand, emphasize iterative development, continuous feedback, and rapid adaptation to change.
Whilst SAFe acknowledges the importance of managing the people side of change and leading the change, it does not spell out how exactly this work should be integrated with the methodology in a detailed manner. References to change tends to be at a high level and focuses on communication and readiness activities.
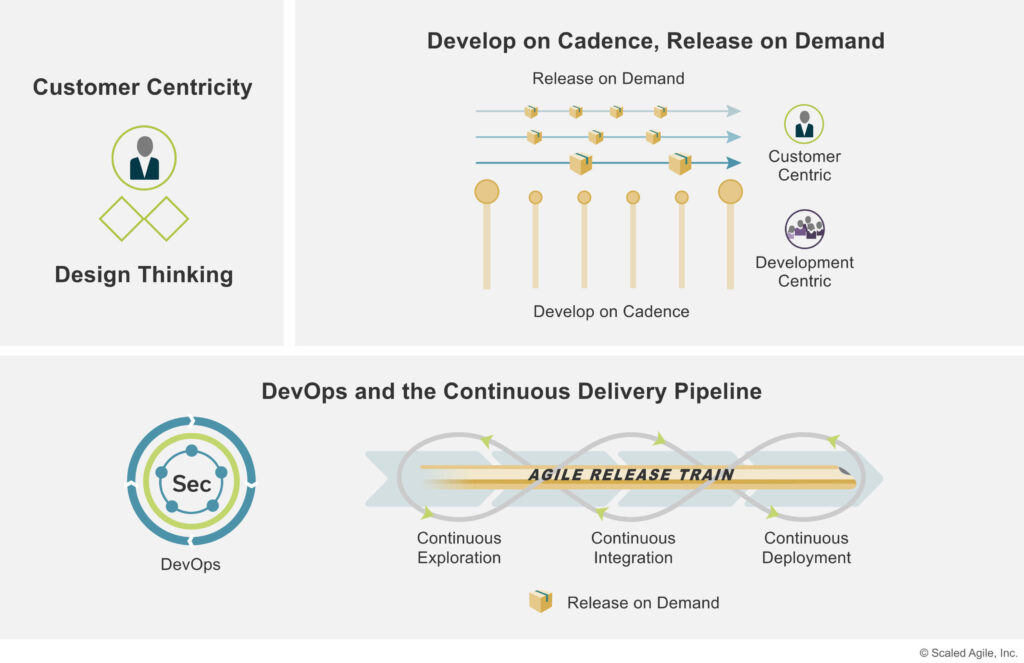
What are key call outs of the SAFe methodology:
1) Lean-Agile Principles: SAFe is grounded in Lean-Agile principles such as building incrementally with fast, integrated learning cycles, basing milestones on objective evaluation, and making value flow without interruptions. These principles help ensure continuous improvement and adaptability
2) Organizational Agility: To remain competitive, enterprises must be agile. SAFe enhances organizational agility by fostering Lean-thinking people and Agile teams, promoting strategic agility, and implementing Lean business operations
3) Lean Portfolio Management: Aligns strategy and execution by applying Lean and systems thinking. It includes strategy and investment funding, Agile portfolio operations, and Lean governance to ensure that the portfolio is aligned and funded to meet business goals
4) Continuous Learning Culture: Encourages a set of values and practices that promote ongoing learning and improvement. This culture is crucial for adapting to changes and fostering innovation within the organization
5) Agile Teams: Agile teams in SAFe operate using methods like SAFe Scrum or SAFe Team Kanban. These teams are responsible for understanding customer needs, planning their work, and delivering value continuously through iterative processes
6) Built-in Quality: Emphasizes the importance of quality at all stages of development. Practices include shift-left testing, peer reviews, and automation to ensure high standards and reduce defects early in the process
7) Value Stream Management (VSM): Focuses on optimizing the flow of value across the entire portfolio. VSM helps organizations improve their value delivery processes by managing and monitoring value streams effectively (Scaled Agile Framework).
8) Lean-Agile Leadership: Leaders play a critical role in fostering a Lean-Agile mindset. They must model the values and principles of SAFe, provide guidance, and create an environment that supports Agile teams and continuous improvement
9) Decentralized Decision-Making: Promotes faster value delivery by empowering teams to make decisions locally. This reduces delays, enhances product development flow, and fosters innovation
10) Customer-Centric Approach: Agile teams are encouraged to maintain close collaboration with customers to understand their needs better and ensure that solutions deliver real value. Techniques like direct customer interaction and feedback loops are essential
Below is a diagram from Scaled Agile Frameworks on key elements of a scaled agile product delivery framework.
Agile-Style Deliverable Artefacts
To support agile product delivery, change managers need to create agile-style deliverable artefacts early in the product delivery cycle. These artefacts serve as essential tools for aligning the team, stakeholders, and the overall change initiative with agile principles. They are significantly ‘lighter’ in volume and more succinct in focusing on key analysis points that determine approaches and actions required to plan and implement the change.
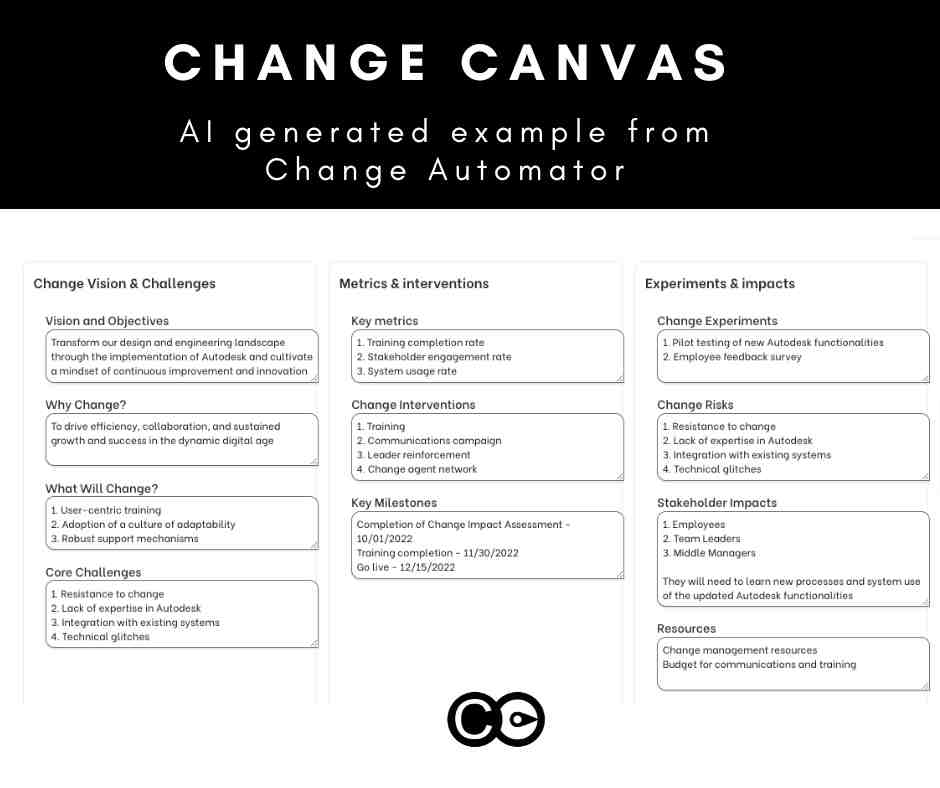
Change artefact 1: Change Canvas
An Agile Change Canvas is a strategic tool designed to plan, manage, and communicate change initiatives effectively within an organization. It begins with basic identification details such as the Project Name, Business Owner, and Author. This section ensures clear accountability and ownership from the outset.
The Change Vision & Objectives outlines the overarching project objectives and intended outcomes of the project. This architecture vision acts as a guiding star, ensuring all actions align with the desired future state of the organization. Following this, Core Challenges are identified to highlight potential obstacles that could impede progress. Recognizing these challenges early allows for proactive mitigation strategies.
Stakeholder Impacts analyses how different stakeholders will be affected by the change. This includes assessing both the positive and negative impacts on employees, customers, and shareholders, ensuring that their concerns are addressed and their needs met.
The Key Milestones section, presented in a table format, outlines significant checkpoints in the project timeline, often represented in Gantt charts. Each milestone is associated with a particular function, ensuring that progress is measurable and trackable. Similarly, the Resources section details the necessary financial, human, and technological resources required to implement the change, ensuring that the project scope statement is adequately supported.
Why Change section provides the rationale behind the need for change, which could include market demands, competitive pressures, or internal inefficiencies. This section justifies the project’s existence and urgency. Complementarily, What Will Change (WWC) describes the specific changes to be implemented, including processes, technologies, behaviours, and structures, offering a clear picture of the project’s scope.
Key Metrics are identified to measure the success of the change initiative. These metrics are both quantitative and qualitative, providing a comprehensive view of the project’s impact. Change Interventions listed in a table format, detail specific actions or initiatives designed to facilitate the change, ensuring a structured approach to implementation.
To foster a culture of innovation and adaptation, Change Experiments are proposed. These pilot programs test aspects of the change in a controlled environment before full-scale implementation. Finally, Change Risks identifies potential risks associated with the change and outlines strategies for mitigating these risks, ensuring that the project can navigate potential pitfalls effectively.
By incorporating these elements, the Agile Change Canvas provides a comprehensive framework for managing change initiatives, ensuring that all critical aspects are considered, planned for, and communicated effectively to stakeholders.
Using a Kanban board for change management activities provides a visual and dynamic method for tracking, prioritizing, and managing the flow of work while implementing changes. A Kanban board typically consists of columns that represent different stages of work, such as “To Do,” “In Progress,” and “Done.” For change management, additional columns might include “Proposed Changes,” “Under Review,” “Implementation Planning,” and “Monitoring.”
Whilst most change practitioners are used to kanban boards In working with various change management activities, there is opportunity to use kanban to plan and prioritise a series of agile-style changes and the associated change activities with each change. These ‘change cards’ within the kanban board presents a clear way to visualise a series of changes across the ‘delivery train’ where the project team continuously delivers pieces of change.
Prioritizing Change Management Activities
Visualizing Workflow:
Proposed Changes: This column lists all suggested changes, each represented by a card detailing the change’s purpose, impacted areas, and expected benefits.
Under Review: Changes move here once they are being evaluated for feasibility, risks, and alignment with project goals.
Implementation Planning: Approved changes are further detailed, including resource allocation, timelines, and specific tasks needed for implementation.
In Progress: Changes that are actively being worked on are tracked here, showing current status and any blockers encountered.
Monitoring: Recently implemented changes are monitored to ensure they are delivering the expected outcomes and to identify any issues early.
Done: Fully implemented and stabilized changes are moved here, marking their successful completion.
Setting Priorities:
Value and Impact: In conjunction with the project team prioritize changes based on their potential value and impact. High-value changes that significantly improve project outcomes or stakeholder satisfaction should be addressed first. From a change perspective, the input here is about the readiness of the stakeholder to receive the change, and what timing and work is required to get there.
Urgency and Dependencies: Changes that unblock other work or are time-sensitive should be prioritized. Dependencies between changes must be mapped to ensure logical sequencing. For example, work required to lift capability/leadership or readiness may be critical dependencies, without which the change cannot be delivered successfully.
Feasibility and Risk: Assess the feasibility and risks associated with each change. High-risk assessment of changes might require more careful planning and monitoring but should not necessarily be deprioritized if their impact is critical. The change input here is the people impact for the impacted stakeholders with other changes not just within this project/program, but with the overall portfolio or even outside the portfolio (including business-driven changes).
Proposed Changes: This column lists all suggested changes, each represented by a card detailing the change’s purpose, impacted areas, and expected benefits.
Under Review: Changes move here once they are being evaluated for feasibility, risks, and alignment with project goals.
Implementation Planning: Approved changes are further detailed, including resource allocation, timelines, and specific tasks needed for implementation.
In Progress: Changes that are actively being worked on are tracked here, showing current status and any blockers encountered.
Monitoring: Recently implemented changes are monitored to ensure they are delivering the expected outcomes and to identify any issues early.
Done: Fully implemented and stabilized changes are moved here, marking their successful completion.
Value and Impact: In conjunction with the project team prioritize changes based on their potential value and impact. High-value changes that significantly improve project outcomes or stakeholder satisfaction should be addressed first. From a change perspective, the input here is about the readiness of the stakeholder to receive the change, and what timing and work is required to get there.
Urgency and Dependencies: Changes that unblock other work or are time-sensitive should be prioritized. Dependencies between changes must be mapped to ensure logical sequencing. For example, work required to lift capability/leadership or readiness may be critical dependencies, without which the change cannot be delivered successfully.
Feasibility and Risk: Assess the feasibility and risks associated with each change. High-risk changes might require more careful planning and monitoring but should not necessarily be deprioritized if their impact is critical. The change input here is the people impact for the impacted stakeholders with other changes not just within this project/program, but with the overall portfolio or even outside the portfolio (including business-driven changes).
Ordering Change Planning and Implementation
Collaborative Planning:
Engage stakeholders and team members in planning sessions to discuss and agree on the priority of changes. This collaborative approach ensures that all perspectives are considered and that there is buy-in from those affected by the changes. This includes change champions.
Regular Review and Adaptation:
The Kanban board should be regularly reviewed and updated, within the change team and within the project team. During these reviews, re-prioritize changes based on new information, shifting project needs, and feedback from implemented changes. This iterative approach aligns with Agile principles of flexibility and continuous improvement.
Limit Work in Progress (WIP):
To avoid overloading the change team and ensure focus, limit the number of changes in progress at any given time. This constraint encourages the team to complete current tasks before taking on new ones, promoting a steady and manageable workflow.
Use Metrics and Feedback:
Utilize metrics such as cycle time (how long a change takes to move from start to finish, from awareness to engagement to eventual adoption) and work with the project team on the throughput (how many changes are completed in a specific timeframe) to assess the efficiency of the change management process. For example, based on the size and complexity of each discrete piece of change delivered, how long did this take and what was the deviance from actual time period planned? Feedback from these metrics should inform decisions about prioritization and process adjustments.
Engage stakeholders and team members in planning sessions to discuss and agree on the priority of changes. This collaborative approach ensures that all perspectives are considered and that there is buy-in from those affected by the changes. This includes change champions.
The Kanban board should be regularly reviewed and updated, within the change team and within the project team. During these reviews, re-prioritize changes based on new information, shifting project needs, and feedback from implemented changes. This iterative approach aligns with Agile principles of flexibility and continuous improvement.
To avoid overloading the change team and ensure focus, limit the number of changes in progress at any given time. This constraint encourages the team to complete current tasks before taking on new ones, promoting a steady and manageable workflow.
Utilize metrics such as cycle time (how long a change takes to move from start to finish, from awareness to engagement to eventual adoption) and work with the project team on the throughput (how many changes are completed in a specific timeframe) to assess the efficiency of the change management process. For example, based on the size and complexity of each discrete piece of change delivered, how long did this take and what was the deviance from actual time period planned? Feedback from these metrics should inform decisions about prioritization and process adjustments.
Benefits of Using Kanban for Change Management
Implementing a Kanban board for change management in Agile projects offers several benefits:
Transparency: Everyone involved can see the status of change activities, leading to better communication and coordination.
Flexibility: The board can be easily adjusted to reflect changing priorities and project dynamics.
Focus: Limiting WIP helps the team maintain focus and reduces the risk of burnout and task switching.
Continuous Improvement: Regular reviews and adaptations promote a culture of continuous improvement, ensuring that change management processes evolve and improve over time.
Change artefact example 3: Change Impact Assessment
A Change Impact Assessment (CIA) is an essential component in managing organizational change, particularly in agile projects where the focus is on iterative and incremental improvements. The assessment helps to understand the scope and magnitude of the change, identify affected stakeholders, and plan interventions to manage impacts effectively. An agile-friendly CIA is more summarised, and gets to the heart of what the impact is, who is impacted, how, to what extent, and when.
Below are the core elements of a change impact assessment, with a comparison to traditional methods:
1. Identifying the Impacts
Agile Approach: In scaled agile projects, the impact identification is ongoing and iterative. Each sprint or iteration is reviewed to assess the impacts of delivered changes. This dynamic approach ensures that emerging impacts are quickly recognized and addressed.
Traditional Approach: Impact identification is typically conducted at the beginning of the project, with periodic reviews. This method can be less responsive to new impacts discovered during the project lifecycle.
2. Stakeholder Identification and Analysis
Agile Approach: Continuous stakeholder engagement is crucial. Stakeholders are regularly consulted, and their feedback is integrated into the process. Agile methods ensure that stakeholders’ changing needs and concerns are promptly addressed.
Traditional Approach: Stakeholder analysis is often conducted early in the project, with limited ongoing engagement. This can result in less adaptability to stakeholders’ evolving requirements.
3. Extent and Nature of Impacts
Agile Approach: The extent of impacts is assessed incrementally, considering the cumulative effect of changes over multiple iterations. This allows for a nuanced understanding of how impacts evolve over time.
Traditional Approach: Typically focuses on a comprehensive initial assessment, with less emphasis on the evolution of impacts throughout the project.
4. Timing of Impacts
Agile Approach: Timing is aligned with the iterative delivery schedule. The impacts are mapped to specific iterations or sprints, allowing for precise planning and mitigation.
Traditional Approach: Timing is generally assessed at the project level, which can make it harder to pinpoint when specific impacts will occur during the project lifecycle.
Typical Sections of an Agile Change Impact Assessment
Impact Overview:
Explanation: Summarizes the nature and scope of the change, providing a high-level view of the anticipated impacts.
Agile Twist: Updated regularly with each iteration to reflect new findings and emerging impacts.
Stakeholder Impact Analysis:
Explanation: Identifies who will be affected by the change and how. It details the extent of the impact on different stakeholder groups.
Agile Twist: Involves continuous stakeholder feedback and updates to capture evolving impacts.
Impact Extent and Nature:
Explanation: Describes the extent (e.g., minor, moderate, significant) and nature (e.g., process, technology, cultural) of the impacts.
Agile Twist: Assessed incrementally, considering both immediate and long-term impacts across iterations.
Impact Timing:
Explanation: Specifies when the impacts are expected to occur, mapped to the project timeline.
Agile Twist: Aligned with sprint or iteration schedules, allowing for detailed timing predictions.
Mitigation Strategies:
Explanation: Outlines plans to manage and mitigate identified impacts.
Agile Twist: Adaptive strategies that are refined continuously based on iteration reviews and stakeholder feedback.
Monitoring and Review:
Explanation: Describes how the impacts will be monitored and reviewed throughout the project.
Agile Twist: Continuous monitoring with iteration-end reviews to ensure timely identification and management of impacts.
Explanation: Summarizes the nature and scope of the change, providing a high-level view of the anticipated impacts.
Agile Twist: Updated regularly with each iteration to reflect new findings and emerging impacts.
Explanation: Identifies who will be affected by the change and how. It details the extent of the impact on different stakeholder groups.
Agile Twist: Involves continuous stakeholder feedback and updates to capture evolving impacts.
Explanation: Describes the extent (e.g., minor, moderate, significant) and nature (e.g., process, technology, cultural) of the impacts.
Agile Twist: Assessed incrementally, considering both immediate and long-term impacts across iterations.
Explanation: Specifies when the impacts are expected to occur, mapped to the project timeline.
Agile Twist: Aligned with sprint or iteration schedules, allowing for detailed timing predictions.
Explanation: Outlines plans to manage and mitigate identified impacts.
Agile Twist: Adaptive strategies that are refined continuously based on iteration reviews and stakeholder feedback.
Explanation: Describes how the impacts will be monitored and reviewed throughout the project.
Agile Twist: Continuous monitoring with iteration-end reviews to ensure timely identification and management of impacts.
Stakeholder Engagement in a Scaled Agile Environment
Planning and designing stakeholder engagement activities in a scaled agile environment requires a dynamic, iterative approach that contrasts significantly with traditional, non-agile methods. In SAFe, the focus is on continuous collaboration, transparency, and adaptability, ensuring that stakeholders are actively involved throughout the project lifecycle.
Iterative and Continuous Engagement
Scaled Agile Approach: Stakeholder engagement is an ongoing process. Agile frameworks emphasize regular touchpoints, such as sprint reviews, planning meetings, and daily stand-ups, where stakeholders can provide feedback and stay informed about progress. These frequent interactions ensure that stakeholder input is continuously integrated, enabling swift adjustments and alignment with evolving needs. This iterative approach fosters a collaborative environment where stakeholders feel valued and engaged throughout the project. Engagement rhythms and processes should also be established not just at a project, but program, portfolio and enterprise levels as required.
Non-Agile Approach: Traditional methodologies often involve stakeholder engagement at fixed points in the project timeline, such as during initial requirements gathering, major milestone reviews, and final project delivery. This approach can lead to periods of limited communication and delayed feedback, which may result in misaligned expectations and missed opportunities for timely course corrections.
Flexibility and Adaptation
Scaled Agile Approach: Agile projects embrace change, allowing stakeholder engagement activities to be flexible and adaptive. As project requirements evolve, the engagement strategy can be adjusted to address new priorities or challenges. This flexibility ensures that stakeholder needs are consistently met, and any concerns are promptly addressed. Agile frameworks encourage a culture of openness and continuous improvement, where stakeholder feedback directly influences the direction of the project. Change managers need to ensure that stakeholder understand this fully, and have the skills to work within this context, not just with the project team but in leading their teams through change, when ‘the change’ may be constantly shifting.
Non-Agile Approach: In contrast, traditional approaches tend to follow a rigid engagement plan that is set at the project’s outset. While this provides a clear structure, it can be less responsive to changing stakeholder needs or external conditions. Adjusting the engagement strategy mid-project can be challenging and may require significant effort, leading to delays and potential dissatisfaction among stakeholders.
Collaborative Tools and Techniques
Scaled Agile Approach: Agile environments leverage a variety of collaborative tools and techniques to enhance stakeholder engagement. Digital platforms such as Jira, Confluence, and Miro facilitate real-time collaboration, transparency, and documentation. Agile ceremonies, such as retrospectives and demos, provide structured opportunities for stakeholders to participate and contribute. These tools and techniques help maintain a high level of engagement and ensure that stakeholders have a clear view of project progress and challenges.
Non-Agile Approach: Traditional methods might rely more heavily on formal documentation and periodic reports for stakeholder communication. While these methods ensure thorough documentation, they can sometimes create barriers to real-time collaboration and immediate feedback. Meetings and reviews are often scheduled infrequently, which can lead to less dynamic interaction compared to agile practices.
Planning Stakeholder Engagement Activities
Regular Touchpoints: Schedule frequent meetings and reviews to ensure continuous stakeholder involvement. Examples include sprint reviews, iteration planning meetings, and daily stand-ups. Business-led rhythm that enable the dissemination and engagement of updates to teams is also critical.
Flexible Engagement Plans: Develop engagement strategies that can be easily adapted based on stakeholder feedback and changing project requirements.
Use of Collaborative Tools: Implement digital tools that facilitate real-time collaboration and transparency. Tools like Jira and Confluence can help keep stakeholders informed and involved. Non-digital engagement tools may also be leveraged to fully engage with stakeholders, beyond one-way push communication. Assessment needs to be made of the openness and ability to engage regarding the change through the chosen channels.
Active Feedback Loops: Establish mechanisms for collecting and integrating stakeholder feedback continuously. This can be done through retrospectives, surveys, and informal check-ins.
Clear Communication Channels: Maintain open and clear communication channels to ensure that stakeholders can easily provide input and receive updates on project progress.
As mentioned previously, the change approach, including engagement approaches, need to take into account the broader organisational context of program, portfolio and enterprise levels. This may mean mapping out the various channels and how they can be used for different changes, stakeholders and organisational levels.
Supporting Agile Delivery Cadence
To align change management activities with agile delivery cadence, it’s essential to integrate them into the core agile events, such as PI (Program Increment) planning and demos. Here’s how:
PI Planning
PI planning, or program increment planning, is a critical event in the agile framework, where teams come together in the PI planning process to plan and commit to a set of objectives for the next increment. During PI planning sessions or PI planning events (including team breakouts), ensure that change management considerations are part of the discussion. This involves:
– Including Change Management Objectives within PI objectives and program vision: Ensure that change management objectives and organizational readiness are included in the PI planning agenda as a critical part of project management. This helps align the change activities with the overall delivery goals.
– Identifying Change Risks and Dependencies: Identify any dependencies related to the change initiative that may impact the delivery schedule and the overall agile release train. This ensures that potential risks are addressed early and do not disrupt the delivery process. Common considerations include the various people change impacts across the program and how they intersect or overlap
– Engaging Stakeholders: Involve key stakeholders in the PI planning sessions. This ensures that not just product managers but business stakeholders understand the change objectives and are committed to supporting the change initiative during the implementation process. PI planning is also a great opportunity to assess and see in action the level of engagement, support and potential leadership skills of key stakeholders to reach the common goals and business benefits.
Demos
Demos are an opportunity to showcase the progress of the agile teams and gather feedback from stakeholders as a part of the iteration plans and sprint planning. Use demos to communicate the benefits and progress of change initiatives within the entire agile release train. Engaging stakeholders in these demos can help them see the value and stay committed to the implementation plan. Here’s how:
– Highlighting Change Benefits: During demos, highlight the benefits of the change initiative and how it supports the overall product delivery goals. This helps stakeholders understand the value of the change and its impact on the project.
– Gathering Feedback: Use demos as an opportunity to gather feedback and user stories from stakeholders. This helps identify any concerns or areas for improvement and ensures that the change initiative remains aligned with stakeholder needs.
– Showcasing Progress: Showcase the progress of the change initiative during demos. This provides stakeholders with a clear understanding of how the change is evolving and the positive impact it is having on the project.
By embedding change management activities into these agile ceremonies, change managers can ensure that change initiatives are aligned with the delivery schedule and maintain stakeholder buy-in.
Implementing Change Activities as Small Experiments
One of the key principles of agile is to work in small increments and learn quickly. Change management activities can adopt this approach by implementing small experiments, such as:
Messaging
Test different communication messages to see which resonates best with stakeholders. Gather feedback and refine the messaging based on reactions. This iterative approach ensures that the communication strategy is effective and supports the change initiative. Consider the following:
– A/B Testing: Use A/B testing to evaluate different messages. This involves sending two variations of a message to different stakeholder groups and comparing the responses to determine which one is more effective.
– Feedback Collection: Collect feedback from stakeholders on the messaging. This can be done through surveys, focus groups, or informal conversations.
– Message Refinement: Refine the messaging based on the feedback received. This ensures that the communication remains relevant and impactful.
Stakeholder Involvement
Experiment with various levels of stakeholder involvement to determine the most effective way to engage them. Use these insights to inform future engagement and risk management strategies and your overall implementation strategy. Here’s how:
– Pilot Programs: Implement pilot programs with small groups of stakeholders to test different involvement strategies. This provides valuable insights into what works best and helps refine the engagement approach.
– Engagement Metrics: Track engagement metrics to evaluate the effectiveness of different involvement strategies. This includes participation rates, feedback quality, and overall stakeholder satisfaction.
– Iterative Adjustments: Make iterative adjustments to the involvement strategies based on the insights gained. This ensures that stakeholder engagement remains effective and aligned with the change initiative.
By treating change activities as experiments, change managers can adapt quickly to what works best, ensuring a smoother integration with the agile delivery process.
Best Practices for Integrating Change Management with Agile
Successfully integrating change management with agile methodologies requires a strategic approach. Here are some best practices to consider:
Foster Collaboration
Encourage collaboration between change managers and agile teams, as well as key business stakeholders within the business context. This helps ensure that different disciplines and functions are aligned and working towards the same goals. Consider the following strategies:
– Joint Planning Sessions: Conduct joint planning sessions to align change management activities with agile delivery approaches and schedules. This ensures that both disciplines are working towards the same objectives.
– Regular Communication: Establish regular communication channels between change managers and agile teams. This helps keep everyone informed and ensures that any issues or concerns are addressed promptly. Specifically focus on various agile roles such as UX (user experience), business analysis, testing, and portfolio management. There are key intersections of change work and each of these disciplines, beyond general project planning and coordination.
The below is an example of a portfolio level adoption dashboard from The Change Compass.
Change Data-Driven Insights is absolutely a Must-have for SAFe
In SAFe, change management driven by data insights is critical to ensure that changes are not only effective but also efficient and sustainable. Data-driven change management leverages quantitative and qualitative data to guide decisions, optimize processes, and align strategic goals across the organization. By incorporating metrics and analytics, organizations can gain a comprehensive understanding of the impact and progress of change initiatives, allowing for timely adjustments and informed decision-making.
At the portfolio level within a SAFe setting, data-driven insights are essential for prioritizing initiatives and allocating resources effectively. More than this, change data including stakeholder capability, readiness and impact levels can be critical to determine when releases should happen, the priority of releases, and the sequencing of releases.
Ill-prepared or insufficiently skilled stakeholders may require longer time to adapt to the change. Also, looking beyond the project itself, by understanding the overall change landscape for the impacted stakeholders, change releases may need to be chunked and packaged accordingly to maximise adoption success.
Key attention should also be paid to the impact on business performance of impacted stakeholders, not just from a change volume perspective, but also from a strategy perspective in terms of how best to reduce risk of performance disruptions. Is it through exemplary middle leadership? Or frontline engagement? Or the power of change champions embedded across the business?
At the enterprise level, data-driven change management enables organizations to scale agile practices consistently and coherently across the entire team across multiple portfolios. This involves the use of enterprise-level dashboards and analytics tools that provide a holistic view of the organization’s agile transformation. Key performance indicators (KPIs) such as employee impact data, adoption rates, readiness metrics and productivity metrics help leaders assess the effectiveness of change initiatives and identify areas that require additional support or intervention. For instance, tracking the adoption rate of agile practices across different departments can highlight areas where additional training or coaching is needed to ensure consistent implementation.
Integrating change management with scaled agile methodologies is essential for seamless product delivery in today’s dynamic business environment. By creating agile-style deliverable artefacts early, continuously adapting engagement activities, supporting agile delivery cadence, and implementing change activities as small experiments, measure change progress and outcomes, change managers can effectively support agile product delivery. This integration not only enhances the success of change initiatives but also ensures that product delivery is seamless and aligned with organizational goals and the strategic plan.
By fostering collaboration, embracing agile principles, and using data-driven insights, change managers can create a cohesive strategy that maximizes the benefits of both change management and agile methodologies. This holistic approach ensures that change initiatives are successful, stakeholders are engaged, and product delivery is efficient and effective.
Chat to us to find out more about how to leverage the power of a change measurement platform to sustain your single source of truth to support your scaled agile organisation.