program implement planning

A Guide on Integrating Change Management with Scaled Agile for Seamless Product Delivery – Part 1
by | Agile, Guides, Uncategorized
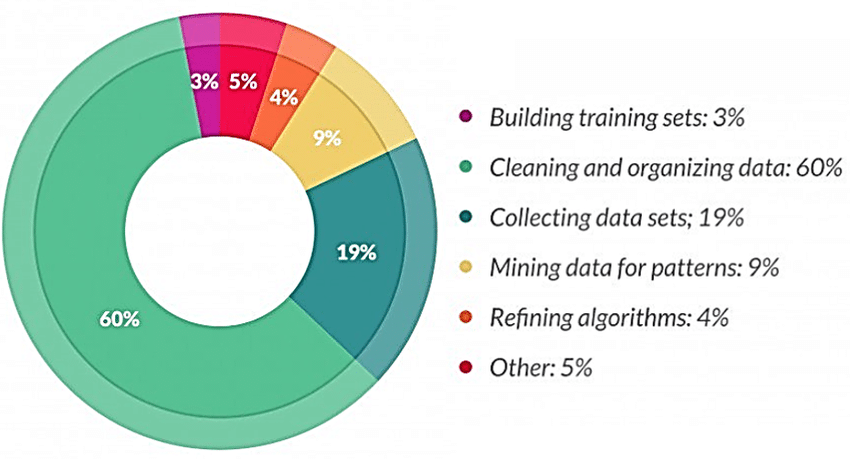
The need for organizations to remain flexible and responsive to market demands has never been more critical, and scaled agile (SAFe) provide the framework to achieve this. Integrating change management work with SAFe is essential for seamless product delivery but yet is not clearly articulated in literature. However, for agile product delivery to be successful, it must be supported by robust change management work steps. Those that not ensures that all stakeholders are aligned and engaged throughout the process and also that the consecutive changes delivered are adopted. Let’s explore how change managers can effectively integrate their approaches with scaled agile methodologies to enhance product delivery.
Understanding the Intersection of Change Management and Agile
Change management and agile methodologies both aim to facilitate successful project outcomes, but they approach this goal from different angles. Change management focuses on the people side of change, ensuring that stakeholders are prepared, equipped, and supported throughout the transition through to benefit realisation. Agile methodologies, on the other hand, emphasize iterative development, continuous feedback, and rapid adaptation to change.
Whilst SAFe acknowledges the importance of managing the people side of change and leading the change, it does not spell out how exactly this work should be integrated with the methodology in a detailed manner. References to change tends to be at a high level and focuses on communication and readiness activities.
What are key call outs of the SAFe methodology:
1) Lean-Agile Principles: SAFe is grounded in Lean-Agile principles such as building incrementally with fast, integrated learning cycles, basing milestones on objective evaluation, and making value flow without interruptions. These principles help ensure continuous improvement and adaptability
2) Organizational Agility: To remain competitive, enterprises must be agile. SAFe enhances organizational agility by fostering Lean-thinking people and Agile teams, promoting strategic agility, and implementing Lean business operations
3) Lean Portfolio Management: Aligns strategy and execution by applying Lean and systems thinking. It includes strategy and investment funding, Agile portfolio operations, and Lean governance to ensure that the portfolio is aligned and funded to meet business goals
4) Continuous Learning Culture: Encourages a set of values and practices that promote ongoing learning and improvement. This culture is crucial for adapting to changes and fostering innovation within the organization
5) Agile Teams: Agile teams in SAFe operate using methods like SAFe Scrum or SAFe Team Kanban. These teams are responsible for understanding customer needs, planning their work, and delivering value continuously through iterative processes
6) Built-in Quality: Emphasizes the importance of quality at all stages of development. Practices include shift-left testing, peer reviews, and automation to ensure high standards and reduce defects early in the process
7) Value Stream Management (VSM): Focuses on optimizing the flow of value across the entire portfolio. VSM helps organizations improve their value delivery processes by managing and monitoring value streams effectively (Scaled Agile Framework).
8) Lean-Agile Leadership: Leaders play a critical role in fostering a Lean-Agile mindset. They must model the values and principles of SAFe, provide guidance, and create an environment that supports Agile teams and continuous improvement
9) Decentralized Decision-Making: Promotes faster value delivery by empowering teams to make decisions locally. This reduces delays, enhances product development flow, and fosters innovation
10) Customer-Centric Approach: Agile teams are encouraged to maintain close collaboration with customers to understand their needs better and ensure that solutions deliver real value. Techniques like direct customer interaction and feedback loops are essential
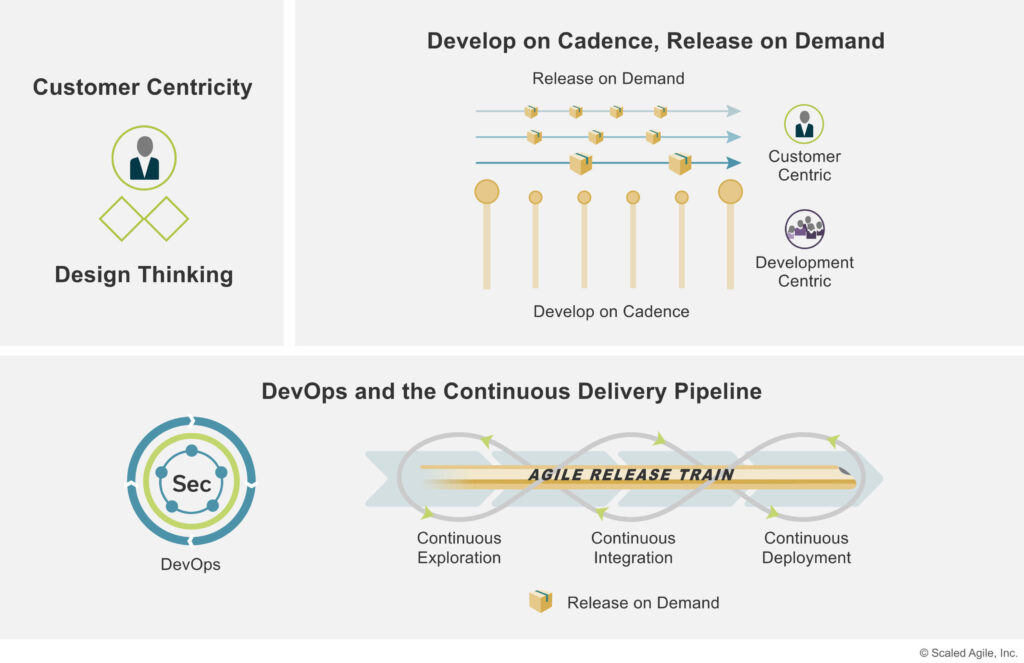
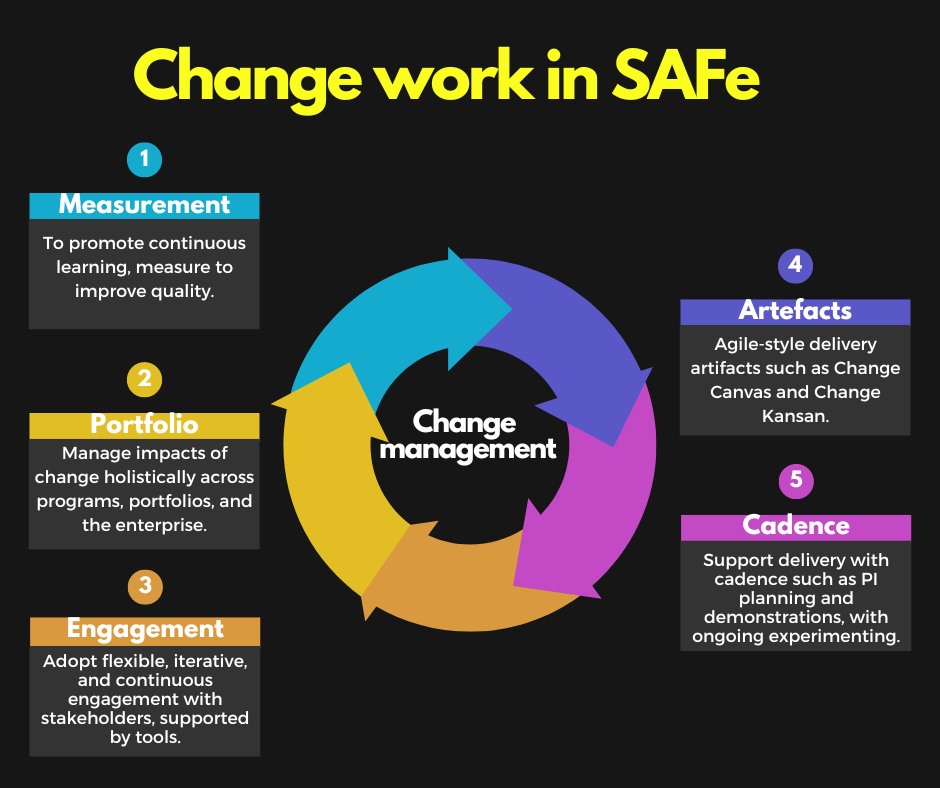
Below is a diagram from Scaled Agile Frameworks on key elements of a scaled agile product delivery framework.
Agile-Style Deliverable Artefacts
To support agile product delivery, change managers need to create agile-style deliverable artefacts early in the product delivery cycle. These artefacts serve as essential tools for aligning the team, stakeholders, and the overall change initiative with agile principles. They are significantly ‘lighter’ in volume and more succinct in focusing on key analysis points that determine approaches and actions required to plan and implement the change.
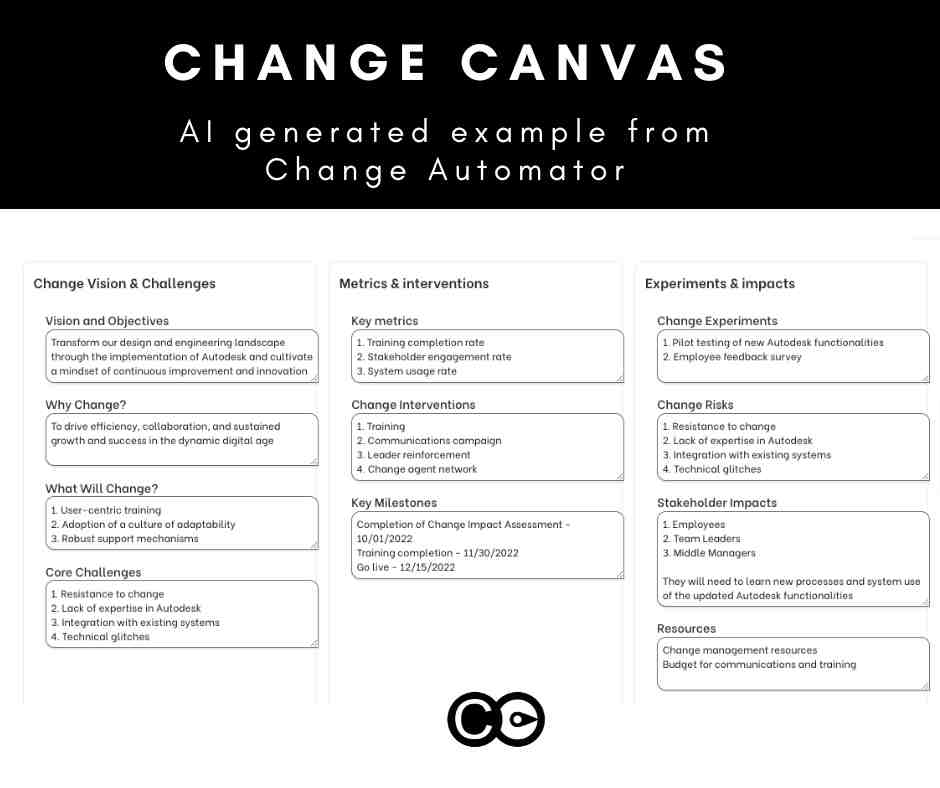
Change artefact 1: Change Canvas
An Agile Change Canvas is a strategic tool designed to plan, manage, and communicate change initiatives effectively within an organization. It begins with basic identification details such as the Project Name, Business Owner, and Author. This section ensures clear accountability and ownership from the outset.
The Change Vision & Objectives outlines the overarching project objectives and intended outcomes of the project. This architecture vision acts as a guiding star, ensuring all actions align with the desired future state of the organization. Following this, Core Challenges are identified to highlight potential obstacles that could impede progress. Recognizing these challenges early allows for proactive mitigation strategies.
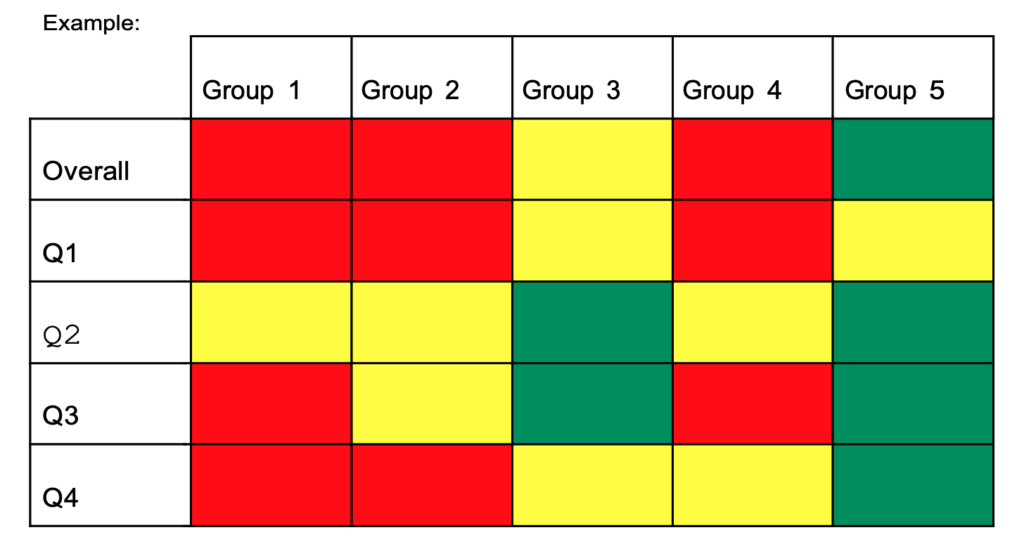
Stakeholder Impacts analyses how different stakeholders will be affected by the change. This includes assessing both the positive and negative impacts on employees, customers, and shareholders, ensuring that their concerns are addressed and their needs met.
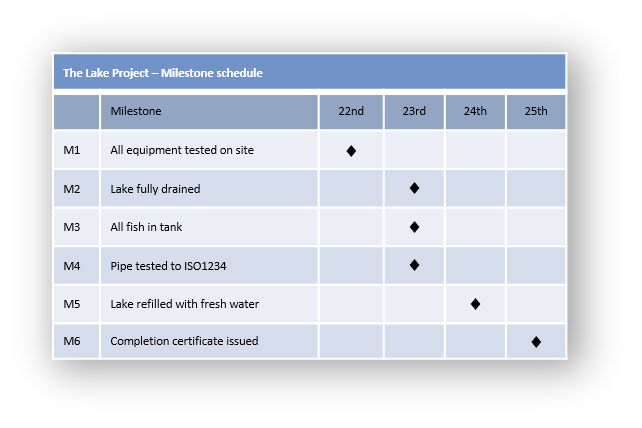
The Key Milestones section, presented in a table format, outlines significant checkpoints in the project timeline, often represented in Gantt charts. Each milestone is associated with a particular function, ensuring that progress is measurable and trackable. Similarly, the Resources section details the necessary financial, human, and technological resources required to implement the change, ensuring that the project scope statement is adequately supported.
Why Change section provides the rationale behind the need for change, which could include market demands, competitive pressures, or internal inefficiencies. This section justifies the project’s existence and urgency. Complementarily, What Will Change (WWC) describes the specific changes to be implemented, including processes, technologies, behaviours, and structures, offering a clear picture of the project’s scope.
Key Metrics are identified to measure the success of the change initiative. These metrics are both quantitative and qualitative, providing a comprehensive view of the project’s impact. Change Interventions listed in a table format, detail specific actions or initiatives designed to facilitate the change, ensuring a structured approach to implementation.
To foster a culture of innovation and adaptation, Change Experiments are proposed. These pilot programs test aspects of the change in a controlled environment before full-scale implementation. Finally, Change Risks identifies potential risks associated with the change and outlines strategies for mitigating these risks, ensuring that the project can navigate potential pitfalls effectively.
By incorporating these elements, the Agile Change Canvas provides a comprehensive framework for managing change initiatives, ensuring that all critical aspects are considered, planned for, and communicated effectively to stakeholders.
For a template of the Change Canvas check it out here.
Change artefact 2: Kanban boards of Changes
Using a Kanban board for change management activities provides a visual and dynamic method for tracking, prioritizing, and managing the flow of work while implementing changes. A Kanban board typically consists of columns that represent different stages of work, such as “To Do,” “In Progress,” and “Done.” For change management, additional columns might include “Proposed Changes,” “Under Review,” “Implementation Planning,” and “Monitoring.”
Whilst most change practitioners are used to kanban boards In working with various change management activities, there is opportunity to use kanban to plan and prioritise a series of agile-style changes and the associated change activities with each change. These ‘change cards’ within the kanban board presents a clear way to visualise a series of changes across the ‘delivery train’ where the project team continuously delivers pieces of change.
Prioritizing Change Management Activities
- Visualizing Workflow:
- Proposed Changes: This column lists all suggested changes, each represented by a card detailing the change’s purpose, impacted areas, and expected benefits.
- Under Review: Changes move here once they are being evaluated for feasibility, risks, and alignment with project goals.
- Implementation Planning: Approved changes are further detailed, including resource allocation, timelines, and specific tasks needed for implementation.
- In Progress: Changes that are actively being worked on are tracked here, showing current status and any blockers encountered.
- Monitoring: Recently implemented changes are monitored to ensure they are delivering the expected outcomes and to identify any issues early.
- Done: Fully implemented and stabilized changes are moved here, marking their successful completion.
- Setting Priorities:
- Value and Impact: In conjunction with the project team prioritize changes based on their potential value and impact. High-value changes that significantly improve project outcomes or stakeholder satisfaction should be addressed first. From a change perspective, the input here is about the readiness of the stakeholder to receive the change, and what timing and work is required to get there.
- Urgency and Dependencies: Changes that unblock other work or are time-sensitive should be prioritized. Dependencies between changes must be mapped to ensure logical sequencing. For example, work required to lift capability/leadership or readiness may be critical dependencies, without which the change cannot be delivered successfully.
- Feasibility and Risk: Assess the feasibility and risks associated with each change. High-risk assessment of changes might require more careful planning and monitoring but should not necessarily be deprioritized if their impact is critical. The change input here is the people impact for the impacted stakeholders with other changes not just within this project/program, but with the overall portfolio or even outside the portfolio (including business-driven changes).
- Proposed Changes: This column lists all suggested changes, each represented by a card detailing the change’s purpose, impacted areas, and expected benefits.
- Under Review: Changes move here once they are being evaluated for feasibility, risks, and alignment with project goals.
- Implementation Planning: Approved changes are further detailed, including resource allocation, timelines, and specific tasks needed for implementation.
- In Progress: Changes that are actively being worked on are tracked here, showing current status and any blockers encountered.
- Monitoring: Recently implemented changes are monitored to ensure they are delivering the expected outcomes and to identify any issues early.
- Done: Fully implemented and stabilized changes are moved here, marking their successful completion.
- Value and Impact: In conjunction with the project team prioritize changes based on their potential value and impact. High-value changes that significantly improve project outcomes or stakeholder satisfaction should be addressed first. From a change perspective, the input here is about the readiness of the stakeholder to receive the change, and what timing and work is required to get there.
- Urgency and Dependencies: Changes that unblock other work or are time-sensitive should be prioritized. Dependencies between changes must be mapped to ensure logical sequencing. For example, work required to lift capability/leadership or readiness may be critical dependencies, without which the change cannot be delivered successfully.
- Feasibility and Risk: Assess the feasibility and risks associated with each change. High-risk changes might require more careful planning and monitoring but should not necessarily be deprioritized if their impact is critical. The change input here is the people impact for the impacted stakeholders with other changes not just within this project/program, but with the overall portfolio or even outside the portfolio (including business-driven changes).
Ordering Change Planning and Implementation
Collaborative Planning:
Engage stakeholders and team members in planning sessions to discuss and agree on the priority of changes. This collaborative approach ensures that all perspectives are considered and that there is buy-in from those affected by the changes. This includes change champions.
Regular Review and Adaptation:
The Kanban board should be regularly reviewed and updated, within the change team and within the project team. During these reviews, re-prioritize changes based on new information, shifting project needs, and feedback from implemented changes. This iterative approach aligns with Agile principles of flexibility and continuous improvement.
Limit Work in Progress (WIP):
To avoid overloading the change team and ensure focus, limit the number of changes in progress at any given time. This constraint encourages the team to complete current tasks before taking on new ones, promoting a steady and manageable workflow.
Use Metrics and Feedback:
- Utilize metrics such as cycle time (how long a change takes to move from start to finish, from awareness to engagement to eventual adoption) and work with the project team on the throughput (how many changes are completed in a specific timeframe) to assess the efficiency of the change management process. For example, based on the size and complexity of each discrete piece of change delivered, how long did this take and what was the deviance from actual time period planned? Feedback from these metrics should inform decisions about prioritization and process adjustments.
- Engage stakeholders and team members in planning sessions to discuss and agree on the priority of changes. This collaborative approach ensures that all perspectives are considered and that there is buy-in from those affected by the changes. This includes change champions.
- The Kanban board should be regularly reviewed and updated, within the change team and within the project team. During these reviews, re-prioritize changes based on new information, shifting project needs, and feedback from implemented changes. This iterative approach aligns with Agile principles of flexibility and continuous improvement.
- To avoid overloading the change team and ensure focus, limit the number of changes in progress at any given time. This constraint encourages the team to complete current tasks before taking on new ones, promoting a steady and manageable workflow.
- Utilize metrics such as cycle time (how long a change takes to move from start to finish, from awareness to engagement to eventual adoption) and work with the project team on the throughput (how many changes are completed in a specific timeframe) to assess the efficiency of the change management process. For example, based on the size and complexity of each discrete piece of change delivered, how long did this take and what was the deviance from actual time period planned? Feedback from these metrics should inform decisions about prioritization and process adjustments.
Benefits of Using Kanban for Change Management
Implementing a Kanban board for change management in Agile projects offers several benefits:
- Transparency: Everyone involved can see the status of change activities, leading to better communication and coordination.
- Flexibility: The board can be easily adjusted to reflect changing priorities and project dynamics.
- Focus: Limiting WIP helps the team maintain focus and reduces the risk of burnout and task switching.
- Continuous Improvement: Regular reviews and adaptations promote a culture of continuous improvement, ensuring that change management processes evolve and improve over time.
Change artefact example 3: Change Impact Assessment
A Change Impact Assessment (CIA) is an essential component in managing organizational change, particularly in agile projects where the focus is on iterative and incremental improvements. The assessment helps to understand the scope and magnitude of the change, identify affected stakeholders, and plan interventions to manage impacts effectively. An agile-friendly CIA is more summarised, and gets to the heart of what the impact is, who is impacted, how, to what extent, and when.
Below are the core elements of a change impact assessment, with a comparison to traditional methods:
1. Identifying the Impacts
Agile Approach: In scaled agile projects, the impact identification is ongoing and iterative. Each sprint or iteration is reviewed to assess the impacts of delivered changes. This dynamic approach ensures that emerging impacts are quickly recognized and addressed.
Traditional Approach: Impact identification is typically conducted at the beginning of the project, with periodic reviews. This method can be less responsive to new impacts discovered during the project lifecycle.
2. Stakeholder Identification and Analysis
Agile Approach: Continuous stakeholder engagement is crucial. Stakeholders are regularly consulted, and their feedback is integrated into the process. Agile methods ensure that stakeholders’ changing needs and concerns are promptly addressed.
Traditional Approach: Stakeholder analysis is often conducted early in the project, with limited ongoing engagement. This can result in less adaptability to stakeholders’ evolving requirements.
3. Extent and Nature of Impacts
Agile Approach: The extent of impacts is assessed incrementally, considering the cumulative effect of changes over multiple iterations. This allows for a nuanced understanding of how impacts evolve over time.
Traditional Approach: Typically focuses on a comprehensive initial assessment, with less emphasis on the evolution of impacts throughout the project.
4. Timing of Impacts
Agile Approach: Timing is aligned with the iterative delivery schedule. The impacts are mapped to specific iterations or sprints, allowing for precise planning and mitigation.
Traditional Approach: Timing is generally assessed at the project level, which can make it harder to pinpoint when specific impacts will occur during the project lifecycle.
Typical Sections of an Agile Change Impact Assessment
- Impact Overview:
- Explanation: Summarizes the nature and scope of the change, providing a high-level view of the anticipated impacts.
- Agile Twist: Updated regularly with each iteration to reflect new findings and emerging impacts.
- Stakeholder Impact Analysis:
- Explanation: Identifies who will be affected by the change and how. It details the extent of the impact on different stakeholder groups.
- Agile Twist: Involves continuous stakeholder feedback and updates to capture evolving impacts.
- Impact Extent and Nature:
- Explanation: Describes the extent (e.g., minor, moderate, significant) and nature (e.g., process, technology, cultural) of the impacts.
- Agile Twist: Assessed incrementally, considering both immediate and long-term impacts across iterations.
- Impact Timing:
- Explanation: Specifies when the impacts are expected to occur, mapped to the project timeline.
- Agile Twist: Aligned with sprint or iteration schedules, allowing for detailed timing predictions.
- Mitigation Strategies:
- Explanation: Outlines plans to manage and mitigate identified impacts.
- Agile Twist: Adaptive strategies that are refined continuously based on iteration reviews and stakeholder feedback.
- Monitoring and Review:
- Explanation: Describes how the impacts will be monitored and reviewed throughout the project.
- Agile Twist: Continuous monitoring with iteration-end reviews to ensure timely identification and management of impacts.
- Explanation: Summarizes the nature and scope of the change, providing a high-level view of the anticipated impacts.
- Agile Twist: Updated regularly with each iteration to reflect new findings and emerging impacts.
- Explanation: Identifies who will be affected by the change and how. It details the extent of the impact on different stakeholder groups.
- Agile Twist: Involves continuous stakeholder feedback and updates to capture evolving impacts.
- Explanation: Describes the extent (e.g., minor, moderate, significant) and nature (e.g., process, technology, cultural) of the impacts.
- Agile Twist: Assessed incrementally, considering both immediate and long-term impacts across iterations.
- Explanation: Specifies when the impacts are expected to occur, mapped to the project timeline.
- Agile Twist: Aligned with sprint or iteration schedules, allowing for detailed timing predictions.
- Explanation: Outlines plans to manage and mitigate identified impacts.
- Agile Twist: Adaptive strategies that are refined continuously based on iteration reviews and stakeholder feedback.
- Explanation: Describes how the impacts will be monitored and reviewed throughout the project.
- Agile Twist: Continuous monitoring with iteration-end reviews to ensure timely identification and management of impacts.
To read more about agile tools for change managers, check out Five Agile Change Tool Kits.
Stakeholder Engagement in a Scaled Agile Environment
Planning and designing stakeholder engagement activities in a scaled agile environment requires a dynamic, iterative approach that contrasts significantly with traditional, non-agile methods. In SAFe, the focus is on continuous collaboration, transparency, and adaptability, ensuring that stakeholders are actively involved throughout the project lifecycle.
Iterative and Continuous Engagement
Scaled Agile Approach: Stakeholder engagement is an ongoing process. Agile frameworks emphasize regular touchpoints, such as sprint reviews, planning meetings, and daily stand-ups, where stakeholders can provide feedback and stay informed about progress. These frequent interactions ensure that stakeholder input is continuously integrated, enabling swift adjustments and alignment with evolving needs. This iterative approach fosters a collaborative environment where stakeholders feel valued and engaged throughout the project. Engagement rhythms and processes should also be established not just at a project, but program, portfolio and enterprise levels as required.
Non-Agile Approach: Traditional methodologies often involve stakeholder engagement at fixed points in the project timeline, such as during initial requirements gathering, major milestone reviews, and final project delivery. This approach can lead to periods of limited communication and delayed feedback, which may result in misaligned expectations and missed opportunities for timely course corrections.
Flexibility and Adaptation
Scaled Agile Approach: Agile projects embrace change, allowing stakeholder engagement activities to be flexible and adaptive. As project requirements evolve, the engagement strategy can be adjusted to address new priorities or challenges. This flexibility ensures that stakeholder needs are consistently met, and any concerns are promptly addressed. Agile frameworks encourage a culture of openness and continuous improvement, where stakeholder feedback directly influences the direction of the project. Change managers need to ensure that stakeholder understand this fully, and have the skills to work within this context, not just with the project team but in leading their teams through change, when ‘the change’ may be constantly shifting.
Non-Agile Approach: In contrast, traditional approaches tend to follow a rigid engagement plan that is set at the project’s outset. While this provides a clear structure, it can be less responsive to changing stakeholder needs or external conditions. Adjusting the engagement strategy mid-project can be challenging and may require significant effort, leading to delays and potential dissatisfaction among stakeholders.
Collaborative Tools and Techniques
Scaled Agile Approach: Agile environments leverage a variety of collaborative tools and techniques to enhance stakeholder engagement. Digital platforms such as Jira, Confluence, and Miro facilitate real-time collaboration, transparency, and documentation. Agile ceremonies, such as retrospectives and demos, provide structured opportunities for stakeholders to participate and contribute. These tools and techniques help maintain a high level of engagement and ensure that stakeholders have a clear view of project progress and challenges.
Non-Agile Approach: Traditional methods might rely more heavily on formal documentation and periodic reports for stakeholder communication. While these methods ensure thorough documentation, they can sometimes create barriers to real-time collaboration and immediate feedback. Meetings and reviews are often scheduled infrequently, which can lead to less dynamic interaction compared to agile practices.
Planning Stakeholder Engagement Activities
- Regular Touchpoints: Schedule frequent meetings and reviews to ensure continuous stakeholder involvement. Examples include sprint reviews, iteration planning meetings, and daily stand-ups. Business-led rhythm that enable the dissemination and engagement of updates to teams is also critical.
- Flexible Engagement Plans: Develop engagement strategies that can be easily adapted based on stakeholder feedback and changing project requirements.
- Use of Collaborative Tools: Implement digital tools that facilitate real-time collaboration and transparency. Tools like Jira and Confluence can help keep stakeholders informed and involved. Non-digital engagement tools may also be leveraged to fully engage with stakeholders, beyond one-way push communication. Assessment needs to be made of the openness and ability to engage regarding the change through the chosen channels.
- Active Feedback Loops: Establish mechanisms for collecting and integrating stakeholder feedback continuously. This can be done through retrospectives, surveys, and informal check-ins.
- Clear Communication Channels: Maintain open and clear communication channels to ensure that stakeholders can easily provide input and receive updates on project progress.
As mentioned previously, the change approach, including engagement approaches, need to take into account the broader organisational context of program, portfolio and enterprise levels. This may mean mapping out the various channels and how they can be used for different changes, stakeholders and organisational levels.
Supporting Agile Delivery Cadence
To align change management activities with agile delivery cadence, it’s essential to integrate them into the core agile events, such as PI (Program Increment) planning and demos. Here’s how:
PI Planning
PI planning, or program increment planning, is a critical event in the agile framework, where teams come together in the PI planning process to plan and commit to a set of objectives for the next increment. During PI planning sessions or PI planning events (including team breakouts), ensure that change management considerations are part of the discussion. This involves:
– Including Change Management Objectives within PI objectives and program vision: Ensure that change management objectives and organizational readiness are included in the PI planning agenda as a critical part of project management. This helps align the change activities with the overall delivery goals.
– Identifying Change Risks and Dependencies: Identify any dependencies related to the change initiative that may impact the delivery schedule and the overall agile release train. This ensures that potential risks are addressed early and do not disrupt the delivery process. Common considerations include the various people change impacts across the program and how they intersect or overlap
– Engaging Stakeholders: Involve key stakeholders in the PI planning sessions. This ensures that not just product managers but business stakeholders understand the change objectives and are committed to supporting the change initiative during the implementation process. PI planning is also a great opportunity to assess and see in action the level of engagement, support and potential leadership skills of key stakeholders to reach the common goals and business benefits.
Demos
Demos are an opportunity to showcase the progress of the agile teams and gather feedback from stakeholders as a part of the iteration plans and sprint planning. Use demos to communicate the benefits and progress of change initiatives within the entire agile release train. Engaging stakeholders in these demos can help them see the value and stay committed to the implementation plan. Here’s how:
– Highlighting Change Benefits: During demos, highlight the benefits of the change initiative and how it supports the overall product delivery goals. This helps stakeholders understand the value of the change and its impact on the project.
– Gathering Feedback: Use demos as an opportunity to gather feedback and user stories from stakeholders. This helps identify any concerns or areas for improvement and ensures that the change initiative remains aligned with stakeholder needs.
– Showcasing Progress: Showcase the progress of the change initiative during demos. This provides stakeholders with a clear understanding of how the change is evolving and the positive impact it is having on the project.
By embedding change management activities into these agile ceremonies, change managers can ensure that change initiatives are aligned with the delivery schedule and maintain stakeholder buy-in.
Implementing Change Activities as Small Experiments
One of the key principles of agile is to work in small increments and learn quickly. Change management activities can adopt this approach by implementing small experiments, such as:
Messaging
Test different communication messages to see which resonates best with stakeholders. Gather feedback and refine the messaging based on reactions. This iterative approach ensures that the communication strategy is effective and supports the change initiative. Consider the following:
– A/B Testing: Use A/B testing to evaluate different messages. This involves sending two variations of a message to different stakeholder groups and comparing the responses to determine which one is more effective.
– Feedback Collection: Collect feedback from stakeholders on the messaging. This can be done through surveys, focus groups, or informal conversations.
– Message Refinement: Refine the messaging based on the feedback received. This ensures that the communication remains relevant and impactful.
Stakeholder Involvement
Experiment with various levels of stakeholder involvement to determine the most effective way to engage them. Use these insights to inform future engagement and risk management strategies and your overall implementation strategy. Here’s how:
– Pilot Programs: Implement pilot programs with small groups of stakeholders to test different involvement strategies. This provides valuable insights into what works best and helps refine the engagement approach.
– Engagement Metrics: Track engagement metrics to evaluate the effectiveness of different involvement strategies. This includes participation rates, feedback quality, and overall stakeholder satisfaction.
– Iterative Adjustments: Make iterative adjustments to the involvement strategies based on the insights gained. This ensures that stakeholder engagement remains effective and aligned with the change initiative.
By treating change activities as experiments, change managers can adapt quickly to what works best, ensuring a smoother integration with the agile delivery process.
Best Practices for Integrating Change Management with Agile
Successfully integrating change management with agile methodologies requires a strategic approach. Here are some best practices to consider:
Foster Collaboration
Encourage collaboration between change managers and agile teams, as well as key business stakeholders within the business context. This helps ensure that different disciplines and functions are aligned and working towards the same goals. Consider the following strategies:
– Joint Planning Sessions: Conduct joint planning sessions to align change management activities with agile delivery approaches and schedules. This ensures that both disciplines are working towards the same objectives.
– Regular Communication: Establish regular communication channels between change managers and agile teams. This helps keep everyone informed and ensures that any issues or concerns are addressed promptly. Specifically focus on various agile roles such as UX (user experience), business analysis, testing, and portfolio management. There are key intersections of change work and each of these disciplines, beyond general project planning and coordination.
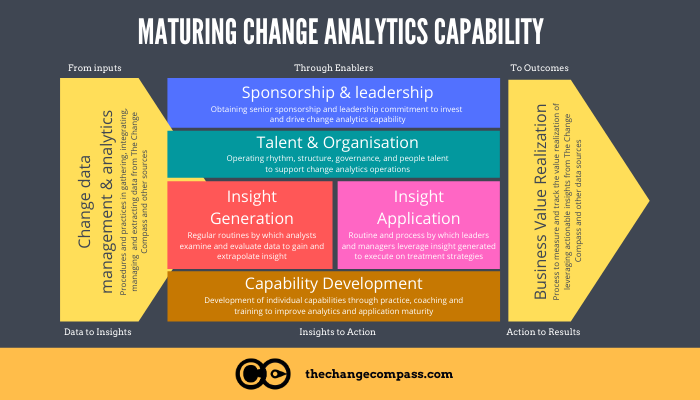
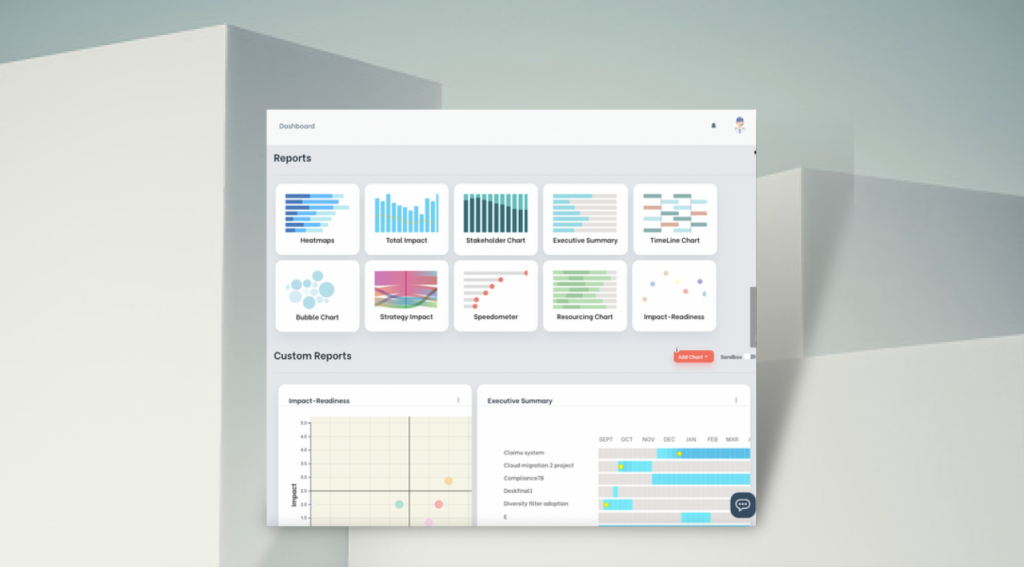
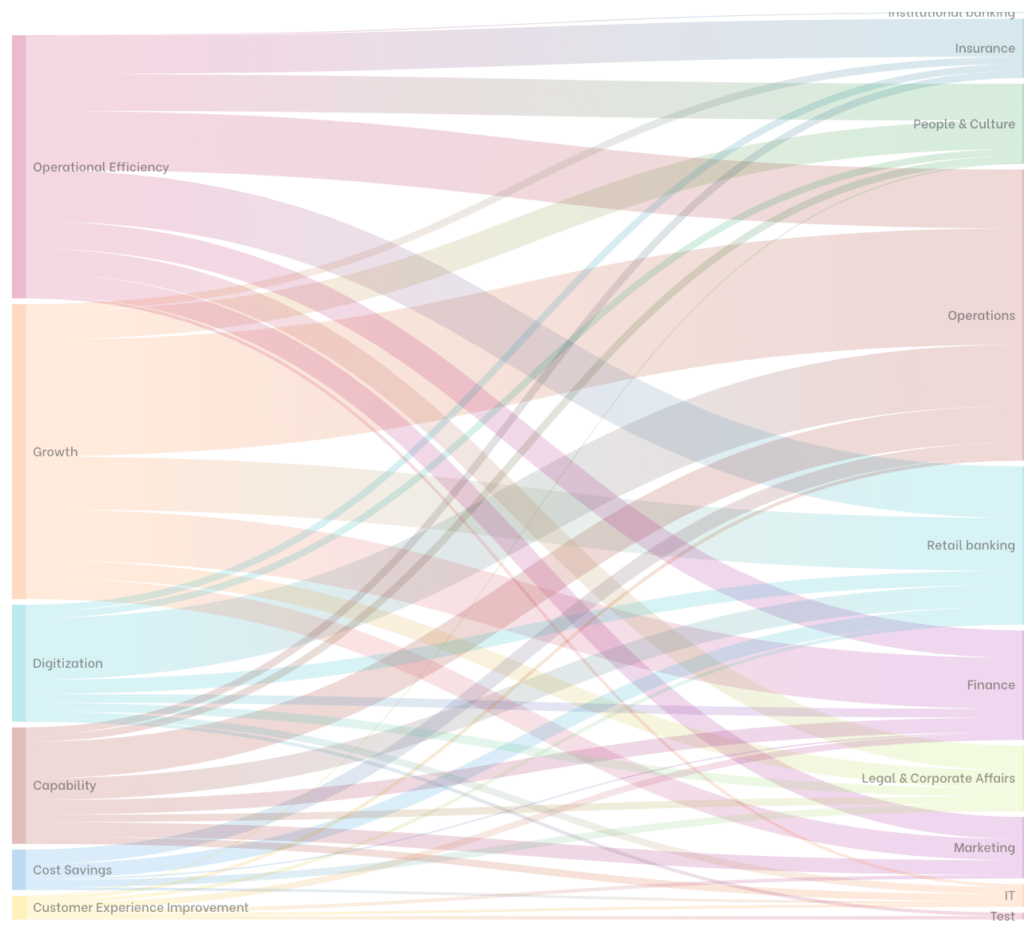
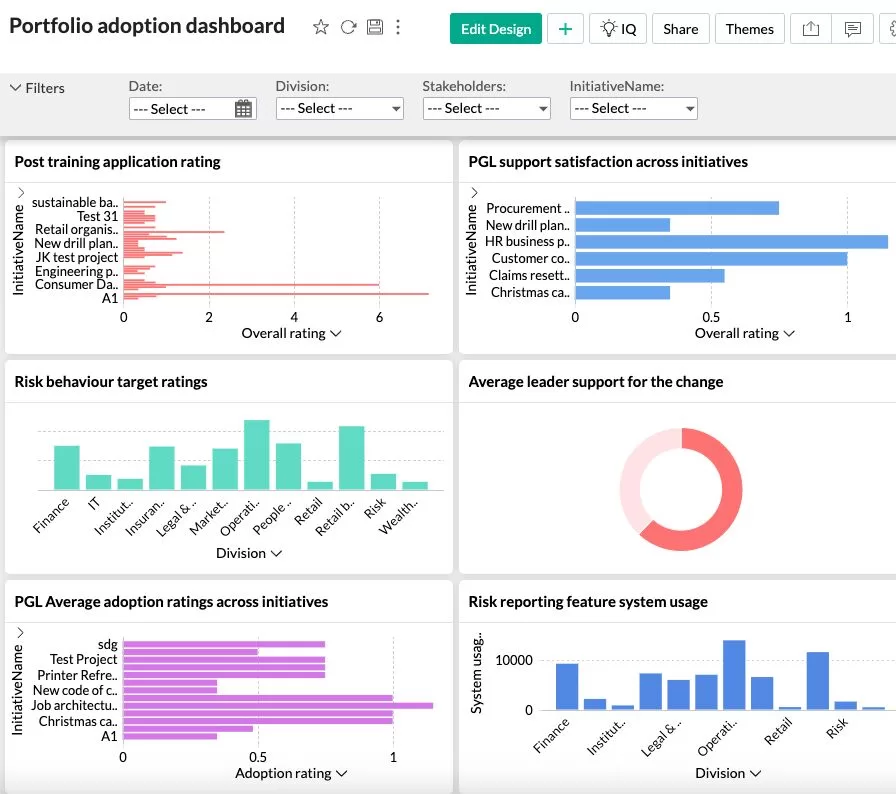
The below is an example of a portfolio level adoption dashboard from The Change Compass.

Change Data-Driven Insights is absolutely a Must-have for SAFe
In SAFe, change management driven by data insights is critical to ensure that changes are not only effective but also efficient and sustainable. Data-driven change management leverages quantitative and qualitative data to guide decisions, optimize processes, and align strategic goals across the organization. By incorporating metrics and analytics, organizations can gain a comprehensive understanding of the impact and progress of change initiatives, allowing for timely adjustments and informed decision-making.
At the portfolio level within a SAFe setting, data-driven insights are essential for prioritizing initiatives and allocating resources effectively. More than this, change data including stakeholder capability, readiness and impact levels can be critical to determine when releases should happen, the priority of releases, and the sequencing of releases.
Ill-prepared or insufficiently skilled stakeholders may require longer time to adapt to the change. Also, looking beyond the project itself, by understanding the overall change landscape for the impacted stakeholders, change releases may need to be chunked and packaged accordingly to maximise adoption success.
Key attention should also be paid to the impact on business performance of impacted stakeholders, not just from a change volume perspective, but also from a strategy perspective in terms of how best to reduce risk of performance disruptions. Is it through exemplary middle leadership? Or frontline engagement? Or the power of change champions embedded across the business?
At the enterprise level, data-driven change management enables organizations to scale agile practices consistently and coherently across the entire team across multiple portfolios. This involves the use of enterprise-level dashboards and analytics tools that provide a holistic view of the organization’s agile transformation. Key performance indicators (KPIs) such as employee impact data, adoption rates, readiness metrics and productivity metrics help leaders assess the effectiveness of change initiatives and identify areas that require additional support or intervention. For instance, tracking the adoption rate of agile practices across different departments can highlight areas where additional training or coaching is needed to ensure consistent implementation.
Integrating change management with scaled agile methodologies is essential for seamless product delivery in today’s dynamic business environment. By creating agile-style deliverable artefacts early, continuously adapting engagement activities, supporting agile delivery cadence, and implementing change activities as small experiments, measure change progress and outcomes, change managers can effectively support agile product delivery. This integration not only enhances the success of change initiatives but also ensures that product delivery is seamless and aligned with organizational goals and the strategic plan.
By fostering collaboration, embracing agile principles, and using data-driven insights, change managers can create a cohesive strategy that maximizes the benefits of both change management and agile methodologies. This holistic approach ensures that change initiatives are successful, stakeholders are engaged, and product delivery is efficient and effective.
To read more about Change Measurement, check out our library of articles here.
Chat to us to find out more about how to leverage the power of a change measurement platform to sustain your single source of truth to support your scaled agile organisation.
- Change Management in the Digital Age: Leveraging AI, Data, and Automation for Strategic Impact
- Rethinking Change Management Maturity—Why Traditional Capability-Building Falls Short
- How organisational change management software drives adoption
- Building Change Portfolio Literacy in Senior Leaders: A Practical Guide
- 7 Common Assumptions About Managing Multiple Changes That Are Wrong