We surveyed senior change practitioners on their key challenges
in using change data to generate insights, and here is what we found …
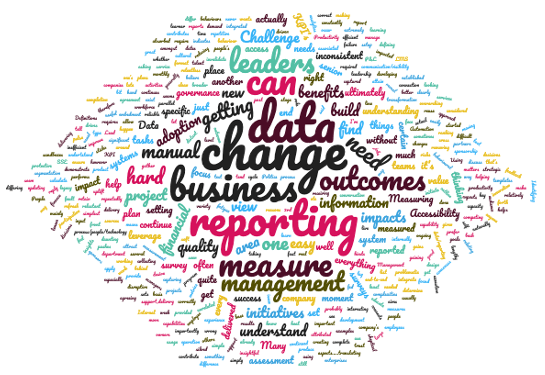
Change practitioners seem to face quite a lot of challenges across the board in measuring change and demonstrating the value of managing change. For many, there appears to be a level of angst and frustration in not being able to break through and demonstrate insight through change data in a clear and simple way.
Why did we survey this topic? In the new economy, our world is increasingly dominated by technology and data. More than ever data is all around us and our ability to access a range of data is becoming more prevalent. At our fingertips, we can access our phone to see how many steps we have taken today, work email and even workplace chat platforms.
In the business world, the same applies even more so. All facets of how business is being will increasingly be dominated by data. The availability of data. The insight that can be generated by data to make decisions. Data is king and a competitive advantage.
However, in change management, our ability to use data has mainly been restricted to ‘soft’ qualitative data. Of course, all types of data are useful both hard and soft data. However, most of our stakeholders who make decisions on project execution, funding, and prioritisation are focused on hard metrics. We really cannot blame them because hard metrics tell a direct compelling picture, whereas soft, qualitative data requires a level of interpretation and maybe less direct in the implication.
We surveyed a sample of senior change practitioners and received 30+ responses. After sorting through the feedback and responses we grouped them into the following 7 themes. We also directly address each of the challenges posed.
1. Getting buy-in from stakeholders on data input
Some mention the importance of stakeholder support and buy-in in collecting change data. This can be quite challenging if your stakeholder does not see the value of the change data that you are collecting. Since the bulk of change data is derived from each of the impacted businesses and those involved in the initiative, it is critical that the impacted stakeholders are supportive to ensure that data may be collected and response is sufficient.
A key element in ensuring that your stakeholder buy-in to your change data plans is to come up with a ‘sales pitch’ for them personally. Each stakeholder is concerned about their own priorities and challenges. If the change data can be positioned to address one of their pain points, then it will be hard to imagine any stakeholder who will not be interested.
2. How to measure cultural & behavioural change
This is probably the biggest challenge called out across
respondents. Most change practitioners
work on embedding some form of behaviour change. As a result, being able to measure the
behaviour change is critical to demonstrate the value of having a change
manager onboard and the value of change tactics.
And since most initiatives are not end-to-end transformations of everything within the organization, there is usually a limited set of behaviours that the initiative aims to change. Working on measuring a small set of behaviours can be challenging because it is not that we are measuring the whole culture of the organisation, which can be measured by culture inventories such as Organization Culture Inventory (OCI).
One way to do this is to start by defining the actual
behaviours you are trying to measure in very specific detail, in a way that is
behavioural and observable. For example,
customer service representatives will be able to resolve customer complaints in
the first contact without escalating to their team leader. This can easily be measured using the data
from the CRM system that the representative uses.
Then we can break this down into more discrete ‘micro-behaviours’ that will contribute to the overall behavioural outcome. For example, in this example, it could be 1) Establish rapport within the first 3-5 minutes of the conversation and 2) ability to identify a customer complaint 3) Apply structured complaint resolution strategies as per training content 4) Regular supervisor coaching and guidance on complaint resolution performance. These behaviours can be recorded using call listening audits, self-ratings, and/or supervisor ratings.

3. Data requires time, resources and effort to collect.
Change practitioners told us that the amount of work involved in collecting, sorting through, and analysing data is very resource-intensive. Because of this many try and avoid this as they do not have sufficient time or resources to collect data.
A lot of the work required is also very manual. Many mentioned automation as something they
are looking forward to. Change data that
can be automated to save time and energy to follow up, collect, followed by
data analysis is one that everyone looks forward to.
The solution is to leverage various digital tools to better automate the capturing, analysis and visualization of data. For example, Change Tracking is a tool now owned by Accenture that measures change readiness and generated reports. For various task management and collaboration features, most use such as Trello or Jira/Confluence. To measure change impact and change capacity, try The Change Compass.
4. Change capacity
The capacity for the impacted business stakeholder to
undergo and embed the change is often the first that comes to mind when it
comes to change data and reporting. Most
respondents mention manually developing a change heatmap to try and depict the
potential change capacity.
However, what the change heatmap actually depicts is the amount of change impact the various initiatives have added up together. This shows how much change impact there is and not the actual capacity that the impacted stakeholder groups have. It could be that certain parts of the organization are agile, mature and have great leaders. Therefore, they are able to have a much greater capacity to undergo larger volumes of change than another part of the organization. To read more about change heatmaps go to The death of the change heat map.
To resolve this it is important to map out the level of change capacity. How does one do this? By using historical data and comparing the level of change against business feedback such as performance indicators, and employee and leader feedback. To automate this process whereby you’re able to visualize the impacts of change against the plotted change capacity levels of each part of the business leverage The Change Compass.
5. Change prioritisation
Respondents call out the fact that often prioritisation of
initiatives is made based on typical project manager data points such as cost,
timeline, funding and business results.
The gap is that change data should also be taken into account. Data such as the velocity of the change, the
volume of the change, change capacity, risk of impact on business performance, business
readiness, all should be valid data points to consider in making prioritisation
decisions.
With the ability to access a range of data points, the organisation is better able to make balanced decisions to maximise benefits and minimise risk. The fact is that with the various challenges listed here in not being able to access a range of change data, decision-makers simply make decisions based on whatever they can get their hands on.
6. Data recency and validity
The usefulness of data is only as good as its recency and
validity. Outdated data cannot be used
to make decisions. What respondents call
out is that it is difficult to ensure that data is constantly updated and
valid. Once again, keeping data recent
takes significant time and effort.
However, various digital tools can again be leveraged to support data
recency. At The Change Compass we build
in a feature to remind users to update information and data recency is also
depicted in reports to reinforce the update of data.
To read more about change data to go The ultimate guide to measuring change.
7. Change governance
Change governance is critical to be able to support and govern
the change data collected and reported.
Change governance does not need to be a separate body created just for
the purpose of governance change data.
It could be a business unit planning meeting or a part of a PMO agenda
for example. The purpose of the
governance body here is to reinforce the importance of data, review any
generated insights, and make decisions on how to apply insights to business
decisions.
To read more about change governance, how to set it up and
various roles and responsibilities, refer to our Ultimate
guide to change portfolio management.
As a change community, our challenge ahead remains how we adopt and embrace the new world of data and insights. The more we are able to leverage data and not shy away from it. The more we are able to move the discipline forward to that which is seen as directly driving business value and has a critical seat at the table in decision making.
