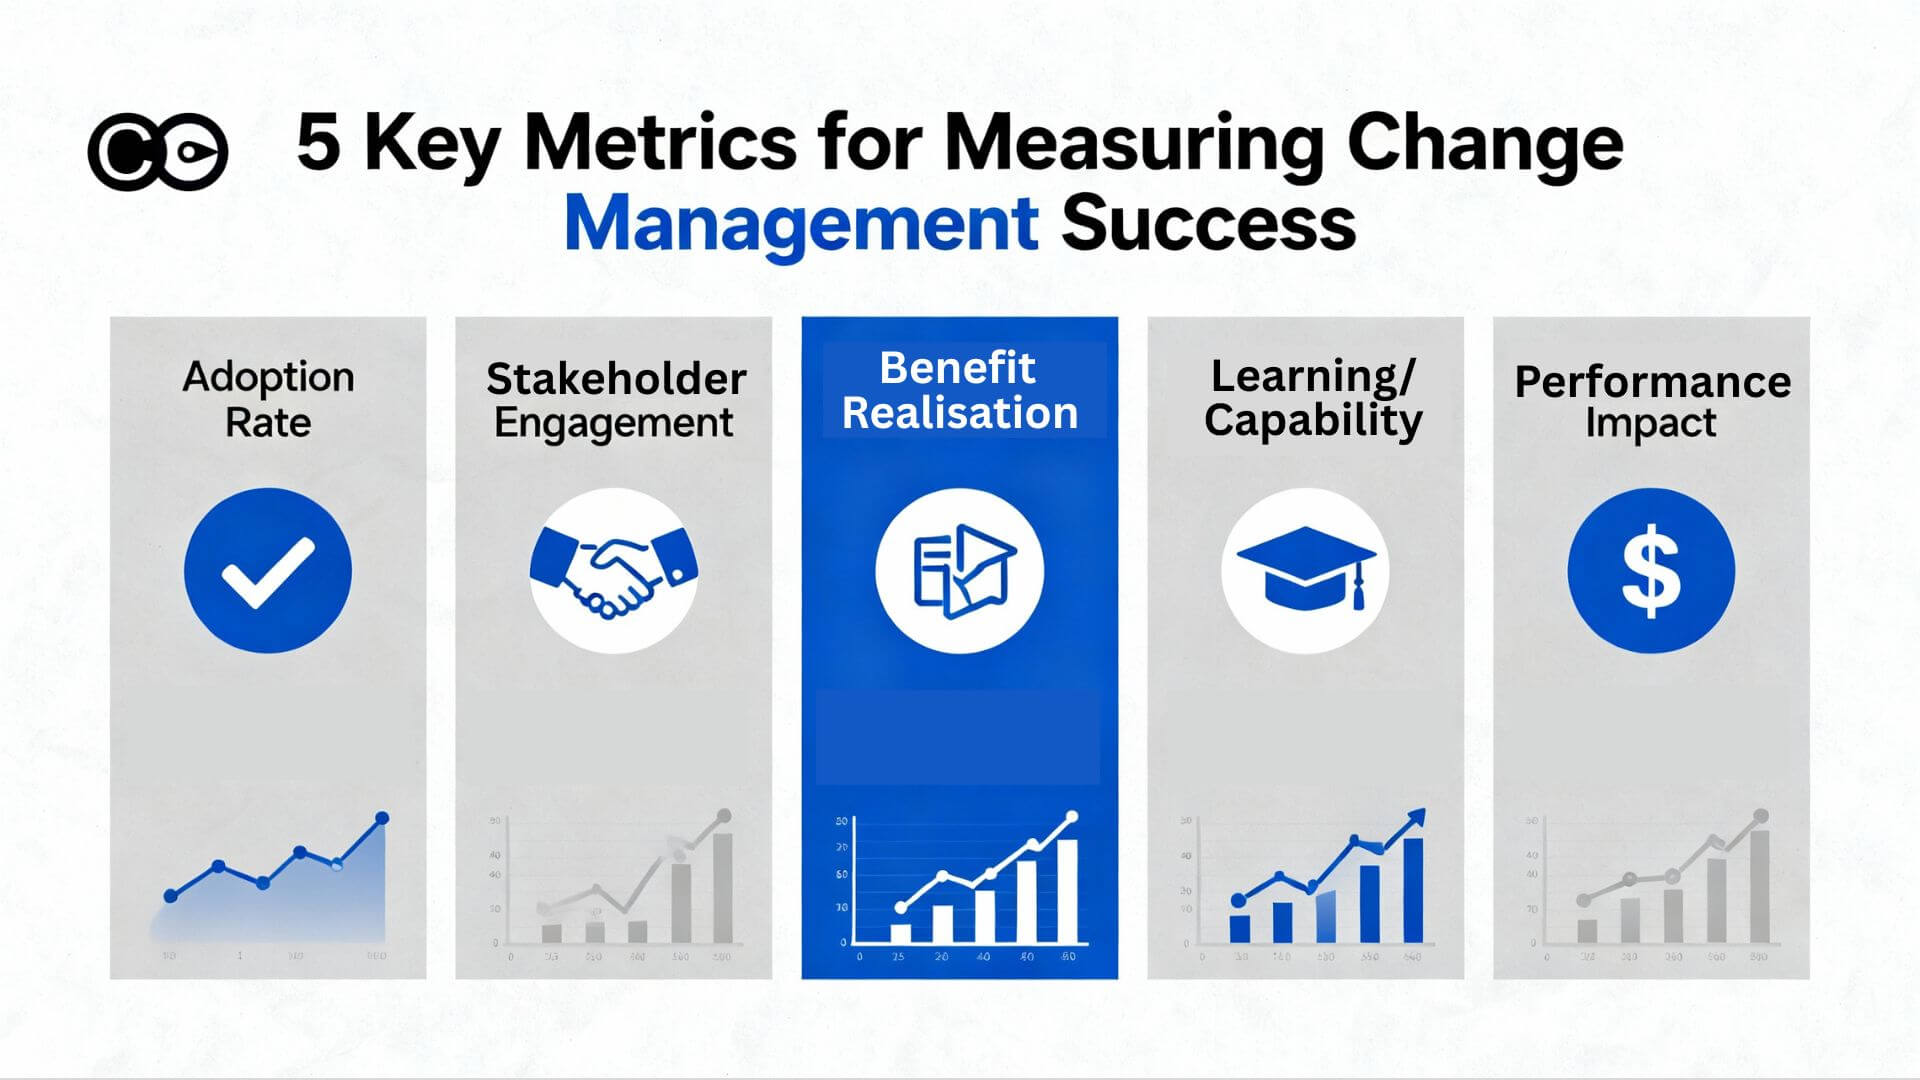


The five change management metrics that matter are adoption, readiness and engagement, performance impact, capability, and benefits realised: together they answer whether people used the change, were ready for it, performed better because of it, kept the skills, and produced the value the business case promised.
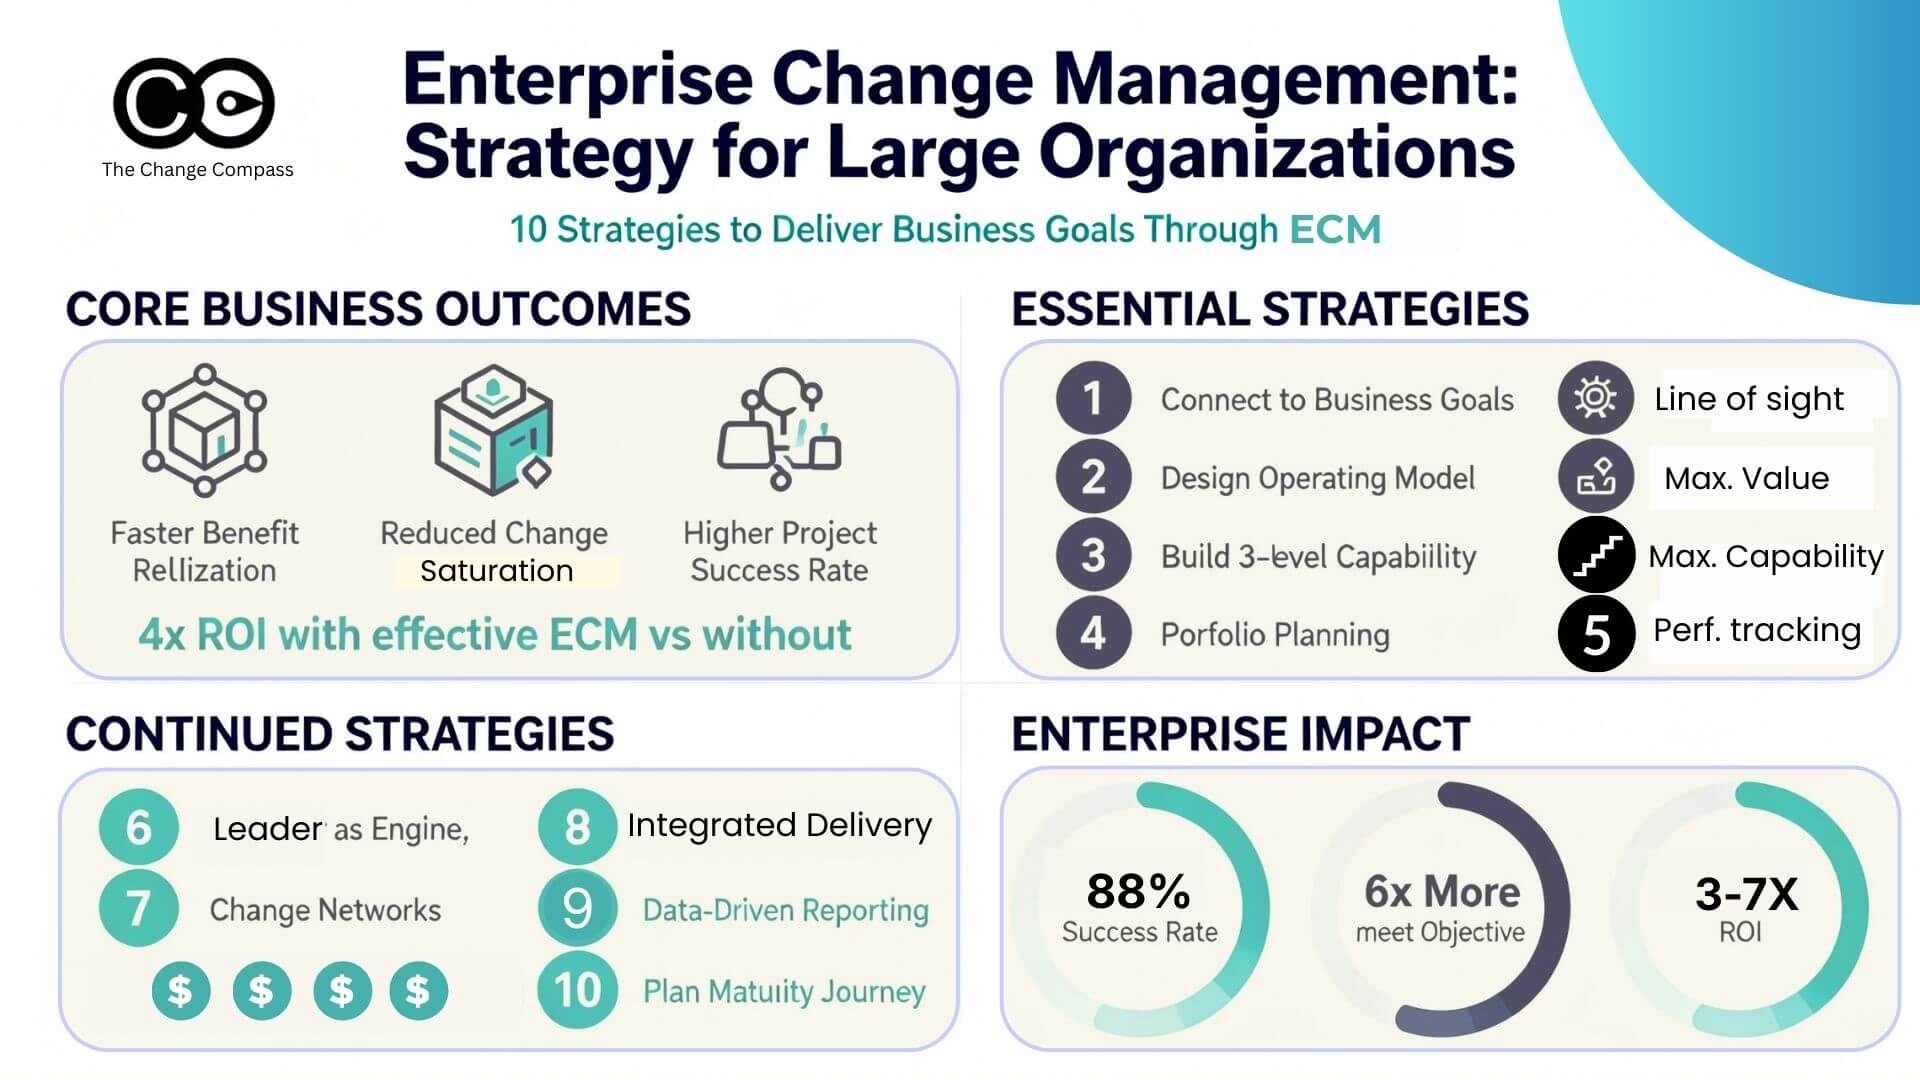
Most programmes can show that the training was delivered and the emails were opened. Far fewer can show that anything changed in how work gets done. Prosci’s 2023 benchmarking of more than 2,600 practitioners found that 88% of projects with excellent change management met or exceeded their objectives, against 13% for those with poor change management. The gap is real, but it is a gap in execution, and execution is only steerable if you can see it. Gartner’s 2025 research puts the scale of the problem plainly: just 45% of employees reported achieving the change goals set by their organisation.
This article is for change, transformation and HR leaders who need a short list of metrics they can defend in an executive meeting. It argues that five metrics, each with a baseline and a formula, are enough, and that the choice of metric matters less than whether you measure performance at all. By the end you will be able to calculate each metric, set a threshold for it, and recognise the failure mode that makes it misleading. For the full measurement framework, see the ultimate guide to measuring change.
Why measuring any performance beats measuring the right activity
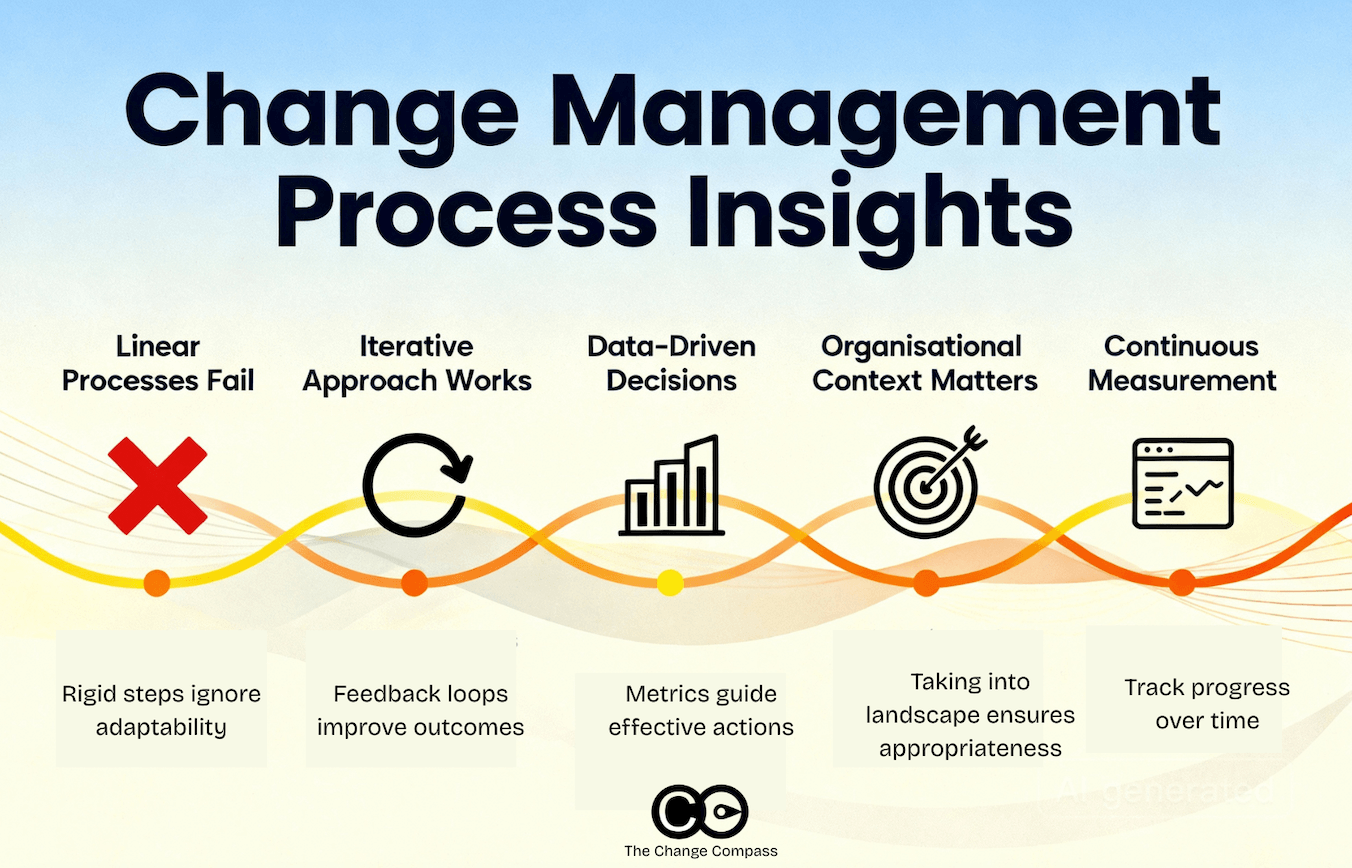
Teams that measure change performance are far more likely to meet their objectives than teams that do not, regardless of which individual metric they pick.
Prosci’s research found that 63% of participants measured compliance and overall performance, and of those 76% met or exceeded project objectives, compared with 24% of those who did not. The practical reading is that the discipline of measuring comes first and the sophistication of the metric comes second. A crude adoption figure reviewed fortnightly will outperform an elegant model reviewed at close-out.
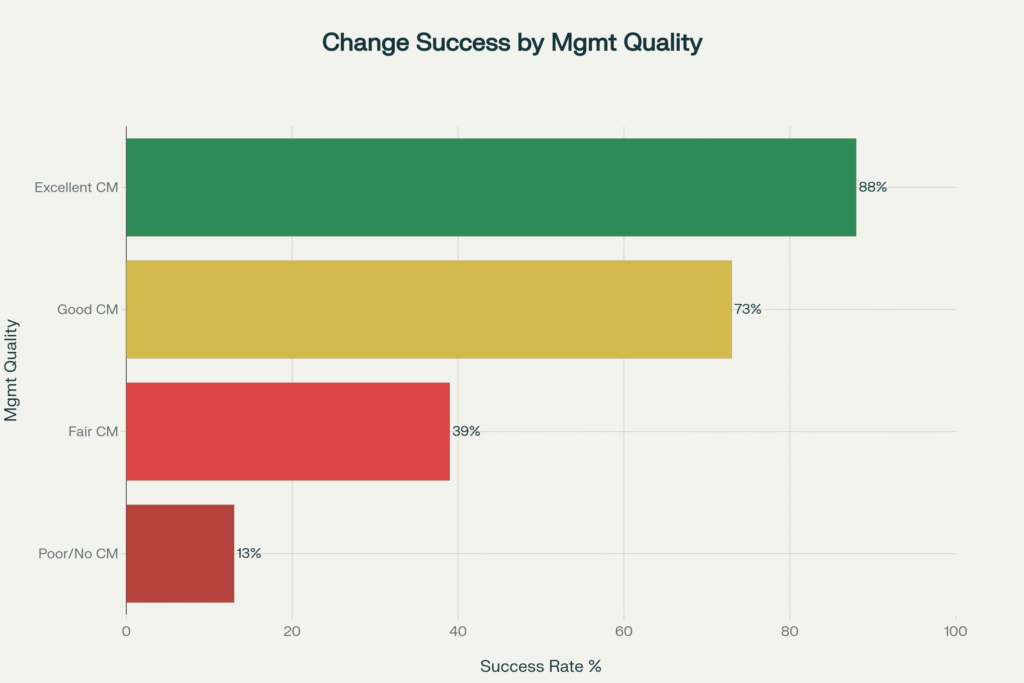
Research shows initiatives with excellent change management are 7x more likely to meet objectives than those with poor change management
That said, not every number earns a place on the page. Three traps recur:
- Activity metrics presented as outcomes. Training attendance, email reach and town hall turnout show effort, not effect.
- Measuring after the fact. A metric first collected at go-live has no baseline, so every improvement claim is a guess.
- Metrics without an owner. If nobody is accountable for moving the number, it becomes decoration.
The five metrics below are selected because each can be baselined before launch, owned by a named leader, and tied to an outcome an executive recognises. Prosci groups them across three levels: organisational performance, individual performance and change management performance, and this list draws from all three without reproducing the framework.
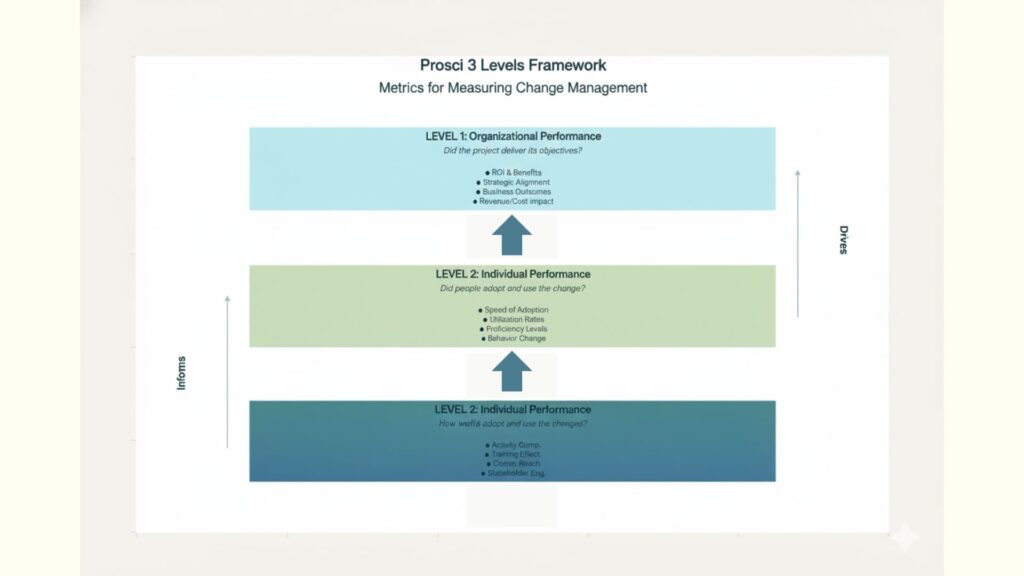
The Three-Level Measurement Framework provides a comprehensive view of change success across organisational, individual, and process dimensions
Metric 1: Adoption (speed, utilisation and proficiency)
Adoption is the share of impacted people who are using the change correctly, and it should be reported as three numbers, not one: how fast, how widely and how well.
Prosci defines individual performance through speed of adoption, ultimate utilisation and proficiency. Use all three, because any single figure can flatter a weak result. A tool with 90% logins and 40% correct usage is not adopted.
How to calculate it
- Utilisation rate = people actively using the new process or tool ÷ total impacted population × 100. Define “actively” before launch (for example, completed the new workflow at least weekly).
- Speed of adoption = days from go-live to reaching your target utilisation threshold (commonly 80% of the impacted population, but set it with the business owner).
- Proficiency rate = users meeting the agreed performance standard ÷ total users × 100, taken from quality, error or cycle-time data rather than self-report.
How to read it
Compare each cohort against the plan at go-live, day 30 and day 90. A cohort that is fast but shallow needs coaching. A cohort that is slow but proficient needs removal of barriers. A cohort that is neither needs a conversation with its manager. The gap between planned and actual is the number leaders should see.
Context matters when setting expectations. Gartner’s July 2025 research found that only 32% of business leaders reported achieving healthy change adoption by employees, so a mid-range result is common, not exceptional. The method for collecting these figures across different change types sits in our guide on how to measure change adoption.
Metric 2: Readiness and engagement
Readiness and engagement scores are the leading indicators: they show, before go-live, which groups are likely to adopt and which are not.
Measure readiness by group, not in aggregate. An organisation-wide average of 3.8 out of 5 hides the one division scoring 2.1 that will determine the outcome.
How to calculate it
- ADKAR score by element = average rating (1 to 5) from a short pulse survey for Awareness, Desire, Knowledge, Ability and Reinforcement, reported per impacted group. Because ADKAR scores each element separately, the lowest-scoring element points to the barrier: low Knowledge or Ability calls for training and practice, low Desire calls for a different conversation.
- Readiness gap = target score − actual score, per group and per element.
- Manager involvement rate = managers who held at least one structured team conversation about the change ÷ total managers in scope × 100.
How to read it
Treat any group with a readiness gap above one point, or manager involvement below your threshold, as a pre-launch risk. Manager involvement deserves particular weight. Gallup reports that global manager engagement fell from 31% in 2022 to 22% in 2025, which means the people you are relying on to carry the change are themselves less engaged than a few years ago. If your plan depends on manager-led conversations, measure whether they are happening rather than assume it.
Metric 3: Performance impact against a baseline
Performance impact is the movement in the business measure the change was meant to improve, compared with a baseline and, where possible, a comparison group.
This is the metric that earns attention from finance and operations, and the one most often undermined by missing baselines. The choice of measure comes from the business case: cycle time, error rate, first-contact resolution, sales conversion, or cost per transaction.
How to calculate it
- Performance change = (post-change value − baseline value) ÷ baseline value × 100.
- Attributable change (the more defensible version) = change in the impacted group − change in a comparable group not yet affected. This difference-in-differences approach strips out seasonal and market effects.
- Support signal = help desk or support volume per user, tracked weekly after launch. Falling volume with rising proficiency indicates embedding. Falling volume with flat proficiency usually means people have stopped asking.
How to read it
Expect a dip before the lift. Productivity often falls in the first weeks as people learn, so agree the expected shape of the curve with leaders in advance. Engagement is a useful companion measure because it links to the outcomes that matter: Gallup’s meta-analysis found that business units in the top quartile of engagement achieved 23% higher profitability than those in the bottom quartile. It is correlation, not proof that your change caused the result, but it justifies tracking engagement alongside the operational measure.
Attribution is the discipline here. Report the number you can defend, state the comparison used, and resist adding every improvement in the period to the change’s account.
Metric 4: Capability and behaviour transfer
Capability is measured by whether trained behaviours appear in the work 30, 60 and 90 days later, not by whether the training took place.
Completion and satisfaction scores tell you the session ran and was liked. They say nothing about transfer. This is the metric where activity most often masquerades as outcome, so it earns its own place on the scorecard.
How to calculate it
- Skill application rate = observed correct applications of the new behaviour ÷ observed opportunities to apply it × 100, sampled by managers or through system data at 30, 60 and 90 days.
- Time to proficiency = average days for a newly transitioned employee to reach the agreed performance standard.
- Learning-to-behaviour gap = percentage passing the post-training assessment − skill application rate at 30 days. A large gap points to a problem in the work environment, not the course.
How to read it
If knowledge is high and application is low, look to the manager, the workflow and the tooling before redesigning the training. Evidence on manager support is supportive but should be treated carefully. In a 2025 Training Industry case study of a change-training programme, participants with supportive managers who also attended both coaching sessions delivered three times the ROI. That is a single vendor-reported case, so use it as a prompt to test the manager effect in your own data rather than as a benchmark.
Metric 5: Benefits realised and return on investment
Benefits realised is the share of the business case’s promised value that has actually arrived, and change management ROI is the portion of that value attributable to the people side, net of its cost.
This is the metric that closes the loop, and the one that gets neglected after go-live. McKinsey’s global survey of 1,034 respondents found that those reporting a successful transformation captured on average 67% of the maximum financial benefit, and everyone else only 37%. Even the winners leave a third of the value behind, and most of the leakage happens when nobody is tracking.
How to calculate it
- Benefit realisation rate = benefits realised to date ÷ benefits planned for the same period × 100, with each benefit owned by a business leader and not the project team.
- People-side benefit coefficient = (expected benefits − expected benefits if adoption were zero) ÷ expected benefits. Prosci’s worked examples show how widely this varies: 12% for one project and 73% for another, which is why a single “typical” figure should never be assumed.
- Change management ROI = (realised benefits × people-side benefit coefficient − cost of change management) ÷ cost of change management.
How to read it
Be conservative and show the working. A 73% coefficient on a $1.3 million benefit case, with $350,000 expected even if no one adopted, produces a people-side contribution of $950,000. Stating the baseline assumption is what makes the number survive a finance review. Continue tracking after project close, because many benefits mature over months.
One caution: a single ROI ratio understates the value of change work that creates capability across several initiatives. The argument for treating ROI as a floor rather than the full case is in why change management ROI calculations limit its value.
Putting the five metrics on one page
A usable scorecard carries one leading and one lagging measure per metric group, each with a baseline, a target and an owner, reviewed on a fixed cadence.
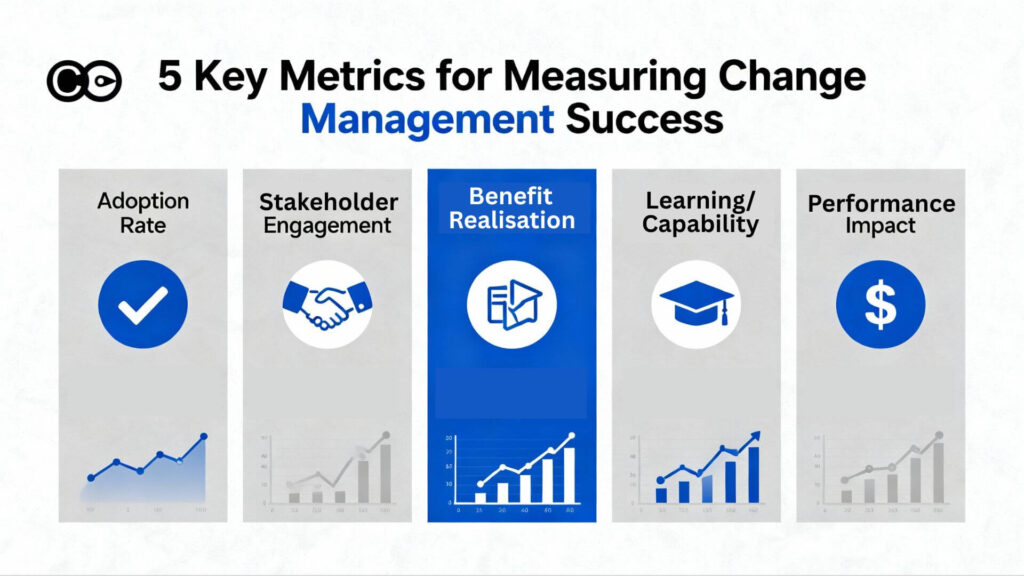
The five key metrics that matter for measuring change management success
A compact structure works better than a long one:
| Metric group | Leading measure | Lagging measure | Owner |
|---|---|---|---|
| Adoption | Day-30 utilisation vs plan | Day-90 proficiency rate | Business unit lead |
| Readiness and engagement | ADKAR gap by group | Sustained manager involvement | Change lead |
| Performance impact | Support volume per user | Attributable change in core KPI | Process owner |
| Capability | Post-training assessment | 90-day skill application rate | Line manager |
| Benefits | Benefit tracker vs plan | Realised benefits and ROI | Benefit owner |
Review operational measures weekly, leadership measures monthly and benefits quarterly. When a number moves the wrong way, add detail for that metric only. Keep the page to five to seven measures per initiative; the rest belongs in a drill-down, not on the executive view.
Where several initiatives land on the same teams, the same five metrics can mislead if you read them in isolation, because one group’s low adoption may reflect overload from another programme rather than a failure of this one. That portfolio view is covered in the pillar guide.
Using digital tools to keep the five metrics current
Digital change platforms keep these metrics current by collecting usage, survey and impact data continuously, so the scorecard reflects this week and not last quarter.
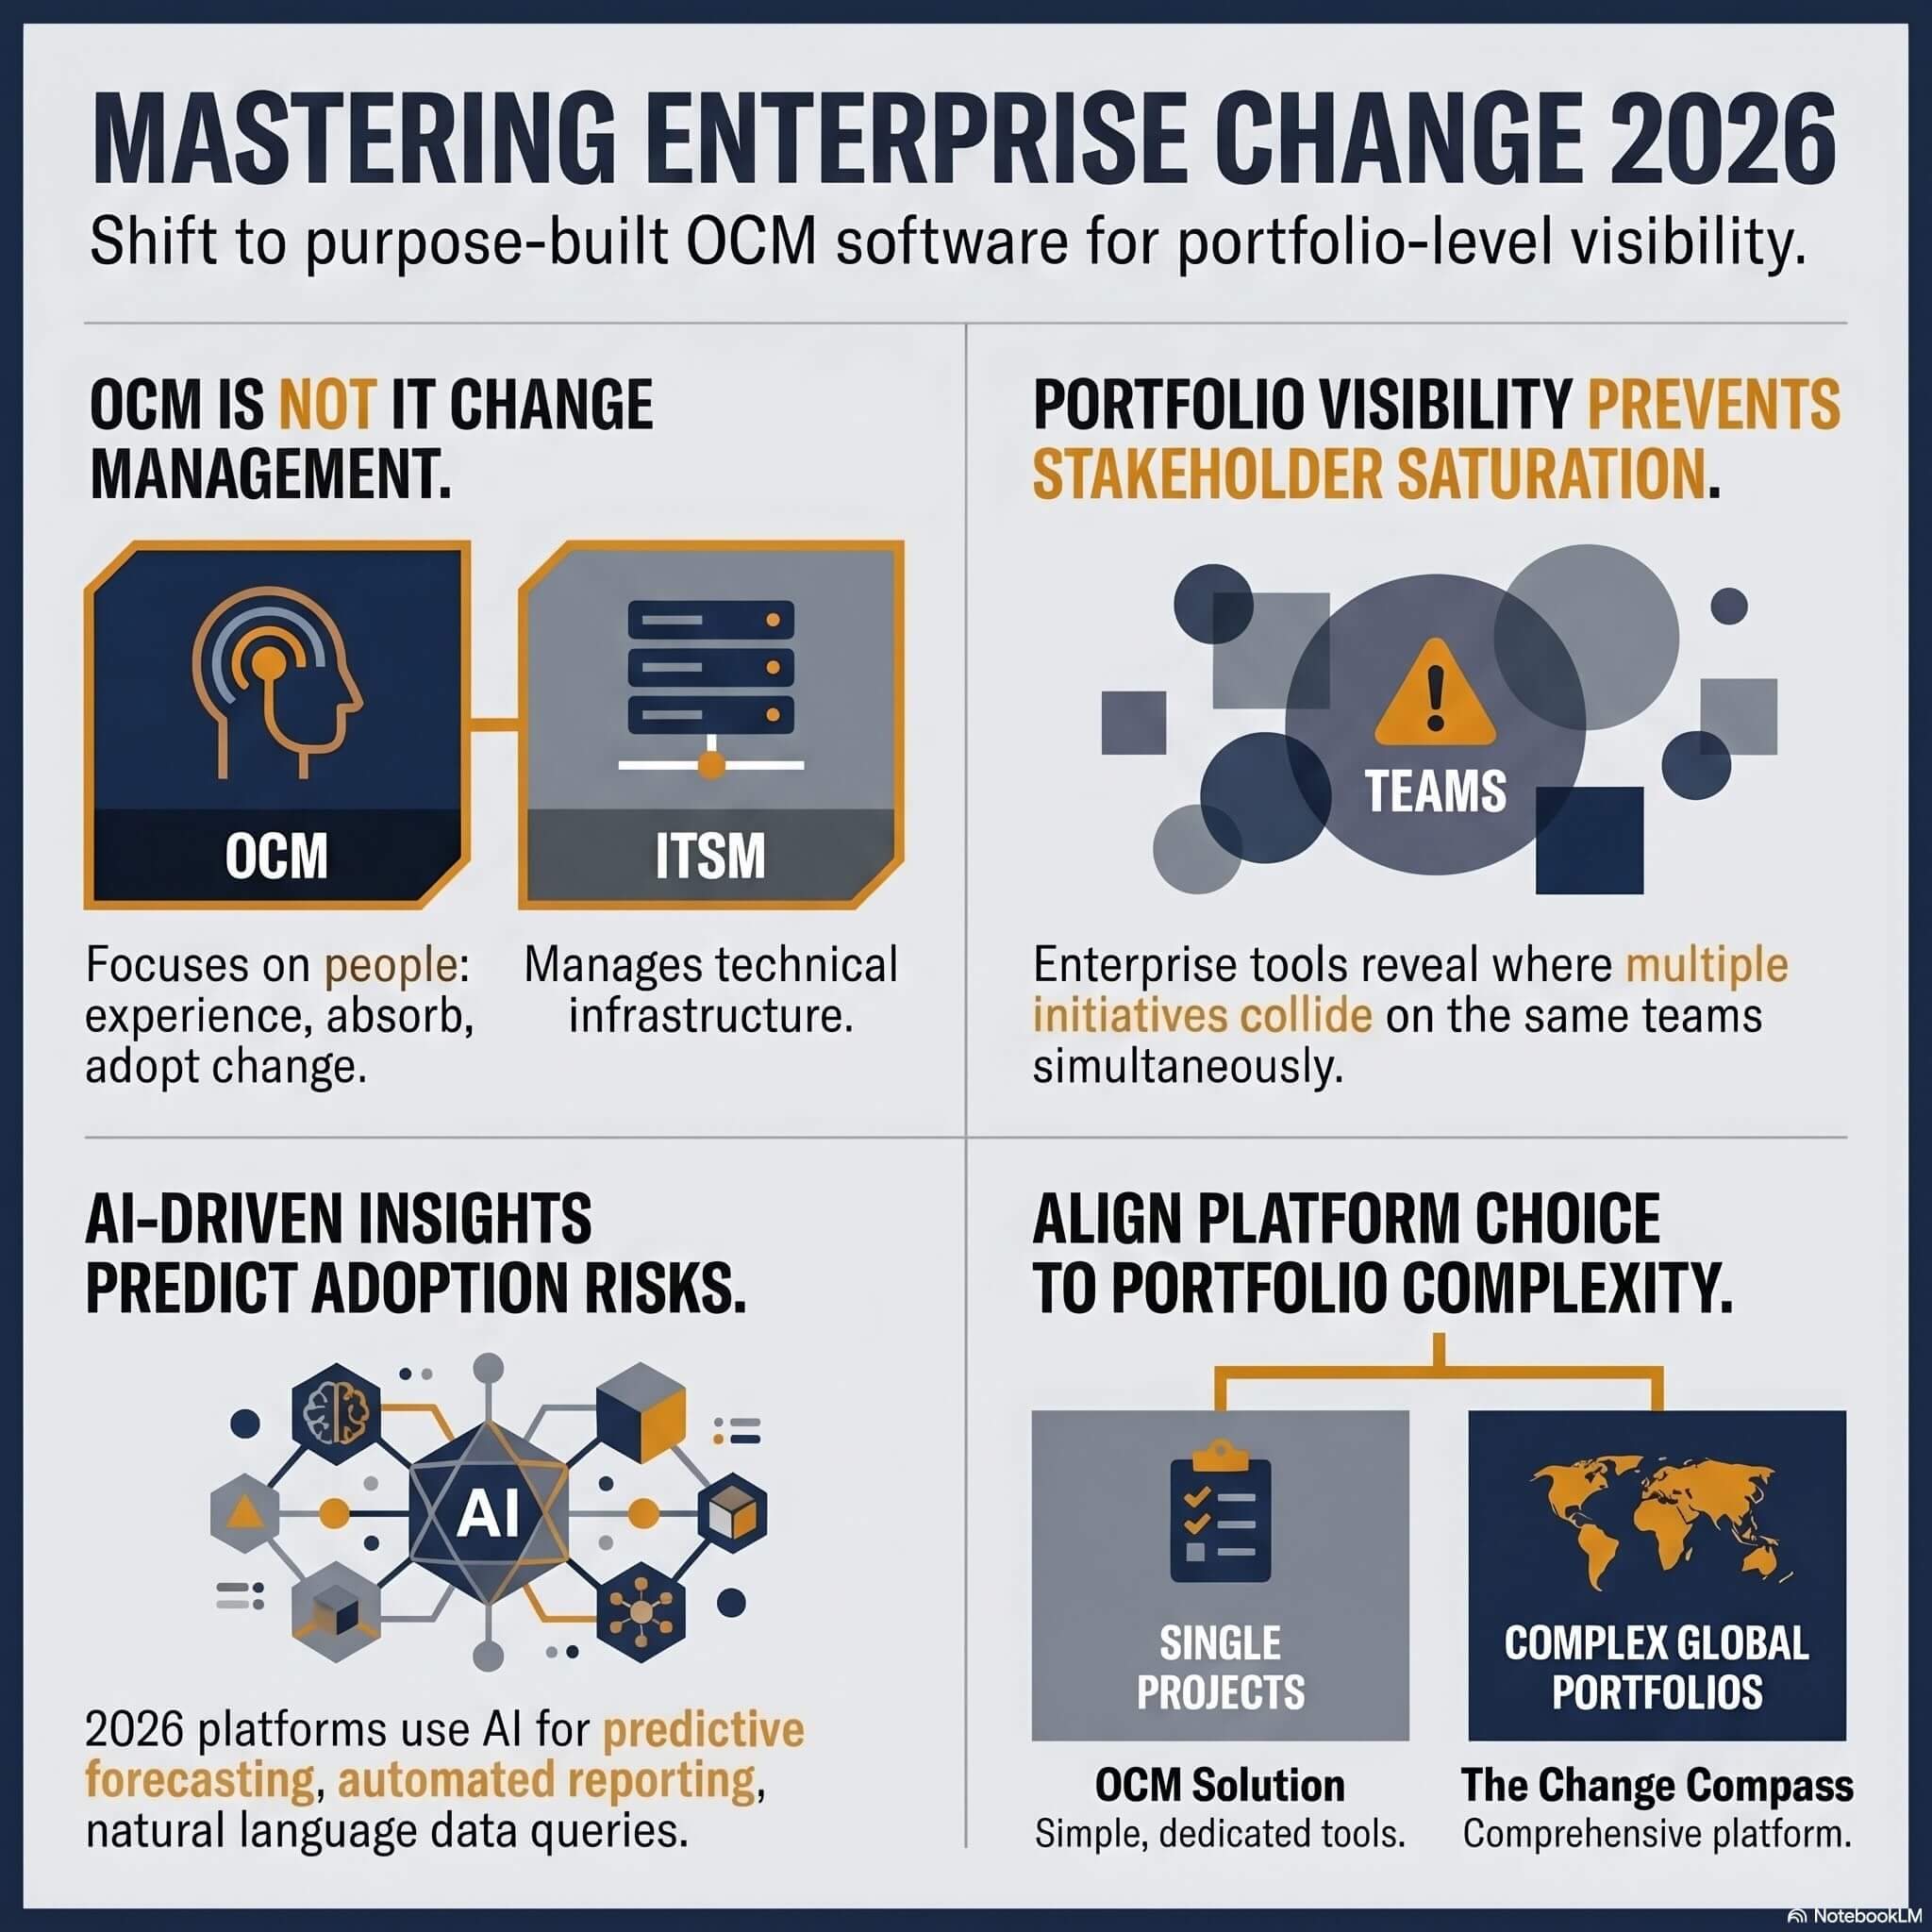
Spreadsheets and survey exports can hold the five metrics for one initiative, and many teams start there. The strain appears when you run several initiatives across the same teams: baselines drift, definitions diverge, and the quarterly rebuild consumes the time that should go to interpretation. A platform such as Change Compass holds the baselines, readiness pulses, adoption data and impact across the portfolio in one place, so a practitioner can see which groups are behind plan and which initiatives are competing for the same people. The principle is unchanged whether you use a platform, a spreadsheet or a BI tool: define the metric, fix the baseline, name the owner, and look at it on a schedule.
Choosing the next metric to fix
Start with the metric you cannot currently calculate, because the first gap in your scorecard is usually the one hiding the biggest risk.
Most teams find that metrics 1 and 2 already exist in some form and that metrics 3 and 5 are missing a baseline. That is the place to begin: agree one business measure and one benefit owner before your next go-live, and capture the pre-change value this month. The remaining metrics can follow in order of how decision-relevant they are to your sponsor.
The aim is not a bigger dashboard. It is the ability to say, at any point in a change, how many people are using it, how well, what that is worth, and what you would do differently if the numbers moved. Five metrics, calculated the same way each time, are enough to say that with confidence.
Frequently asked questions
What are the five most important change management metrics?
The five metrics are adoption (speed, utilisation and proficiency), readiness and engagement, performance impact against a baseline, capability and behaviour transfer from training, and benefits realised against the business case. Together they cover whether people use the change, whether they were ready, whether work improved, whether skills stuck, and whether the value arrived.
How do you calculate change adoption rate?
Divide the number of impacted people actively using the new process or tool by the total impacted population, then multiply by 100. Measure it at fixed points such as go-live, day 30 and day 90, and report speed (days to reach your target threshold) and proficiency (the share of users meeting the performance standard) alongside it.
How do you measure the ROI of change management?
Estimate the share of project benefits that depend on people adopting the change, multiply it by the benefits actually realised, subtract the cost of change management, and divide by that cost. The credibility of the result depends on a documented baseline and an honest estimate of how much of the benefit is people-dependent.
What is the difference between leading and lagging change metrics?
Leading metrics, such as readiness scores, manager involvement and early usage, predict whether adoption will happen and leave time to intervene. Lagging metrics, such as sustained utilisation, performance improvement and realised benefits, confirm whether it did. A useful scorecard carries both, with at least one of each for every metric group.
How many metrics should a change programme track?
Track five to seven for any single initiative, one or two per metric group, each with a baseline, a target and a named owner. More than that dilutes leadership attention and hides the signal. Add detail only when a metric moves in the wrong direction and needs diagnosing.
References
- Prosci. The Correlation Between Change Management and Project Success (Best Practices in Change Management study, published 7 June 2023).
- Prosci. Metrics for Measuring Change Management.
- Prosci. Using the ADKAR Model to Measure Change Success.
- Prosci. Rethinking the ROI of Change Management.
- Gartner. Gartner HR Research Finds Less Than Half of Employees Achieved the Change Goals Set by Their Organization (9 October 2025).
- Gartner. Gartner HR Research Finds Just 32% of Business Leaders Report Achieving Healthy Change Adoption by Employees (8 July 2025).
- Gallup. State of the Global Workplace (2026 report, manager engagement trend).
- Gallup. Employee Engagement: Drivers and Business Outcomes.
- McKinsey & Company. Losing from day one: Why even successful transformations fall short (December 2021).
- Training Industry Magazine. All Aboard! Measuring the ROI of AI and Change Training (Spring 2025).