The concept of managing a set of projects or initiatives may be new in the area of change management, but it is commonplace for many large financial services firms in the project management arena. The idea is that across a large number of projects, these are then divided into a few portfolios to better manage the outcomes within each portfolio, versus a scattered, project-by-project approach.
Where did the concept of portfolio management come from? And how do we best apply this within a change management context when multiple changes are going on at any one time?
In finance, a portfolio refers to a combination of financial assets such as stocks, bonds, and cash. The goal of managing a portfolio is to get the best outcome according to risk tolerance, time frame, and investment objectives.
This is not all that different in change management. Change interventions and activities are designed to maximize the return on investment and the embedment of change. Change measurement and reporting focus on leading risk indicators such as change readiness, stakeholder engagement levels, and progress of capability development in terms of training completion rates.
Like finance investments, initiatives also have different priorities and risk exposures. Those that are higher priority and have higher risk exposures need greater focus than those that are lower priority and have less risk exposure. Therefore, clear prioritization is critical to ensure clarity of focus.
The timing of initiatives is also a notable comparison. Some initiatives take a long time to implement and embed, requiring significant continued sustainability to execute. Other initiatives may be much faster to implement, reaping the benefits sooner. From a change management perspective, focusing on the people’s requirements as a result of the speed of implementation is key. A project for the long haul requires continuous updates and engagement, versus something more intense and quick in roll-out.
So what can we learn from financial portfolio management approach?
Focus on Data
Data is king in finance. The goal of the overall portfolio can only be assessed in terms of its financial performance. Imagine trying to understand the performance of a financial portfolio without being able to look at its performance. It is the same for change management. We need to be able to assess the outcome of various initiatives within the portfolio. For example:
What are the impacts across initiatives? How do they impact the same business unit or stakeholder groups? Which business units are at risk due to the change volume planned? How can the risk be managed or mitigated? How is the change embedment tracking? This can be measured in terms of change readiness or in terms of more project-specific measures such as specific behaviors or any efficiencies or savings targeted.
Speed of implementation is also key to measure. Is there a clear sense of the speed at which different projects within the portfolio are operating? What are the short and sharp ones versus the long and arduous projects?
2. Focus on Risk
In a way, managing change can be seen as an investment in risk mitigation as mentioned previously. In overviewing the various projects within the portfolio, be aware of their corresponding risk exposures. Some of how we can value the risk exposure of initiatives related to change include:
Projects that are deemed higher risk because the quantum of change impact is higher and more complex than others Stakeholder support and drivers level Sponsor style and level of involvement in breaking through any obstacles and being visible
Project team health: Is the team cohesive and high-performing or plagued with conflicting personalities and siloed work streams? Level of awareness across impacted employees.
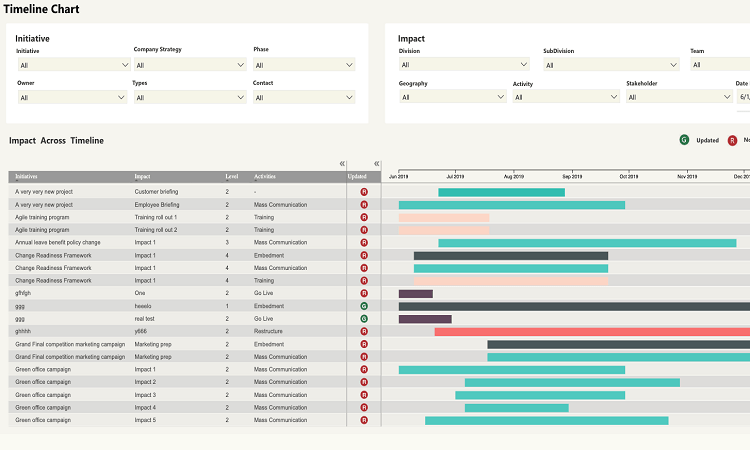
Example of data visualization of a change portfolio from The Change Compass
Example of data visualization of a change portfolio from The Change Compass
3. Focus on Analysis and Reporting
A finance portfolio manager spends his/her time understanding the performance and risks of each investment and the overall portfolio. In the same way, to understand how the overall change portfolio is performing, it is key to review the whole group of initiatives regularly.
Some routines can be designed into business-as-usual activities. For example, as a part of regular business planning sessions, one aspect could be to review the performance of the change portfolio metrics and reports. This would involve various stakeholders in the planning process, thereby focusing their attention on managing change and giving them accountability in this regard.
Often change approaches are built not using a structured and
well-defined series of logics but often using a cookie-cutter, standard change
approach or change strategy template. In
some cases, a ‘gut-feel’ may also be used based on stakeholder wishes or
preferences. These are subject to
stakeholder criticism nor do not achieve the goals of the initiative.
The usual standard change approach for most initiatives often
entail the following.
Stakeholder engagement – setting up forums and sending emails to stakeholders
Training – planning for and executing training delivery to ensure users understand the new system/process
Pre-go live readiness – send reminder emails and build intranet articles to raise awareness
How might we better derive change approach using sound logic and an evidence-backed approach?
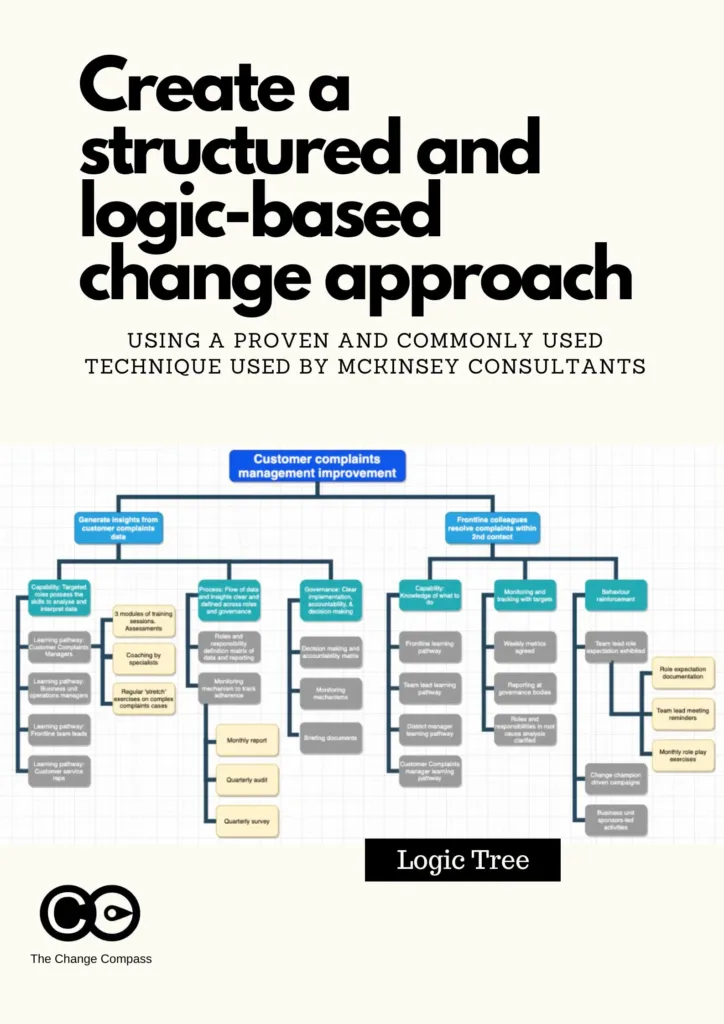
One way to construct a logical, structured and well-thought-through change approach is by using a logic tree. A logic tree is a visualization that captures all the component parts of a problem, in order to make it easier to identify a hypothesis that can then be tested using data and analysis. Logic trees are great for making decisions by visually decomposing the various elements and reviewing these holistically.
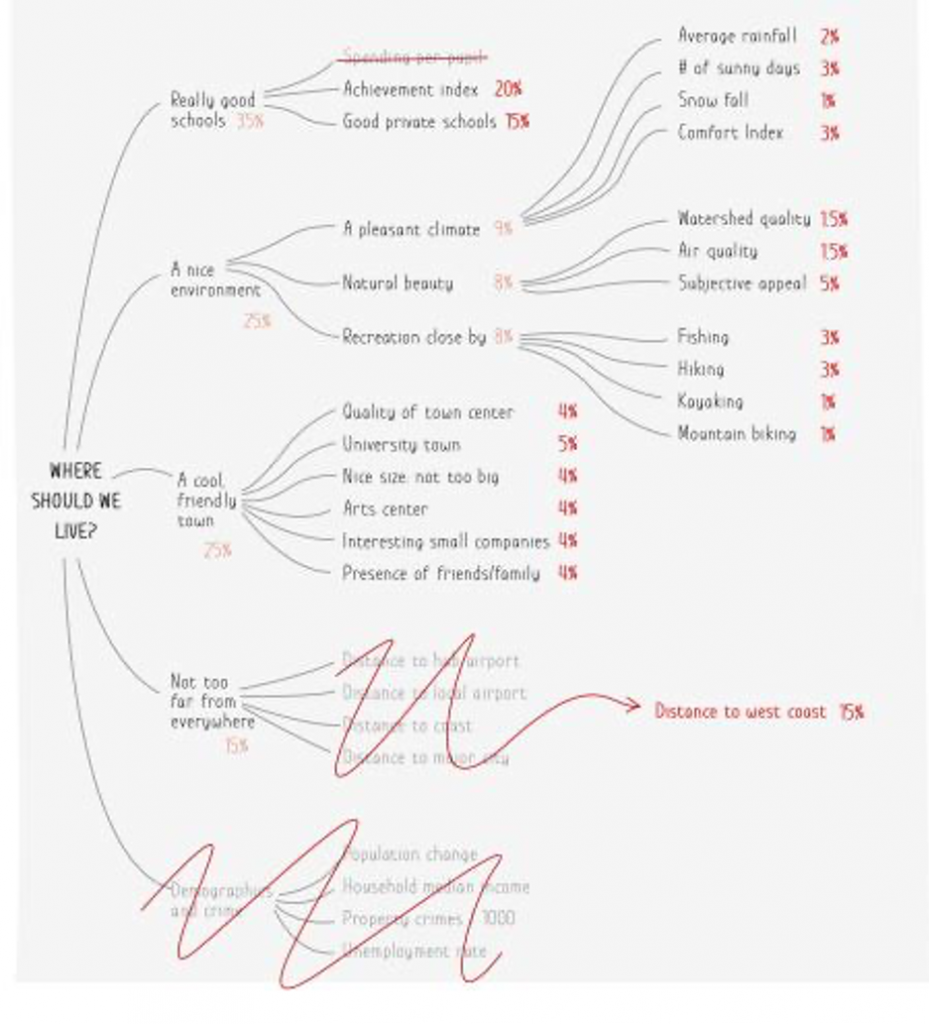
In the following example, a family uses a logic tree to decide which new town to move to by narrowing almost 30 possible potential locations to just one. In the following diagram (from Bulletproof problem solving, Wiley 2019) you can see how this family started with the problem it is trying to solve, and then broke down the problem into its elements. Then within each branch a weighting is assigned to each branch, in terms of percentages. Then each sub-branch is also assigned weightings.
Example of a logic tree in deciding where to live
Then as a next step data can be collected to determine which town meets the various criteria as defined in the logic tree. By doing this, laying out the various components, and analysing its weightings, you can derive the best location.
This is how McKinsey consultants and other strategy consultants
solve large complex problems. The logic
tree forces you to structure your problem versus being lost in focusing on
certain approaches and neglecting others.
Any problem can be solved using this approach. Even the largest of problems can be broken
down into its smallest components.
Strategy consultants then go through every branch to analyse
them and collect data to prove or disprove each branch one by one. This means, that each branch or hypothesis is
tested and proven or disproven. In this
way, every option is considered and the chance of making a wrong decision is
greatly reduced.
So how might we build a logic tree that helps derive the
change approach for an initiative?
Start by defining the problem or question to be addressed. What is the goal of the initiative? Is it to implement a new system that is fully adopted by its users? Is it to increase cross-selling by sharing customer information across business units?
Think of the broader buckets of each branch. What are the core types of change approaches to address the problem? Think widely and carefully about all the types of buckets possible that would address the problem.
Expand the branches until you have covered all possibilities
Go through and assign a weighting in percentage terms to each branch and then use this to determine the focus and importance you may want to place on certain branches in terms of research and data collection
Go through each branch and systematically to reject any that do not apply based on data. For example, one branch could be to use video as a channel to communicate. However if the data shows that previous usage of video to communicate key messages did not result in raising awareness for this stakeholder group, then reject this option
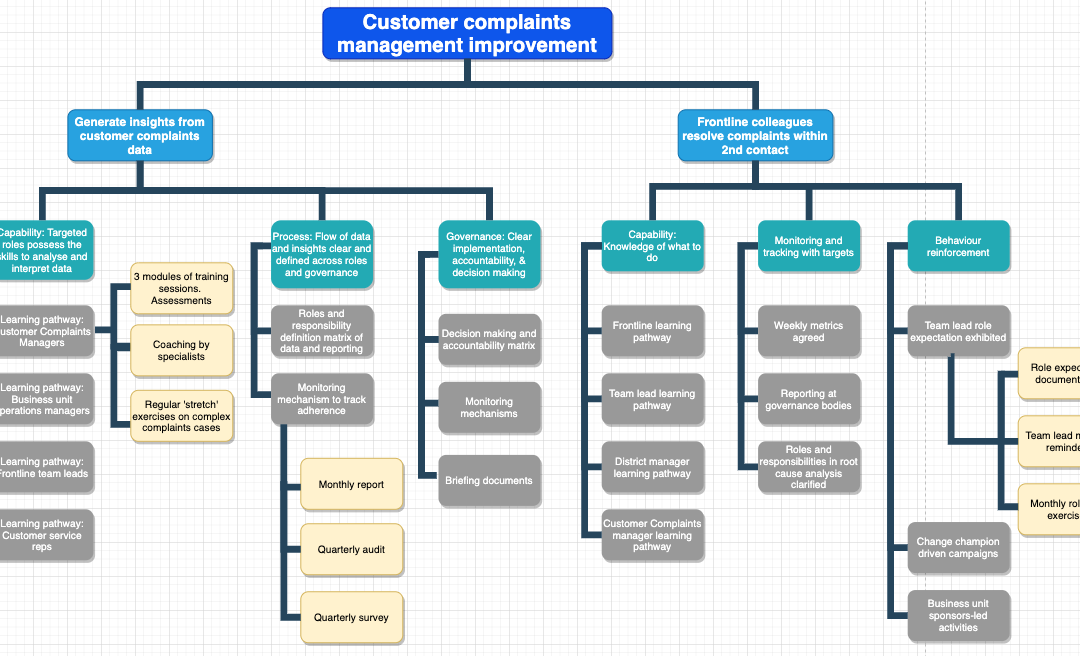
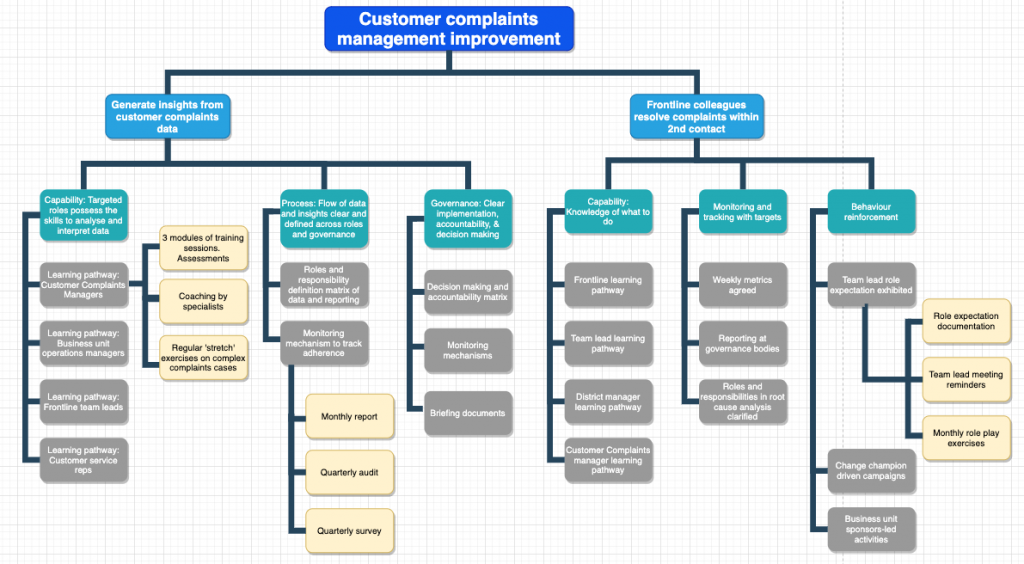
Here is one partial example of deriving a change approach for a customer complaints project.
One important principle to note when building branches is to ensure that the branches are MECE. MECE stands for mutually exclusive and collectively exhaustive. Mutually exclusive means that you need to ensure that each branch is unique and does not overlap with any other branch. Collectively exhaustive means that every option or alternative has been considered and nothing is left off. In this way, the branches you have built are bulletproof from a logical structure perspective.
Building a change approach using a structured approach that is data-supported and logic tested will earn significant stride with the most critical of your stakeholders. You can even hold a workshop to work with your stakeholders to define the logic tree and assign weightings so that that the agreed approach is one that is clearly visible and logically sound.
Another important point to keep in mind is how each of the branches of the logic tree change approach will interface into the overall change environment. When planning on the execution of the overall change approach or each branch of the approach, one needs to be clear around the velocity and volume of change and what else is happening in the change landscape. Using data visualisation tools such as The Change Compass is one way to grasp and plan around the change environment.
We surveyed senior change practitioners on their key challenges
in using change data to generate insights, and here is what we found …
Change practitioners seem to face quite a lot of challenges across the board in measuring change and demonstrating the value of managing change. For many, there appears to be a level of angst and frustration in not being able to break through and demonstrate insight through change data in a clear and simple way.
Why did we survey this topic? In the new economy, our world is increasingly dominated by technology and data. More than ever data is all around us and our ability to access a range of data is becoming more prevalent. At our fingertips, we can access our phone to see how many steps we have taken today, work email and even workplace chat platforms.
In the business world, the same applies even more so. All facets of how business is being will increasingly be dominated by data. The availability of data. The insight that can be generated by data to make decisions. Data is king and a competitive advantage.
However, in change management, our ability to use data has mainly been restricted to ‘soft’ qualitative data. Of course, all types of data are useful both hard and soft data. However, most of our stakeholders who make decisions on project execution, funding, and prioritisation are focused on hard metrics. We really cannot blame them because hard metrics tell a direct compelling picture, whereas soft, qualitative data requires a level of interpretation and maybe less direct in the implication.
We surveyed a sample of senior change practitioners and received 30+ responses. After sorting through the feedback and responses we grouped them into the following 7 themes. We also directly address each of the challenges posed.
1. Getting buy-in from stakeholders on data input
Some mention the importance of stakeholder support and buy-in in collecting change data. This can be quite challenging if your stakeholder does not see the value of the change data that you are collecting. Since the bulk of change data is derived from each of the impacted businesses and those involved in the initiative, it is critical that the impacted stakeholders are supportive to ensure that data may be collected and response is sufficient.
A key element in ensuring that your stakeholder buy-in to your change data plans is to come up with a ‘sales pitch’ for them personally. Each stakeholder is concerned about their own priorities and challenges. If the change data can be positioned to address one of their pain points, then it will be hard to imagine any stakeholder who will not be interested.
2. How to measure cultural & behavioural change
This is probably the biggest challenge called out across
respondents. Most change practitioners
work on embedding some form of behaviour change. As a result, being able to measure the
behaviour change is critical to demonstrate the value of having a change
manager onboard and the value of change tactics.
And since most initiatives are not end-to-end transformations of everything within the organization, there is usually a limited set of behaviours that the initiative aims to change. Working on measuring a small set of behaviours can be challenging because it is not that we are measuring the whole culture of the organisation, which can be measured by culture inventories such as Organization Culture Inventory (OCI).
One way to do this is to start by defining the actual
behaviours you are trying to measure in very specific detail, in a way that is
behavioural and observable. For example,
customer service representatives will be able to resolve customer complaints in
the first contact without escalating to their team leader. This can easily be measured using the data
from the CRM system that the representative uses.
Then we can break this down into more discrete ‘micro-behaviours’ that will contribute to the overall behavioural outcome. For example, in this example, it could be 1) Establish rapport within the first 3-5 minutes of the conversation and 2) ability to identify a customer complaint 3) Apply structured complaint resolution strategies as per training content 4) Regular supervisor coaching and guidance on complaint resolution performance. These behaviours can be recorded using call listening audits, self-ratings, and/or supervisor ratings.
3. Data requires time, resources and effort to collect.
Change practitioners told us that the amount of work involved in collecting, sorting through, and analysing data is very resource-intensive. Because of this many try and avoid this as they do not have sufficient time or resources to collect data.
A lot of the work required is also very manual. Many mentioned automation as something they
are looking forward to. Change data that
can be automated to save time and energy to follow up, collect, followed by
data analysis is one that everyone looks forward to.
The solution is to leverage various digital tools to better automate the capturing, analysis and visualization of data. For example, Change Tracking is a tool now owned by Accenture that measures change readiness and generated reports. For various task management and collaboration features, most use such as Trello or Jira/Confluence. To measure change impact and change capacity, try The Change Compass.
4. Change capacity
The capacity for the impacted business stakeholder to
undergo and embed the change is often the first that comes to mind when it
comes to change data and reporting. Most
respondents mention manually developing a change heatmap to try and depict the
potential change capacity.
However, what the change heatmap actually depicts is the amount of change impact the various initiatives have added up together. This shows how much change impact there is and not the actual capacity that the impacted stakeholder groups have. It could be that certain parts of the organization are agile, mature and have great leaders. Therefore, they are able to have a much greater capacity to undergo larger volumes of change than another part of the organization. To read more about change heatmaps go to The death of the change heat map.
To resolve this it is important to map out the level of change capacity. How does one do this? By using historical data and comparing the level of change against business feedback such as performance indicators, and employee and leader feedback. To automate this process whereby you’re able to visualize the impacts of change against the plotted change capacity levels of each part of the business leverage The Change Compass.
5. Change prioritisation
Respondents call out the fact that often prioritisation of
initiatives is made based on typical project manager data points such as cost,
timeline, funding and business results.
The gap is that change data should also be taken into account. Data such as the velocity of the change, the
volume of the change, change capacity, risk of impact on business performance, business
readiness, all should be valid data points to consider in making prioritisation
decisions.
With the ability to access a range of data points, the organisation is better able to make balanced decisions to maximise benefits and minimise risk. The fact is that with the various challenges listed here in not being able to access a range of change data, decision-makers simply make decisions based on whatever they can get their hands on.
6. Data recency and validity
The usefulness of data is only as good as its recency and
validity. Outdated data cannot be used
to make decisions. What respondents call
out is that it is difficult to ensure that data is constantly updated and
valid. Once again, keeping data recent
takes significant time and effort.
However, various digital tools can again be leveraged to support data
recency. At The Change Compass we build
in a feature to remind users to update information and data recency is also
depicted in reports to reinforce the update of data.
Change governance is critical to be able to support and govern
the change data collected and reported.
Change governance does not need to be a separate body created just for
the purpose of governance change data.
It could be a business unit planning meeting or a part of a PMO agenda
for example. The purpose of the
governance body here is to reinforce the importance of data, review any
generated insights, and make decisions on how to apply insights to business
decisions.
As a change community, our challenge ahead remains how we adopt and embrace the new world of data and insights. The more we are able to leverage data and not shy away from it. The more we are able to move the discipline forward to that which is seen as directly driving business value and has a critical seat at the table in decision making.
The agile way of implementing changes has been popular for quite several years among a range of companies, from small startups to large corporations. Most agile methodologies do not address the role of change management explicitly as a function. However, at the same time, most project practitioners agree that managing change is a critical skill set. Surveys conducted by the Project Management Institute consistently found that change management is rated as one of the top skills for a project manager.
In this article, we will delve into a variety of toolkits that support agile methodologies, providing not only an overview but also in-depth explanations and practical examples to help change managers implement change effectively. Gone at the days when the change manager needs to work on large presentations and slides detailing every aspect of the plan. It was not uncommon to see more than 100 slides for a change plan. In the agile world, documentation is important but more important is the conversation and working with stakeholders.
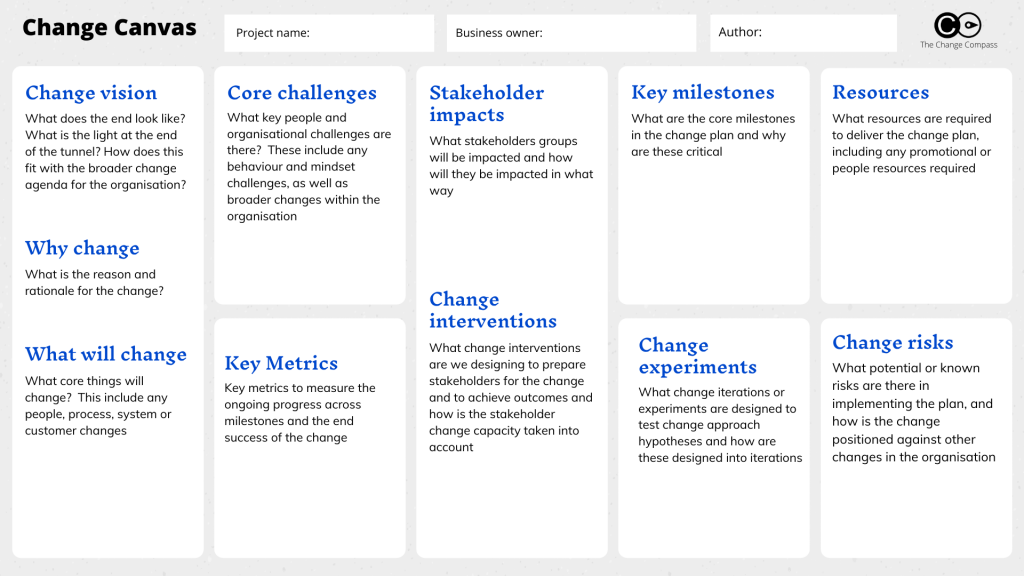
Toolkit 1: Change Canvas: A Summarized Approach to Change Planning
The Change Canvas, also known as ‘change-on-a-page,’ serves as a condensed version of the change plan. While previous iterations leaned towards a project plan format, the current version focuses on key questions that change practitioners must answer. Previous versions of the change canvas are often designed with more of a project plan slant. In the current version, we focus on a core set of questions that the change practitioner needs to answer in creating a change plan. To download the canvas click here.
Example: “Imagine a technology company undergoing a major software upgrade. The Change Canvas was employed to create a concise summary of the change plan. This one-page document effectively communicated the essence of the software upgrade, outlining key aspects such as the purpose, stakeholders involved, and the approach to implementation. This simplified overview became a valuable reference point during stakeholder meetings, fostering clearer communication and understanding.”
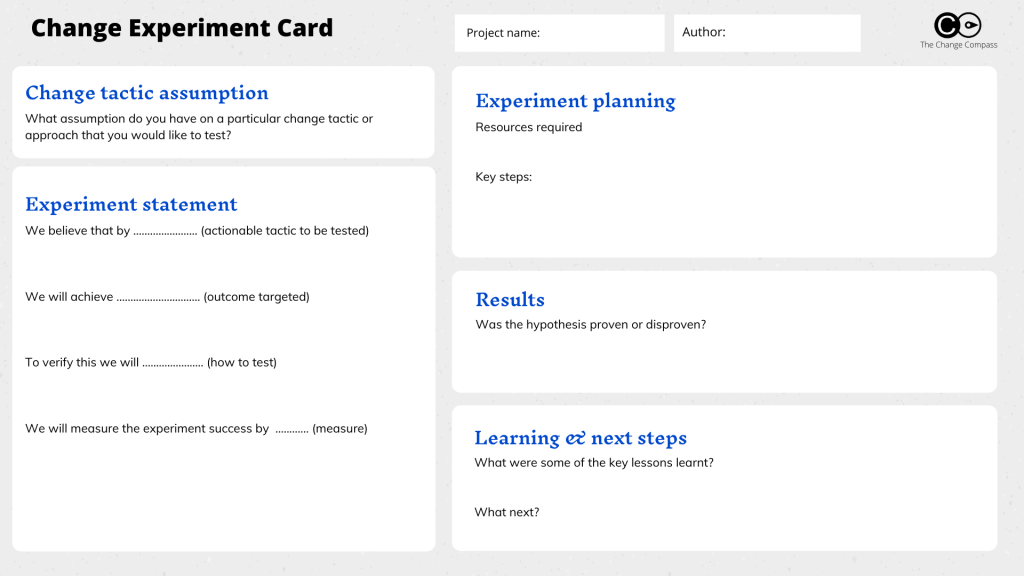
Toolkit 2: Change Experiment Card: Iterative Approaches for Effective Change
A core part of agile is about experimenting and iterating through a series of changes, versus planning one change. The idea is that each small change is an experiment with a hypothesis that can be tested and proven to be true or false using data. When the overall change becomes a series of smaller changes, each change iterates on the previous change. The overall risk of failure is reduced and each change is one step closer to the ultimate successful end state.
Applying this concept in change management – The change experiment card is a template to help you design, plan, and test your change experiment. To download the template please click here.
Change experiments can range from:
Project message positioning to stakeholders
Learning design effectiveness
Effectiveness of a communications channel in engaging with stakeholders
Change readiness tactic
Effectiveness of the change vision artifact
Example: “In an educational institution implementing a new learning management system, the Change Experiment Card was utilized to plan and test various change experiments. One experiment focused on refining the messaging strategy to engage faculty members effectively. By treating each adjustment as an experiment, the change team gathered valuable data on the impact of messaging changes, allowing for continuous refinement and ultimately ensuring a smoother adoption of the new system.”
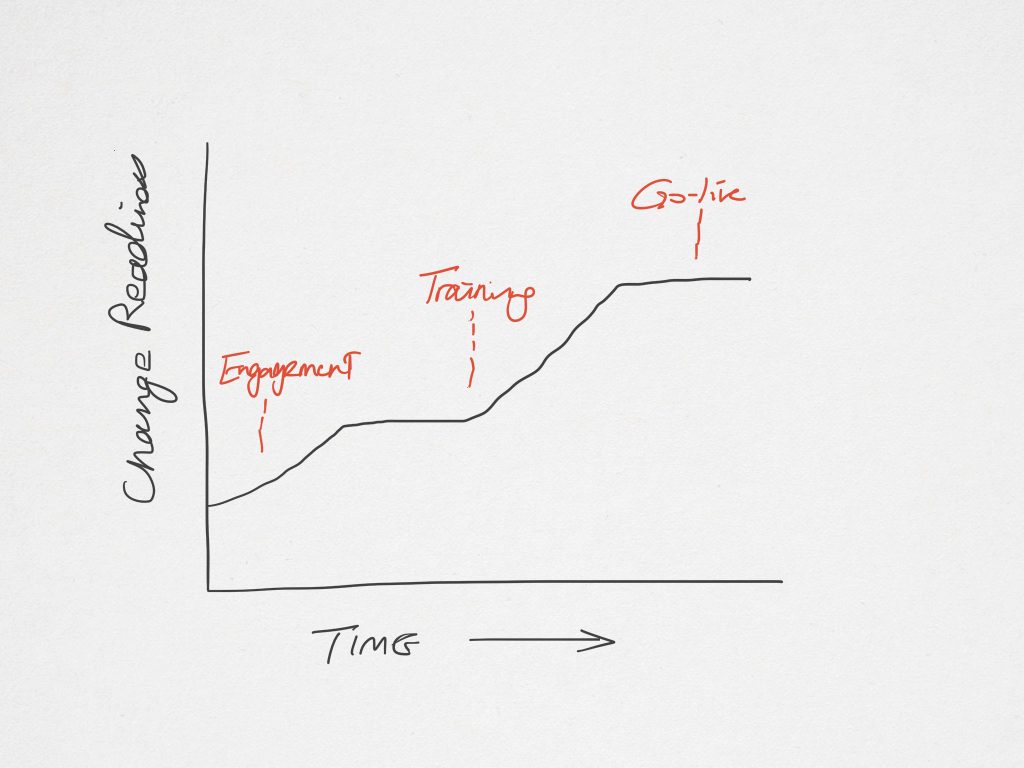
Toolkit 3: Behavior Over Time Graph: Anticipating and Tracking Stakeholder Experience
The Behavior Over Time Graph is a powerful tool for anticipating and tracking stakeholder behavior throughout the change process. Explore a specific case where stakeholders’ reactions were plotted over time, providing significant insights into the need for additional interventions, obstacles faced, and alignment with anticipated timelines.
Here is an example of a behavior over time graph.
Change readiness over time plotted against change milestones
Example: “During the rollout of a new performance management system in a corporate setting, the Behavior Over Time Graph was employed to track employee sentiments. As the system was implemented, the graph revealed an initial dip in engagement, prompting the change team to introduce targeted communication and training interventions. The subsequent rise in positive sentiments demonstrated the effectiveness of these interventions, showcasing the power of anticipating and responding to stakeholder behavior over time.”
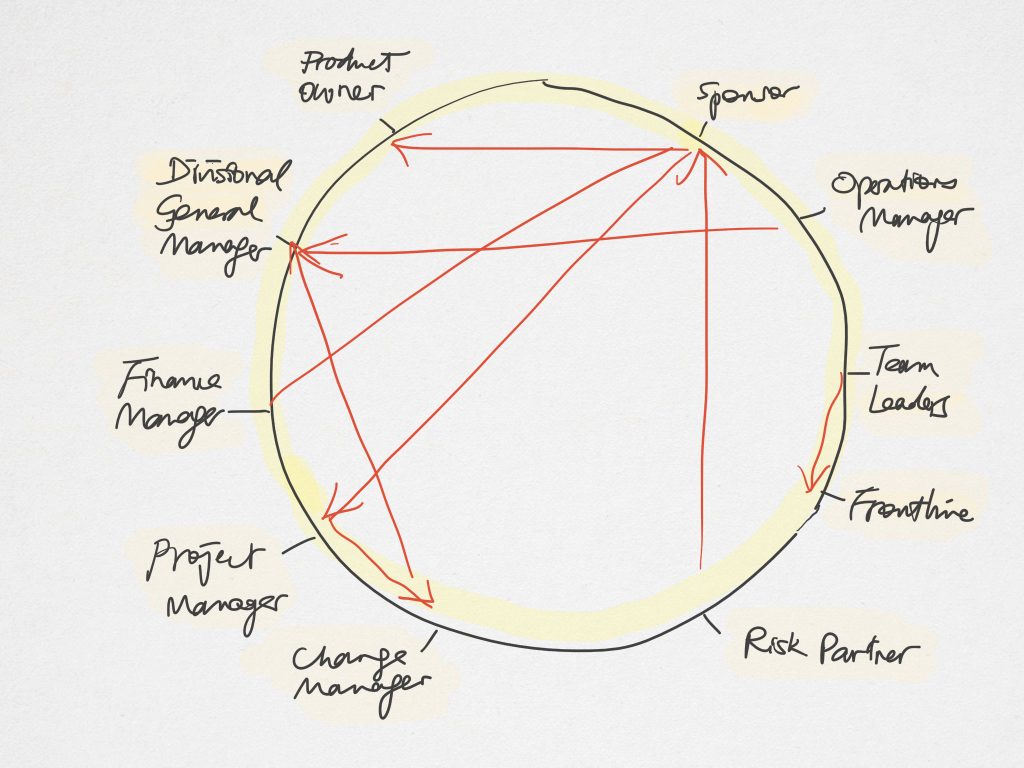
The Connected Circles Analysis chart is indispensable for understanding the influencing powers of various stakeholders in an agile project. Through a practical example, discover how this analysis unveiled power dynamics, aiding the change manager in resolving relationship issues, mitigating risks, and leveraging the network for improved outcomes within the stakeholder group. A range of stakeholders are thrown together within the same project from the beginning and there is a high expectation of successful collaboration and teamwork across the board. This analysis helps you to visualise the power dynamism and influence mechanisms amongst different stakeholders.
With the insight gained from this, the change manager can better focus on how to resolve any relationship issues, risks, and leverage the network to achieve better relationships and outcomes within the group.
Project stakeholder influence dynamics
Example: “In a cross-functional agile project within a large organization, the Connected Circles Analysis chart was used to understand the influencing powers of various stakeholders. By visualizing the dynamics, the change manager identified potential conflicts and areas of collaboration. This insight facilitated proactive measures to enhance relationships, resolve conflicts, and leverage the collective influence of stakeholders for a more cohesive and collaborative project environment.”
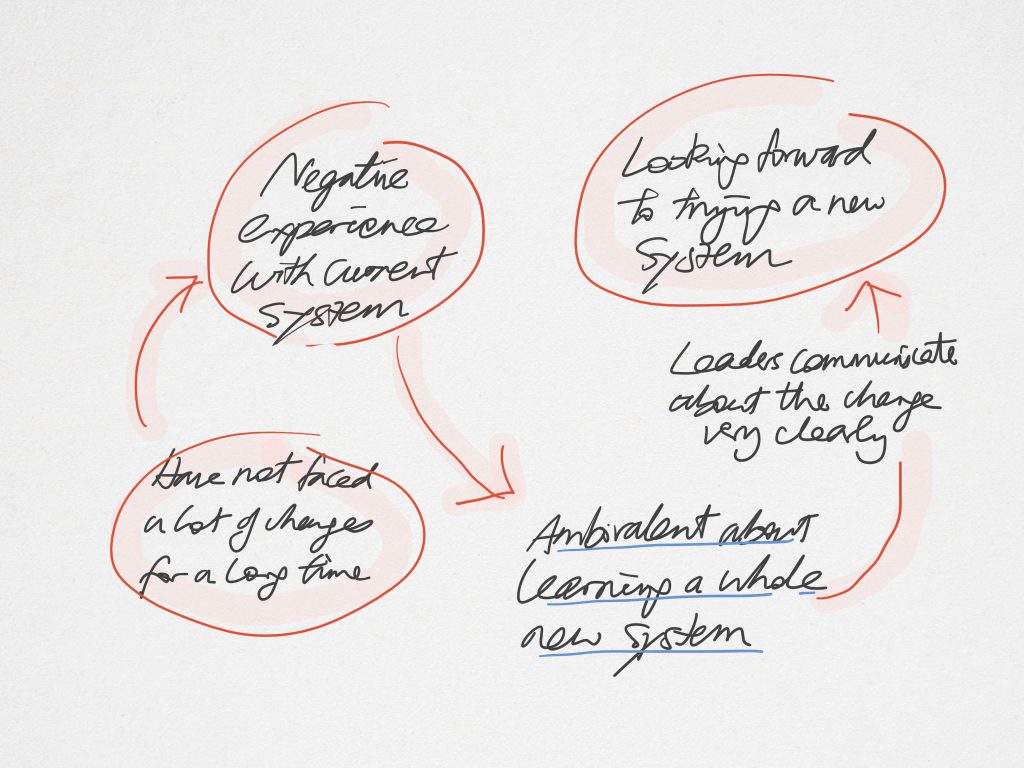
Toolkit 5: Causal Loop Diagram: Systems Thinking for Agile Projects
Systems thinking is critical in agile projects, emphasizing the need to understand how different components interact. The Causal Loop Diagram helps analyze key factors and their causal relationships within the system.
The below example shows employee sentiments toward a system change. This is a very simplified version of what happens since in real scenarios there could be various factors that are reinforcing each other, leading to lots of arrows pointing at different directions. At a more sophisticated level, you may assign points in terms of the strength of the causal relationship. At a basic level even plotting the causal relationship between a few key factors may generate key insight into the ‘why’ of the dynamics of a situation.
Causal loop diagram of the rationale of stakeholder sentiments
Example:
“In a manufacturing company implementing agile practices across departments, the Causal Loop Diagram was applied to understand the dynamics of employee sentiments toward process changes. By mapping out the causal relationships between factors such as training effectiveness, leadership communication, and workflow adjustments, the change team gained a holistic view. This enabled them to address root causes, leading to a more systemic and sustainable improvement in employee sentiments over time.”
In the dynamic landscape of organizations undergoing numerous agile changes, the ability to capture and visualize these transformations becomes paramount for informed decision-making. Data visualization emerges as a powerful tool, offering stakeholders a comprehensive understanding of the organizational change landscape. It enables them to navigate through various changes, identify key capacity challenges, recognize crunch periods, understand the velocity of changes over time, and pinpoint areas requiring additional support.
To effectively navigate this complex terrain, organizations can leverage advanced tools such as The Change Compass. This tool provides a consolidated view of change, facilitating improved planning and implementation strategies. By integrating operational routines that consistently focus on change data alongside other business and project information, organizations can systematically enhance their change capability. This process involves regular reviews, engaging stakeholder discussions, iterative refinement of change tactics, and adaptive adjustments to plans in anticipation of evolving change dynamics.
In adopting such a holistic approach, organizations not only streamline their change management processes but also foster a culture of constant improvement and adaptability. The use of tools like The Change Compass becomes instrumental in creating a unified vision of change, aligning stakeholders, and ensuring that the organization remains agile and responsive in the face of ongoing transformations.

