Making impact with change management charts – Infographic

Mar 8, 2022 | Change Measurement

Latest Articles

Get the latest change articles delivered to you!
Subscribe Now

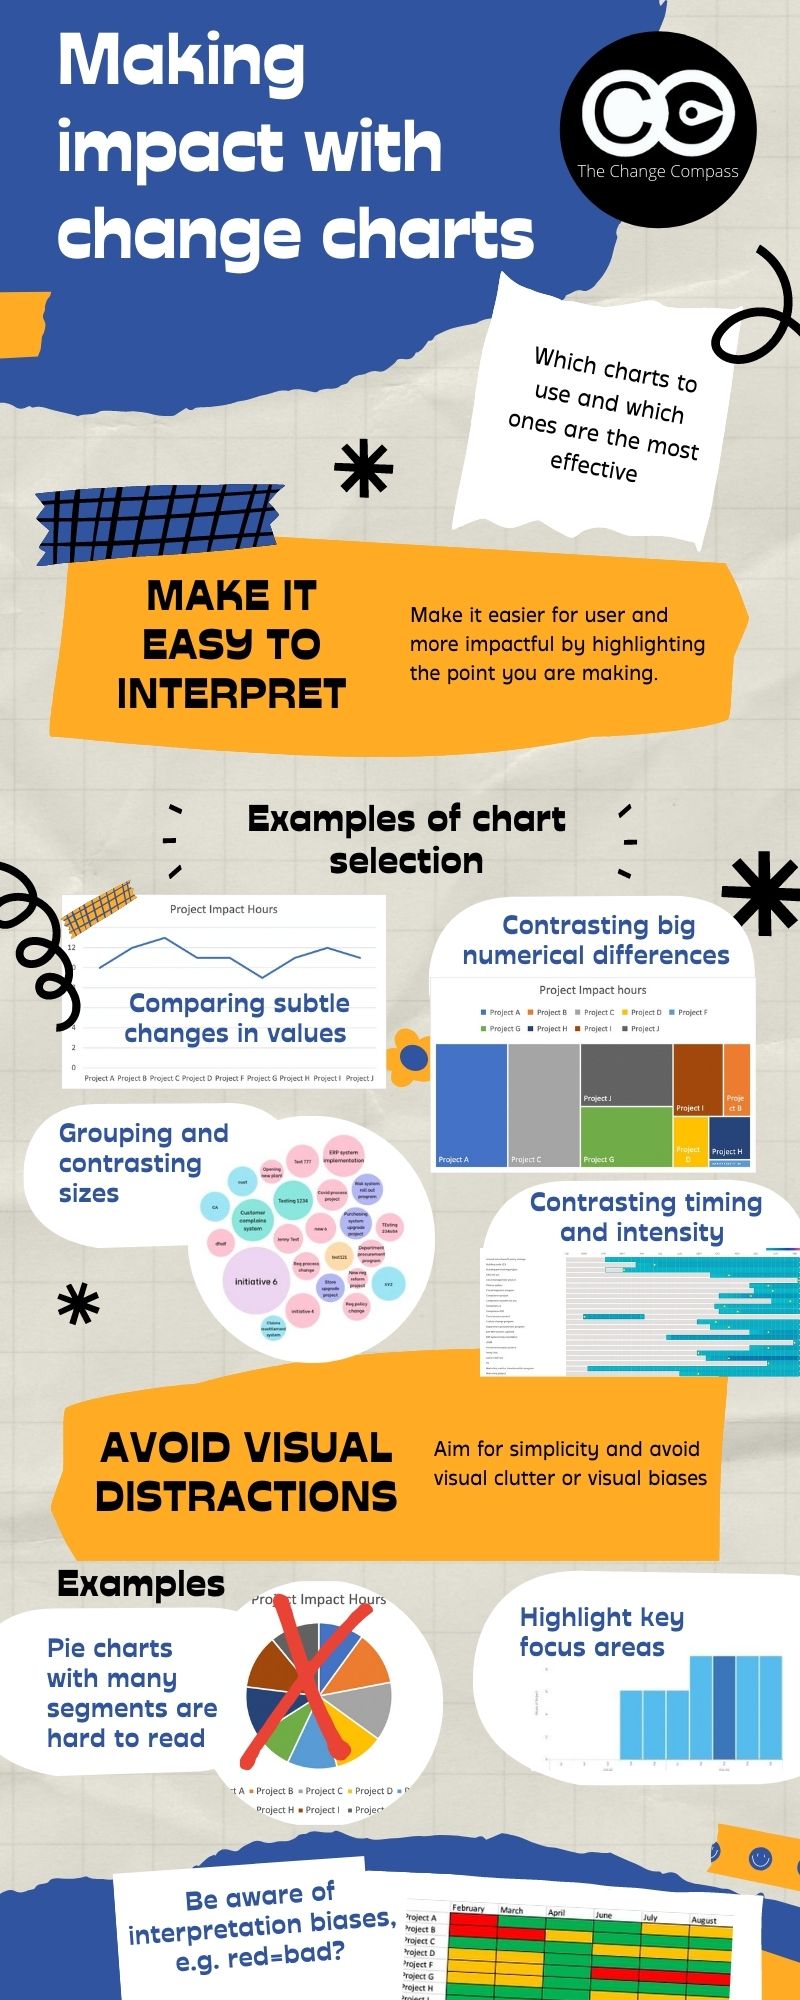
How do we make an impact by selecting the right change management charts for the points we are trying to make?

Which charts should we be choosing?

Are there tips to make it easier for the audience to understand?

What are some common pitfalls in creating effective charts?

Check out our infographic by clicking this link to download it.

To read more about storytelling through change management data, check out our Ultimate Guide to Storytelling with Change Management Data.

Related Posts

How organisational change management software drives adoption

How organisational change management software drives adoption

Key Highlights Organisational change management software is essential for driving successful adoption of new processes, technologies, and business models. Modern change management tools offer advanced features, including stakeholder analysis, project tracking,...