How to build a change capacity model for your organisation
A change capacity model is a structured framework that defines and measures how much change a specific business unit, team or stakeholder group can absorb effectively at any given time, before performance and adoption start to degrade. It treats capacity as a multi-dimensional construct rather than a single number, capturing operational bandwidth (workload, time, attention), psychological readiness (sentiment, trust, fatigue), capability (skills and prior change experience), and leadership availability. A working capacity model is dynamic. It is updated continuously as initiatives complete, new programmes launch, or stakeholder conditions shift, and it informs sequencing and sponsorship decisions at the portfolio level.
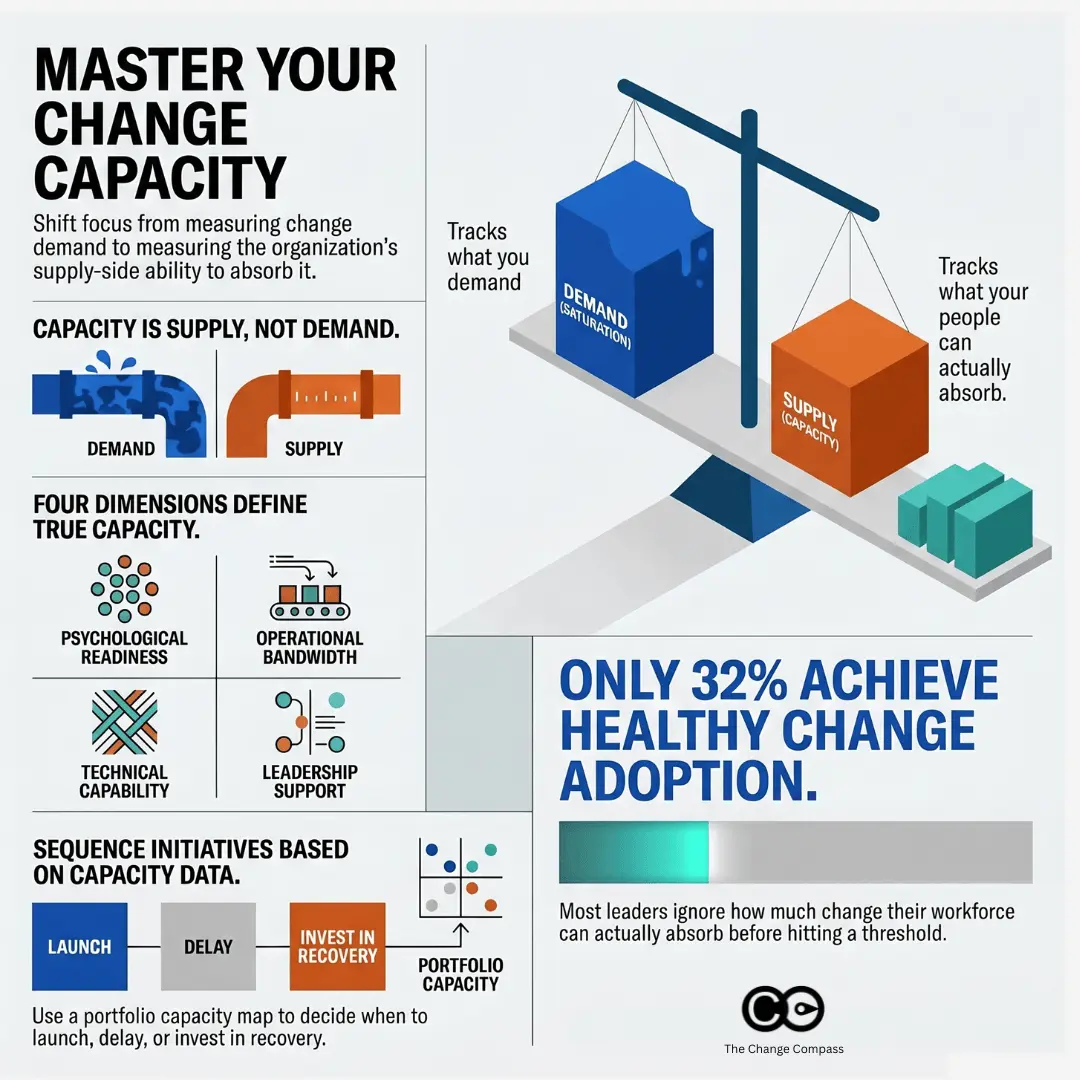
A July 2025 Gartner study found that only 32% of business leaders report achieving healthy change adoption by employees. The research defines healthy adoption not just as compliance, but as employees acting on change, doing so on time, and without undue stress or disengagement. On that measure, two thirds of organisations are failing.
The most common diagnosis is that the individual change programmes were too complex, too poorly sponsored, or too poorly communicated. That diagnosis is sometimes right. But the more systemic explanation is something else entirely: organisations simply do not know how much change their workforce can absorb. They have a clear view of what they are demanding: the change portfolio. They have almost no structured view of what each part of the business can supply.
A change capacity model addresses the supply side. It is a structured, multi-dimensional assessment of each business unit or stakeholder group’s current ability to absorb change effectively. It tells you, before you commit to a launch date or a sequencing plan, which parts of your organisation are genuinely ready to receive more change and which are already at or past their threshold.
This article explains what a change capacity model is, how to build one, and how to use it to make sequencing and prioritisation decisions that reflect what your organisation can actually handle.
Why “capacity” needs a better definition
When change leaders talk about capacity, they usually mean one of two things: time or morale. Is this team’s calendar full? Are they tired? These are reasonable questions, but they are inadequate as a basis for a portfolio-level decision.
Capacity is not a single variable. A team can have ample time in their calendars and still lack the psychological readiness to engage with another round of change. A team can have high morale and healthy engagement scores and still lack the technical experience to adopt a specific type of technology change without significant support. A team can have all of the above and still be constrained by a management layer that is already carrying three times the typical change-leadership load.
The research makes the point clearly. According to Gartner’s 2025 analysis of change adoption, workers with high trust in their organisation have a capacity for change that is 2.6 times greater than those with low trust, and employees in teams with strong cohesion have 1.8 times the change capacity of those in fragmented teams. Neither of these factors appears in a bandwidth assessment. Neither of them appears in an engagement survey cut by average scores. They are distinct dimensions of capacity that require deliberate measurement.
A robust change capacity model treats capacity as a multi-dimensional construct, assesses it by stakeholder group rather than by initiative, and tracks it over time rather than treating it as a fixed condition.
It is also worth clarifying what a capacity model is not. It is not a change saturation measurement, which tracks how much change is currently being demanded of each group. Saturation measurement answers the demand side of the equation: what is being placed on people. Capacity modelling answers the supply side: what people can absorb. The two should be read together, but they are built differently and capture different things. If you are new to the saturation concept, What is change saturation? provides a full foundation before building the capacity model alongside it.
What a change capacity model includes
A complete change capacity model has three components:
A capacity taxonomy: a defined set of dimensions along which capacity is assessed, consistently applied across all groups in the portfolio.
A group-level assessment: a scored profile for each business unit or stakeholder group across those dimensions, produced through a combination of data inputs.
A portfolio-level map: an aggregated view that allows you to compare capacity across groups, identify constraints, and integrate capacity data into your sequencing and governance decisions.
The model should be designed to be maintained over time, not just completed once. Change capacity is dynamic. It degrades under sustained load, recovers once significant initiatives complete, and can be deliberately built through targeted intervention. A model that is only run at the start of a financial year will be misleading by the second quarter.
The four dimensions of change capacity
The core of any capacity model is its taxonomy of dimensions. What follows is a four-dimension framework that covers the factors consistently shown to predict change absorption at the group level. Organisations should adapt the specific inputs and scoring criteria to their context, but the four categories represent the minimum viable model.
Absorptive capacity: psychological and emotional readiness
Absorptive capacity reflects the degree to which a group is psychologically prepared to receive and engage with change. It is shaped by recent history more than by current intent: how previous changes landed, how much adoption debt remains unresolved, and how much trust exists in the change process itself.
Key factors include:
- The outcome quality of recent changes: did the last programme actually deliver what was promised? Groups that have experienced repeated change that underdelivered have lower absorptive capacity for the next wave, regardless of how good that next programme is.
- Adoption debt: the volume of incomplete adoption from previous initiatives that a group is still carrying. A team still operating workarounds from a system implementation six months ago has effectively not finished that change, even if the project has been closed. The 10 signs of change overload are often the visible symptoms of exactly this condition: groups carrying adoption debt from previous programmes that compromises their absorptive capacity for the next one.
- Trust in leadership and in the change process. Gartner’s research found that 79% of employees have low trust in change. In organisations where this is the predominant sentiment, absorptive capacity is structurally constrained regardless of what the current BAU workload looks like.
Operational capacity: bandwidth available for change activity
Operational capacity is the dimension most organisations measure, and the one they over-index on. It is the time and bandwidth available for change-related activity: attending training, participating in pilots, adjusting to new processes, and absorbing the productivity dip that accompanies any significant transition.
Factors to assess include:
- Current BAU workload and whether peak operational periods coincide with planned change activity
- Active project and programme commitments beyond the change portfolio, including IT delivery work, regulatory deadlines, and business development activity
- Span of management control: managers with broader spans have less time per direct report to invest in change support, which research published in PMC links to higher work-related stress and reduced leadership effectiveness during organisational transitions
- Prior unplanned workload demands: business units experiencing performance pressure, customer escalations, or operational incidents are operating with reduced bandwidth for anything outside the critical path
Operational capacity is the dimension most likely to be seasonal and volatile. A business unit that has high operational capacity in February may have near-zero capacity in September if that is their peak period. The model must capture this temporal dimension, not just a point-in-time snapshot.
Capability capacity: skills and experience for this type of change
Capability capacity is the degree to which a group has the existing skills, knowledge, and change experience required to adopt the specific type of change being asked of them. This dimension is change-type dependent: the capability profile that matters for a technology transformation is different from the one that matters for a process redesign or a structural reorganisation.
The most useful indicators are:
- Prior experience with this category of change. A team that has successfully adopted two previous CRM implementations has demonstrably higher capability capacity for a third than a team approaching it for the first time, even if both have identical bandwidth.
- Change management maturity at the group level: the degree to which a group has developed consistent habits for navigating transitions, including strong adoption of learning and development programmes and a track record of embedding new ways of working.
- Digital literacy, where technology change is the primary change type in the current portfolio.
- Learning velocity from historical data: how quickly this group completed adoption milestones in comparable previous programmes.
Organisations that track adoption data at the initiative level over time are well-positioned to build this dimension. Those that do not have it in structured form can use calibrated manager assessments as a proxy.
Leadership capacity: manager and sponsor bandwidth
Gartner has noted that managers often lack the capacity to serve as the sole champions for change in their teams, and that expecting them to sell the change, model new behaviours, and simultaneously create safe space for their people frequently produces manager fatigue before the programme has even reached its most demanding phase. Leadership capacity is the dimension most consistently overlooked, and often the binding constraint on the entire model.
Leadership capacity includes:
- The number of current change initiatives requiring active management-layer support: briefing, cascade, coaching, and problem-solving. Each initiative that requires a manager to actively champion change is a draw on a finite pool of leadership attention.
- Manager change management competency: the skill level of the frontline management layer in facilitating transitions, having change conversations, and sustaining momentum without top-down pressure.
- Sponsor quality and availability in the relevant business unit: whether the accountable executive sponsor has genuine commitment and time to discharge their sponsorship obligations.
- Whether the leadership layer itself is subject to change (a restructure, leadership rotation, or change in reporting lines) concurrent with the change programme. A management layer in transition has significantly reduced capacity to lead change for the teams below it.
How to score capacity across your organisation
Turning the four-dimension framework into a usable model requires a scoring structure that is consistent, calibrated, and practical to maintain. The following process is designed to work with the data most organisations already have, without requiring a dedicated analytics infrastructure to get started.
Step 1: Define your group taxonomy. Use the same stakeholder group or business unit classifications as your change impact assessments and saturation model. Consistency across models is essential: the value of a capacity model is that it can be read alongside your demand data. If your groups are defined differently across tools, the integration breaks down.
Step 2: Score each group on each dimension. Use a three-point or five-point scale per dimension, with defined criteria for each score level. Three-point scales (high, medium, low capacity) are easier to calibrate and maintain; five-point scales allow for more granularity once the model matures. The scoring process should draw on multiple data sources:
- Pulse survey data for absorptive capacity
- Project and workload data for operational capacity
- Adoption history and HR learning data for capability capacity
- Manager assessment and initiative load data for leadership capacity
Step 3: Build your Composite Capacity Index. Aggregate the four dimension scores for each group into a single index. At first pass, equal weighting across dimensions is reasonable. More sophisticated models apply weights based on the change type: a technology-heavy portfolio should weight capability capacity more heavily; a structural reorganisation should weight absorptive and leadership capacity more heavily.
Step 4: Create your portfolio capacity map. Visualise the capacity profile of all groups together. This is your baseline: the supply-side view of your portfolio. It tells you where capacity is strong (groups that can absorb additional change without significant risk), where it is constrained (groups approaching their limit), and where it is depleted (groups that should not be the target of new significant change without deliberate remediation).
Step 5: Establish a refresh cadence. Quarterly is the minimum. After every major programme milestone, update the capacity data for affected groups: absorptive capacity changes when an initiative lands well or badly; operational capacity changes as workload peaks and troughs; leadership capacity changes when sponsors rotate or managers leave.
Integrating capacity data into sequencing decisions
The capacity model pays for itself when it changes the sequencing and timing decisions that shape your change portfolio. Three specific applications are worth building into your governance process.
Pre-commitment capacity checks
Before any new initiative is added to the portfolio and a go-live date committed to leadership, run a capacity check for every affected group. Which dimensions are currently constrained? Does the timing align with a high-capacity period or a low-capacity one? What capacity recovery is expected from changes currently in flight? This is a governance question, not just a change management question: it belongs in the portfolio approval process, not as a post-decision consideration.
Capacity recovery planning
When a major initiative completes, the affected groups do not immediately return to full capacity. Absorptive capacity in particular requires recovery time: the period in which new ways of working are consolidated, adoption debt is resolved, and the psychological overhead of sustained change decreases. Building deliberate recovery windows into the portfolio calendar (protected periods during which no new significant change is initiated against high-load groups) is not a concession to slowness. It is the mechanism by which adoption quality is preserved across the portfolio cycle.
Targeted capacity-building investment
The model identifies structural capacity constraints that cannot be resolved by better sequencing alone. A business unit with consistently low leadership capacity may need a manager development investment. A group with persistently low absorptive capacity may need a reset period combined with visible delivery on past change commitments before it can receive new programmes effectively. These interventions belong in the capability-building plan of the change function, resourced and scheduled like any other programme investment.
Five mistakes to avoid when building a change capacity model
Treating capacity as a single variable. If your model produces a single “capacity score” that is effectively a composite of time and morale, it will mislead. The four-dimension structure exists because each dimension can move independently. A group can be high on operational capacity and low on absorptive capacity at the same time, and conflating the two produces a score that suggests readiness when the reality is more complex.
Building the model once and not maintaining it. A capacity assessment that is run at the beginning of a financial year and not updated is a liability rather than an asset. By the third quarter, the picture has moved significantly. The model must be maintained on a defined cadence, with the discipline to update it after significant programme milestones.
Relying only on survey data. Surveys are an important input, but they capture sentiment rather than structural capacity. Operational capacity, capability capacity, and leadership capacity all have better signals in project data, adoption history, and manager workload data. Build a multi-source model from the start.
Ignoring the leadership capacity dimension. This is the most frequent omission. Organisations that map employee capacity in detail but treat manager capacity as unlimited will consistently underestimate the true constraint on adoption. The management layer is typically the bottleneck: it is where change communication is supposed to cascade, where adoption support happens, and where resistance is first encountered and either addressed or amplified.
Building the model in isolation from demand data. Capacity on its own is not actionable. A group with medium capacity and low change demand has no problem. A group with medium capacity and very high demand is in active risk territory. The capacity model is most powerful when read alongside your change saturation measurement: supply against demand, at the group level, tracked over time.
How digital tools support change capacity modelling
Maintaining a change capacity model manually, across multiple groups, multiple dimensions, and quarterly update cycles, is feasible for smaller organisations but becomes increasingly difficult as portfolio size grows. The model depends on data from multiple sources (pulse surveys, project registers, adoption tracking, HR data), and integrating those sources manually introduces both effort and lag.
Digital change management platforms such as Change Compass are designed to support exactly this kind of portfolio-level intelligence. Rather than building capacity data separately from initiative data, a purpose-built platform integrates both: initiative volume and impact data sits alongside capacity inputs, enabling a live view of where demand is running ahead of supply across the organisation. When capacity data is updated (after a programme completes, after a pulse survey cycle, or after a manager assessment) the platform refreshes the portfolio picture in real time, rather than requiring a manual rebuild of the model.
From capacity snapshot to portfolio governance
The goal of a change capacity model is not to produce an interesting dashboard. It is to change the questions your leadership and portfolio governance teams are asking before they approve new change commitments. Instead of “is this initiative ready to launch?” the question becomes: “is the receiving organisation ready to adopt it?”
That shift is significant. It moves the accountability for change success upstream, into the portfolio decisions that shape the timing and sequencing of change, rather than leaving the change management function to manage the consequences of decisions already made. It also creates a shared, data-based language for conversations that have traditionally been difficult: the conversation about deferring a launch, protecting a business unit, or reducing the simultaneous change load on a particular team.
Start with the data you have. Score the four dimensions using proxy measures where better data does not yet exist. Build the model for your highest-priority groups first, then expand. The first iteration does not need to be precise to be valuable. It needs to be consistent and maintained, and it needs to be read alongside your change demand data, not in isolation.
The organisations in the 32% that achieve healthy change adoption by their employees have typically not found a better communications strategy or a better sponsor. They have built a systematic view of what their workforce can absorb, and they have used that view to make different decisions about what to ask of them and when.
Frequently asked questions
What is a change capacity model?
A change capacity model is a structured assessment of a business unit or stakeholder group’s ability to absorb change at a given point in time. It typically covers multiple dimensions: psychological readiness, operational bandwidth, change-relevant skills, and leadership capacity. It is tracked over time to inform portfolio sequencing and governance decisions.
How is change capacity different from change saturation?
Change saturation measures the demand side: how much change is currently being placed on a group relative to their ability to absorb it. A capacity model measures the supply side: what the group is inherently able to absorb given their current psychological state, workload, capability level, and leadership support. The two should be read together, but they are built and maintained differently.
How often should a change capacity model be updated?
Quarterly is the recommended minimum. In addition, the model should be updated after any significant programme milestone: particularly when a major initiative completes, a leadership change occurs in a key business unit, or a pulse survey reveals a significant shift in sentiment. Capacity is dynamic; a model that is only updated annually will mislead more than it guides.
What data do you need to build a change capacity model?
A basic model can be built with: pulse survey data (for absorptive capacity), project and workload data (for operational capacity), historical adoption data (for capability capacity), and manager assessments (for leadership capacity). Organisations that do not have all of these in structured form can start with calibrated manager input across all four dimensions and layer in more granular data as the model matures.
How do you use a capacity model to make sequencing decisions?
The most direct application is a pre-commitment capacity check: before adding a new initiative to the portfolio, reviewing the capacity profile of every group the initiative will affect and assessing whether the planned timing aligns with a high-capacity period. The model also supports capacity recovery planning (building in protected windows after high-load periods) and identifying groups that need targeted capacity-building investment before they can receive additional change effectively.
References
- Gartner (July 2025). Gartner HR Research Finds Just 32% of Business Leaders Report Achieving Healthy Change Adoption by Employees. Gartner Newsroom.
- Gartner (2025). Leaders Today Must Routinize, Not Inspire, Change. Gartner.
- Gartner (2024). Building Resilience in Change Management: Insights for CHROs. Gartner.
- Gartner (February 2024). Gartner Says Finance Leaders Should Factor Change Fatigue into Project Planning. Gartner Newsroom.
- Gartner / HBR (2023). Employees Are Losing Patience with Change Initiatives. Harvard Business Review.
- Aasa, A. et al. (2025). Expanded span of control, leadership and management performance, work-related stress, and job satisfaction among first-line managers: A repeated cross-sectional study. PMC / National Library of Medicine.
- Prosci (2024). Assessing Your Organizational Change Management Capabilities. Prosci Blog.
- Prosci (2024). Metrics for Measuring Change Management. Prosci Blog.
- The Change Compass. Managing Change Saturation: How to Prevent Initiative Fatigue and Portfolio Failure.