Change management teams have long prided themselves on enabling organisations to adapt, evolve, and thrive in the face of constant disruption. Yet, a curious irony persists: many change management teams themselves are reluctant to change. They are trapped in a cycle of executing individual projects, refining legacy methodologies, and building capabilities through workshops and sessions-year after year, with little evolution in their own practice. This phenomenon can be described as “Change Management Teams’ Stockholm Syndrome”-where practitioners defend the very systems and routines that may be limiting their impact, just as employees in transformation-fatigued organisations do.
This syndrome is not just about comfort; it is also about fear. Changing the way change is managed is risky. There is a real concern that if things do not go well, the change team may be blamed. The prevailing attitude is often: “If everyone else is doing it this way, why should we change?” This mindset is a significant barrier to progress and innovation.
And this is not to specifically single-out change management teams. In the corporate world, process and methodology helps to create certainty and clarity. Without it, there could be chaos. As a result, organisations as a whole and its teams, tend to stick to the convention to run the business.
The Legacy Methodology Trap
Most change management teams remain wedded to legacy methodologies-structured, linear frameworks that were designed for a pre-digital era. These approaches often emphasise process over people, form over function, and documentation over data. While these methods have served organisations well in the past, they are increasingly mismatched with the realities of today’s digital and AI-driven world.
The result? Change management teams risk becoming irrelevant, unable to provide the strategic value that modern organisations demand. They are seen as facilitators rather than strategists, focused on executing rather than shaping change. This legacy focus also means that teams miss out on the benefits of agile, data-based approaches that are now commonplace in other disciplines such as marketing, operations, human resources and customer experience.
The Cost of Standing Still
The consequences of this stagnation are profound:
No Innovation: Without evolving their own practices, change management teams cannot credibly advocate for innovation elsewhere in the organisation.
Legacy vs. Agile: Teams remain focused on rigid, legacy methodologies, missing opportunities to leverage agile, iterative, and data-driven approaches that are better suited to today’s fast-moving environment.
No Data-Based Insights: Historical data is often ignored, meaning teams cannot learn from past successes or failures, nor can they provide predictive insights to guide future change initiatives.
Inability to Influence Strategically: Without data and digital fluency, change teams struggle to influence at a strategic level, limiting their ability to shape the direction of the organisation.
Credibility Challenges: Project teams and leaders may increasingly question the value of change management, seeing it as a bureaucratic function rather than a strategic partner. On the other hand, change managers spend significant time on arguing/positioning their worth, versus delivering value.
The New Digital and AI Reality
The world has changed. Digital transformation is no longer a buzzword-it is a reality. AI is reshaping how work gets done, automating routine tasks, and providing deep insights that were previously unimaginable. Other disciplines have already embraced these trends, using data to inform decisions, automate low-value work, and focus on high-value strategic activities.
Yet, many change management teams are still operating in a pre-digital mindset. They are not leveraging the power of automation, AI, or data analytics to transform their own work. This is not just a missed opportunity-it is a threat to the relevance and impact of the discipline.
The Comfort of the Familiar
Why do so many change management teams resist changing their own ways of working? The answer lies in what we as change practitioners already know about human psychology. Change is hard, even for those who advocate for it. The status quo is comfortable, and the risks of trying something new are real. Teams may fear failure, blame, or simply the unknown. They may also suffer from “Organisational Stockholm Syndrome,” defending the very systems that exhaust them and limit their potential.
Looking Ahead
The solution is clear: change management teams must catch up with industry trends that other disciplines have already embraced. They must leverage data to inform their work, automate lower-value tasks, and leapfrog to higher-value strategic roles-advising on change strategy, adoption, and benefit optimisation across the organisation. Only by transforming themselves can they credibly support the transformation of others.
Barriers and Breakthroughs in Digital Change Management
Facing the Realities of Digital and Data-Driven Transformation
As change management teams recognise the need to evolve, they encounter a complex array of barriers that are both technical and cultural. The journey toward digital and data-driven change management is not simply about adopting new tools or methodologies; it is about transforming mindsets, processes, and organisational structures. The following barriers are among the most persistent and impactful.
Key Barriers to Digital and Data-Driven Change Management
Resistance to Change
Even within change management teams, resistance is a formidable obstacle. Many practitioners are comfortable with established processes and fear the disruption that comes with new digital tools or methodologies. This resistance is compounded by concerns over job security (e.g. the result of AI and automation), the risk of failure, and the potential for blame if initiatives do not succeed.
Integration with Legacy Systems
Many organisations rely on outdated systems that are not designed to work with modern digital solutions. Integrating new technologies-such as AI-powered analytics or automation platforms – with legacy processes such as spreadsheets and templates that are often complex, time-consuming, and costly. This challenge can stall progress and limit the ability to leverage data-driven insights.
Lack of Digital Expertise
There is a significant skills gap in many change management teams. Digital transformation requires a blend of technical, analytical, critical and strategic competencies that are not always present. Without the right expertise, teams struggle to implement and sustain new digital initiatives.
Poor Data Quality and Access
Effective data-driven change management relies on accurate, timely, and accessible data. However, many organisations struggle with fragmented data sources, inconsistent data quality, and limited access to meaningful insights. Only a minority of companies report having access to accurate data that can inform decision-making.
Failure to Link Strategy to Execution
Even with a clear digital or data-driven strategy, many change management teams struggle to translate this into daily practice. There is often a disconnect between strategic intent and operational execution, leading to missed opportunities and diminished impact.
Inadequate Leadership and Communication
Successful digital transformation requires strong leadership and effective communication. When leaders fail to articulate a compelling vision, provide adequate support, or foster a culture of transparency and trust, change initiatives are more likely to falter.
Cultural Inertia and Lack of Experimentation
Organisational culture plays a critical role in enabling or hindering change. A culture that resists experimentation, learning, and adaptation will struggle to embrace digital and data-driven approaches. Without the ability to experiment and learn from failures, progress is slow and innovation is stifled.
Overcoming the Barriers: Practical Breakthroughs
Despite these challenges, there are proven strategies that change management teams can adopt to overcome barriers and accelerate their digital and data-driven transformation.
Embrace Agile and Data-Driven Methodologies
Shift from rigid, legacy frameworks to agile, iterative approaches that prioritise learning, adaptation, and data-driven decision-making. This allows teams to respond more quickly to changing circumstances and to leverage real-time insights.
Invest in Digital Upskilling
Build digital literacy and analytical skills within the change management team. This can be achieved through targeted training, partnerships with digital experts, and the recruitment of data-savvy professionals.
Improve Data Quality and Accessibility
Implement robust data governance practices to ensure data accuracy, consistency, and accessibility. Invest in tools and platforms that enable seamless data integration and analysis across the organisation.
Strengthen Leadership and Communication
Develop a clear, compelling vision for digital change management and communicate it consistently across the organisation. Engage leaders at all levels to champion the change and provide ongoing support to teams.
Foster a Culture of Experimentation and Learning
Encourage teams to experiment with new tools, methodologies, and approaches. Create a safe environment where failure is seen as an opportunity for learning and improvement.
Align Strategy with Execution
Ensure that digital and data-driven strategies are translated into actionable plans and daily practices. Regularly review progress, gather feedback, and adjust course as needed to maintain alignment and drive results.
The Path Forward
The barriers to digital and data-driven change management are significant, but they are not insurmountable. By addressing resistance, building digital expertise, improving data quality, strengthening leadership, and fostering a culture of experimentation, change management teams can break free from legacy mindsets and unlock new levels of impact and credibility.
Leapfrogging to Strategic Impact
From Execution to Strategic Influence
For too long, change management teams have been seen as facilitators of change rather than architects. Their work has been largely transactional-running workshops, refining methodologies, and supporting project delivery. The digital and AI-driven world, however, demands a fundamental shift in how change is managed and led. The opportunity now is for change management to become a true strategic partner, leveraging data, automation, and AI to shape the direction and success of organisational transformation.
Leveraging Data for Deeper Insights and Predictive Power
The most forward-thinking organisations are already using real-time and historical data to inform every aspect of change. This means moving beyond gut feeling and anecdotal evidence to a world where decision-making is driven by robust analytics. Change management teams can now:
Predict Adoption and Resistance: By analysing readiness, engagement, and adoption metrics, teams can anticipate where resistance will emerge and intervene proactively.
Measure Impact in Real Time: Digital tools and platforms enable continuous monitoring of change initiatives, allowing for rapid course correction and more responsive leadership.
Optimise Communication and Support: Data-driven insights help tailor communication strategies to different stakeholder groups, ensuring messages resonate and support is targeted where it is most needed.
Automating the Routine, Elevating the Strategic
Automation and AI are transforming the landscape of change management by taking over repetitive, low-value tasks. Chatbots, virtual assistants, and automated workflows can handle routine communications, answer common questions, and even deliver personalised training modules. This frees up change practitioners to focus on higher-value activities, such as:
Advising on Change Strategy: With more time and better data, change teams can provide strategic counsel to senior leaders, helping shape transformation agendas and ensure alignment with business goals.
Driving Adoption and Benefit Realisation: By leveraging real-time analytics, teams can identify barriers to adoption early, design targeted interventions, and track the realisation of benefits across the organisation.
Leading Culture Change: Change management is increasingly recognised as a driver of organisational culture. Teams that embrace open, data-driven, and agile approaches can foster a culture of continuous improvement and innovation.
Building Credibility and Influence
As change management teams embrace digital and data-driven approaches, they also build credibility with project teams and leaders. By providing clear, evidence-based recommendations and demonstrating measurable impact, change practitioners can move from being seen as process administrators to trusted advisors. This shift is critical for influencing at a strategic level and ensuring that change management is embedded in the organisation’s DNA.
The Future of Change Management
The future belongs to organisations that treat change as a continuous, strategic process rather than a series of isolated projects. Change management teams that harness the power of data, automation, and AI will be at the heart of this transformation. They will drive not only the adoption of new technologies but also the cultural and behavioural shifts needed for sustainable success.
A Call to Action
For senior change and transformation practitioners, the message is clear: the time to leapfrog is now. By embracing digital tools, data-driven decision-making, and agile, open approaches, change management can move from the back office to the boardroom. The result will be a profession that is more innovative, influential, and indispensable than ever before.
The organisations that succeed in the digital age will be those that empower their change teams to lead, not just facilitate/deliver, transformation-shaping the future of work, culture, and performance for years to come.
Level 1: Air Traffic Control—Establishing Oversight and Laying the Foundation
Seasoned transformation and change practitioners know the challenge: senior leaders are rarely interested in “change training” but are critical to the success of your change portfolio. Their engagement, understanding, and decision-making set the tone for the entire organization. The question is not how to send them to a course, but how to build their change literacy in a way that is practical, relevant, and embedded in their business agenda.
Here we explore a pragmatic approach to developing senior leaders’ maturity in managing a portfolio of change. In Level 1, we focus on the “Air Traffic Control” phase—establishing initial oversight, surfacing key data, and creating the conditions for informed leadership.
Why Change Literacy Matters at the Top
For senior leaders change portfolio literacy is more than understanding the mechanics of change management. For senior leaders, it’s about:
Seeing the full landscape of change across the business.
Understanding the cumulative impacts on people, operations, and strategy.
Making informed decisions on priorities, pace, and resource allocation.
Without this literacy, leaders risk overwhelming teams, missing strategic opportunities, and failing to deliver on business benefits. The stakes are high: the volume and velocity of change in most organizations today mean that “flying blind” is not an option.
The Air Traffic Control Phase: Creating Oversight and Clarity
The first step in building change literacy is not education—it’s exposure. Like an air traffic controller, senior leaders must be able to see all the “planes in the sky” before they can direct traffic safely and efficiently.
Key Objectives in This Phase:
Establish visibility of all change initiatives.
Surface capacity constraints and people impacts.
Create a shared language and baseline understanding of change activity.
1. Map the Change Landscape
Start by working with your PMO, HR, and transformation teams to create a comprehensive map of all current and upcoming change initiatives. This should include:
Tip: Visual tools such as rollout timelines, calendars, or dashboards are invaluable. They help leaders “see the forest for the trees” and spot potential collisions or overloads.
2. Quantify Capacity and Performance
Next, introduce data on organizational capacity and people performance:
How many initiatives are impacting each business unit?
Where are the pinch points in terms of workload, skills, or engagement?
What is the current state of change fatigue or readiness?
This data grounds the conversation in facts, not anecdotes. It also begins to shift the mindset from project-by-project thinking to portfolio-level oversight.
3. Connect to Business Priorities
Senior leaders are motivated by what’s on their agenda: strategic goals, operational performance, risk, and efficiency/growth. Frame the change portfolio in these terms:
Which initiatives are directly tied to strategic objectives?
Where are there conflicts, duplication, or misalignment?
What are the risks to business performance if changes are poorly sequenced or resourced?
By connecting change data to business outcomes, you make the conversation relevant and urgent.
4. Facilitate the Right Conversations
Rather than presenting data for its own sake, design conversations that help leaders make better decisions:
Where do we need to slow down or pause initiatives to protect capacity?
How can we sequence changes to maximize benefits and minimize disruption?
What trade-offs are required to align with strategic priorities?
These discussions are not about “managing change” in the abstract—they are about running the business more effectively in a complex, dynamic environment.
Practical Tools and Techniques
Change Portfolio Dashboards: Develop a simple, regularly updated dashboard that shows all active changes, status, impacts, and risks. Use visuals to highlight hotspots and interdependencies.
Capacity Charts: Map initiatives against business units and timeframes to show where overload is likely.
Impact Assessments: Brief, high-level assessments of each initiative’s impact on people, processes, and performance.
Monthly Portfolio Reviews: Establish a regular cadence for reviewing the change portfolio with senior leaders, focusing on decision points and resource allocation.
Common Pitfalls and How to Avoid Them
Information Overload: Don’t drown leaders in detail. Focus on key data that supports business decisions.
Siloed Views: Ensure your portfolio view cuts across functions and business units, not just projects within a single area.
Lack of Follow-through: Initial visibility must lead to action—adjusting priorities, reallocating resources, or sequencing initiatives differently.
Building Change Literacy: What Success Looks Like
At the end of the Air Traffic Control phase, senior leaders should:
Have a clear, shared view of all change activity across the business.
Understand where capacity and performance risks lie.
Be able to make informed decisions on sequencing, prioritization, and resource allocation.
Begin to use a common language for discussing change impacts and trade-offs.
Level 2: Change Outcome Ownership—Moving from Oversight to Strategic Leadership
In Level 1, we explored how to help senior leaders achieve “air traffic control”—a clear, shared view of the change landscape and organizational capacity. This foundational oversight is essential, but it’s only the beginning. True change literacy means senior leaders move beyond monitoring activity to taking ownership of change outcomes. This is where their leadership can make the greatest difference.
In Level 2, we’ll look at how to guide senior leaders through this shift. You’ll learn how to help them balance the key levers of change, drive accountability for results, and embed change leadership into the heart of business decision-making.
Why Outcome Ownership Matters
Oversight is about knowing what’s happening. Ownership is about making it happen—delivering the intended benefits, minimizing disruption, and ensuring people are ready and able to perform in the new environment.
When senior leaders own change outcomes, they:
Balance competing priorities: Weighing speed, capacity, business resources, and strategic impacts.
Make informed trade-offs: Deciding where to invest, delay, or accelerate change.
Drive accountability: Ensuring that business leaders—not just project teams—are responsible for adoption and benefits realization.
This is the difference between passive sponsorship and active leadership.
Key Levers for Senior Leaders in Change Outcome Ownership
To build change literacy at this level, focus on five critical levers:
1. Pace and Sequencing
Senior leaders must understand that the pace of change is not just about speed to market—it’s about sustainable adoption. Too much, too fast leads to fatigue and failure; too slow risks losing momentum or competitive advantage.
How to build this lever:
Use data from your change portfolio dashboard to model different sequencing options.
Facilitate scenario planning sessions: “What if we delayed Project X by three months? What would that mean for Project Y and for our people?”
Encourage leaders to weigh the trade-offs between urgency and readiness.
2. Capacity and Resource Allocation
Change does not happen in a vacuum. It requires people, time, and attention—often the same resources needed for business-as-usual.
How to build this lever:
Present clear data on resource constraints and competing demands.
Help leaders see the hidden costs of overloading teams (e.g., increased turnover, reduced engagement).
Support them in making tough calls about where to focus and where to pause or stop initiatives.
3. Business Impact and Strategic Alignment
Not all changes are created equal. Leaders must be able to distinguish between “must-have” and “nice-to-have” initiatives, and ensure alignment with strategic goals.
How to build this lever:
Map each change initiative to strategic priorities and measurable business outcomes.
Use impact assessments to highlight dependencies, risks, and potential synergies.
Challenge leaders to articulate the “why” behind each major change.
4. Readiness and Adoption
Successful change is not just about delivering a project—it’s about ensuring people are ready, willing, and able to work in new ways.
How to build this lever:
Introduce simple readiness assessments for key initiatives.
Share data on adoption rates, feedback, and engagement from previous changes.
Encourage leaders to actively sponsor and communicate about change, not just delegate to project teams.
5. Change Leadership Behaviours
Change literacy is not just a set of skills—it’s a mindset and a set of behaviours. Senior leaders must model the change they want to see.
How to build this lever:
Provide feedback on visible leadership behaviours (e.g., presence in town halls, openness to feedback, willingness to address resistance).
Celebrate and recognize leaders who demonstrate effective change leadership.
Offer targeted coaching or peer learning opportunities focused on change leadership, not just management.
Designing the Right Conversations
At this stage, your role is to facilitate strategic, action-oriented conversations that help leaders take ownership. Some practical approaches:
Portfolio Decision Forums: Regular sessions where leaders review the change portfolio, assess progress, and make decisions on sequencing, resourcing, and prioritization.
Benefit Realization Reviews: Focused discussions on whether intended outcomes are being achieved and what adjustments are needed.
Readiness Deep Dives: Sessions that explore the “people side” of major changes—what’s working, what’s not, and what support is required.
Your job is not to provide all the answers, but to ask the right questions and surface the data that supports informed decision-making.
Practical Tools and Approaches
Scenario Planning Templates: Help leaders visualize the impact of different sequencing or resourcing decisions.
Change Impact Matrices: Map initiatives against strategic goals, business units, and risk factors.
Adoption Dashboards: Track key metrics such as training completion, usage rates, and employee sentiment.
Leadership Action Plans: Simple templates for leaders to track their own change leadership commitments and follow-through.
Common Pitfalls and How to Avoid Them
Defaulting to Project Thinking: Keep the focus on business outcomes, not just project milestones.
Avoiding Tough Trade-offs: Encourage honest discussion about what can be realistically achieved with available resources.
Assuming Readiness: Challenge optimistic assumptions and use data to surface real readiness risks.
What Success Looks Like
When senior leaders move from oversight to ownership, you’ll see:
Active engagement in change portfolio decisions: Leaders are not just reviewing reports—they are making and owning the trade-offs.
Clear accountability for outcomes: Business leaders, not just project teams, are responsible for adoption and benefits.
Greater alignment between change activity and business strategy: Initiatives are sequenced and resourced to deliver on strategic priorities.
Visible leadership behaviours: Leaders are modelling the change, communicating openly, and supporting their teams through transition.
Ownership of change outcomes is the hallmark of mature change leadership. It’s where leaders move from monitoring activity to driving results—and where the real value of your change portfolio is realized.
Level 3: Best Practice—Tracking Benefits, Embedding Adoption, and Managing Change Risks
Having guided senior leaders from initial oversight (“air traffic control”) through outcome ownership, the final phase in building change literacy is embedding best practice. This is where change becomes a core capability—measured, managed, and continuously improved. Senior leaders who reach this stage are not just managing change; they are shaping a culture of agility, resilience, and sustained business value.
What Best Practice Looks Like
In this phase, senior leaders:
Track and realize the benefits of change initiatives.
Monitor and drive adoption, not just implementation.
Proactively manage growth, people, and operational risks.
Balance pace, capacity, and business priorities for ongoing agility.
Model and reinforce change leadership behaviours across the organization.
This is the point where change literacy becomes organizational muscle memory.
1. Tracking Benefits and Adoption
Why it matters: Delivering change is not success—realizing the intended benefits is. Too often, organizations declare victory at go-live, only to find that new systems, processes, or behaviours are not embedded.
How to build this capability:
Define clear success metrics: Establish measurable KPIs for each initiative, linked directly to business outcomes (e.g., increased revenue, reduced cycle time, improved customer satisfaction).
Adoption dashboards: Track usage, compliance, and behavioural indicators, not just technical completion. For example, monitor system logins, process adherence, or customer feedback.
Regular benefit realization reviews: Schedule post-implementation checkpoints (e.g., 30, 60, 90 days) to assess progress against targets and identify gaps.
Close the loop: Use data to drive action—adjust training, communications, or incentives if adoption lags.
Evaluation allows leaders to assess the change initiative’s success, identify improvement areas, and make necessary adjustments for long-term sustainability.
2. Managing Growth, People, and Operational Risks
Why it matters: As the portfolio of change grows, so do the risks—overload, fatigue, competing priorities, and operational disruption. Best practice is about anticipating and mitigating these risks, not reacting after the fact.
How to build this capability:
Risk heatmaps: Maintain a live view of risk hotspots across the change portfolio—where are people stretched, where is performance dipping, where are critical dependencies (including operational ones)?
Scenario planning: Regularly test the impact of new initiatives or shifts in strategy on existing capacity and priorities.
Feedback mechanisms: Create channels for employees and managers to surface risks early—through surveys, forums, or direct leader engagement.
Agility reviews: Encourage leaders to adjust plans, pause, or re-sequence changes based on real-time data and feedback.
3. Embedding Change Leadership Behaviours
Why it matters: The most successful change programs are led from the top. Senior leaders must consistently model the behaviours they expect—transparency, adaptability, resilience, and empowerment.
How to build this capability:
Visible sponsorship: Leaders must remain active and visible throughout the change lifecycle, not just at launch. Their ongoing engagement is the single strongest predictor of success.
Transparent communication: Leaders should share progress, setbacks, and lessons learned openly, reinforcing trust and credibility.
Openness to feedback: Encourage leaders to listen, adapt, and act on input from all levels of the organization.
Recognition and reinforcement: Celebrate teams and individuals who exemplify change leadership, embedding these behaviours in performance management and reward systems.
An effective leader drives momentum by visibly championing the change.
4. Building Organizational Agility
Why it matters: Change is not a one-off event but a continuous capability. Organizations that thrive are those that can adapt, learn, and pivot quickly.
How to build this capability:
Continuous learning: Use each change initiative as a learning opportunity—what worked, what didn’t, and why? Feed these insights into future planning.
Iterative planning: Move from annual change plans to rolling, flexible roadmaps that can adjust to new priorities or market shifts.
Empowerment at all levels: Equip managers and teams with the skills and authority to lead local change, not just execute centrally-driven initiatives.
Culture of experimentation: Encourage calculated risk-taking and innovation, rewarding learning as much as results.
Practical Tools and Techniques
Benefits realization frameworks: Standardize how benefits are defined, tracked, and reported across all initiatives.
Adoption and engagement dashboards: Integrate people metrics (engagement, sentiment, turnover) with project and business metrics.
Change risk registers: Live tools for tracking, escalating, and mitigating risks across the portfolio.
Leadership scorecards: Track and report on leaders’ visible sponsorship and change leadership behaviours.
Common Pitfalls and How to Avoid Them
Focusing only on delivery: Don’t stop at go-live—track benefits and adoption for the full lifecycle.
Ignoring feedback: Build mechanisms to listen and respond to concerns, not just broadcast messages.
Leadership drop-off: Ensure leaders remain engaged and visible, not just at the start but throughout.
Static planning: Avoid rigid annual plans—build in flexibility and regular reviews to respond to change.
High adoption rates: New ways of working are embraced and sustained, not just implemented.
Proactive risk management: Leaders anticipate and address risks before they become issues.
Organizational agility: The business adapts quickly to new challenges and opportunities.
Visible, credible leadership: Senior leaders are recognized as champions of change, inspiring confidence and commitment at every level.
“The ageless essence of leadership is to create an alignment of strengths in ways that make a system’s weaknesses irrelevant.” – Peter Drucker
Sustaining Change Literacy at the Top
Building change literacy in senior leaders is a journey—from initial oversight, through outcome ownership, to embedding best practice. It’s not about training for its own sake, but about equipping leaders with the insight, tools, and behaviours to lead change as a core business capability.
As a transformation/change practitioner, your role is to curate the right data, design the right conversations, and create the right conditions for leaders to learn by doing. When you succeed, change becomes not just something the organization does—but something it is striving to improve, every day.
At The Change Compass, we not only provide the technology/platform to support with change literacy, we also guide you on influencing senior leaders through data. Chat to us to find out more.
In today’s dynamic business environment, managing multiple changes simultaneously is the norm, not the exception. As change transformation experts/leaders, we’re expected to provide clarity, reduce disruption, and drive successful adoption—often across a crowded portfolio of initiatives. In this high-stakes context, it’s tempting to lean on familiar tools and assumptions to simplify complexity. However, some of the most common beliefs about managing multiple changes are not just outdated—they can actively undermine your efforts.
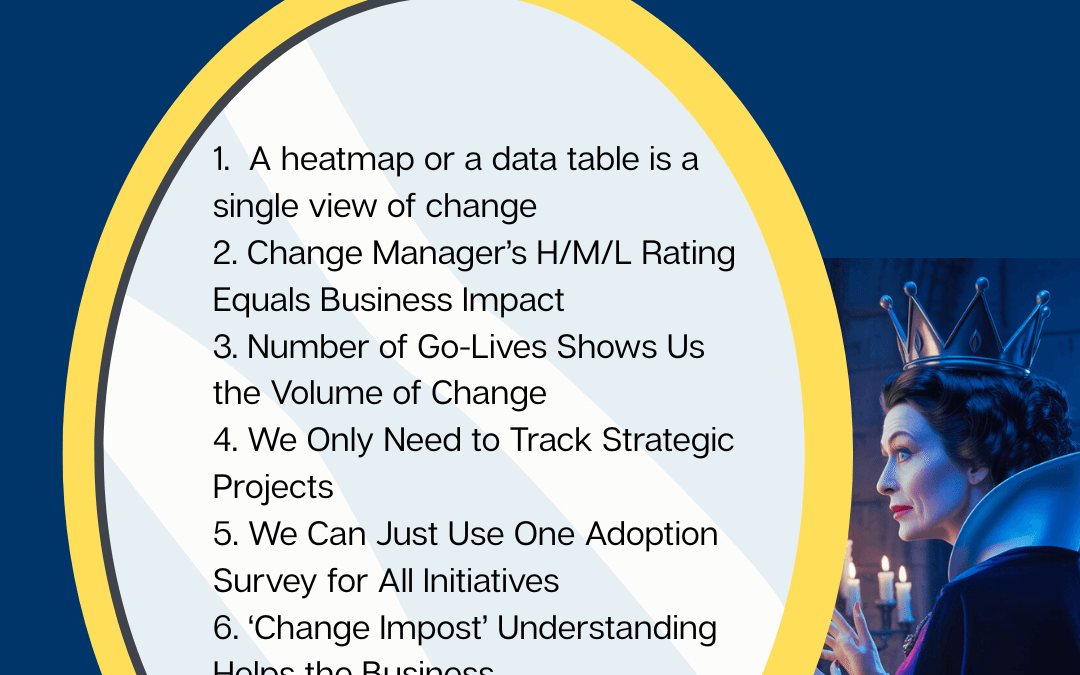
Here we explore seven widespread assumptions that can lead change leaders astray. By challenging these myths, you can adopt more nuanced, effective approaches that truly support your people and your business.
Assumption 1: A Heatmap or Data Table is a Single View of Change
Heatmaps and data tables have become go-to tools for visualising change across an organisation. At a glance, they promise to show us where the “hotspots” are—those areas experiencing the most change. But is this single view really giving us the full picture?
Why This Assumption is Wrong
1. Not All Change is Disruptive—Some is Positive A heatmap typically highlights areas with high volumes of change, but it doesn’t distinguish between positive and negative impacts. For example, a new digital tool might be seen as a “hotspot” simply because it affects many employees, but if it makes their jobs easier and boosts productivity, the overall experience could be positive. Conversely, a smaller change that disrupts workflows or adds complexity may have a much larger negative impact on a specific group, even if it doesn’t light up the heatmap. Depth of understanding beyond the heatmap is key.
2. The Data May Not Show the Real ‘Heat’ The accuracy of a heatmap depends entirely on the data feeding it. If your ratings are based on high-level, generic ‘traffic-light’ impact assessments, you may miss the nuances of how change is actually experienced by employees. For instance, a heatmap might show a “red zone” in one department based on the number of initiatives, but if those initiatives are well-aligned and support the team’s goals, the actual disruption could be minimal.
3. The Illusion of Completeness A single view of change suggests that you’ve captured every initiative—strategic, operational, and BAU (Business As Usual)—in one neat package. In reality, most organisations struggle to maintain a comprehensive and up-to-date inventory of all changes. BAU initiatives, in particular, often slip under the radar, even though their cumulative impact can be significant. This is not to say that one always needs to aim for 100%. However, labelling this as ‘single view of change’ would then be an exaggeration.
The Takeaway
Heatmaps and data tables are useful starting points, but they’re not the whole story. They provide a high-level snapshot, not a diagnostic tool. Heatmaps should also not be the only visual you use. There are countless other ways to present similar data. To truly understand the impact of multiple changes, you need to go deeper—gathering qualitative insights, focusing on employee experience, and recognising that not all “hotspots” are created equal. Ultimately the data should tell you ‘why’ and ‘how’ to fix it.
Assumption 2: A Change Manager’s H/M/L Rating Equals Business Impact
It’s common practice to summarise the impact of change initiatives using simple High/Medium/Low (H/M/L) ratings. These ratings are easy to communicate and look great in dashboards. But do they really reflect the business impact?
Why This Assumption is Wrong
1. Oversimplification Masks Nuance H/M/L ratings often blend a variety of factors: the effort required from business leads, subject matter experts (SMEs), sponsors, project teams, and change champions. These ratings may not be based solely—or even primarily—on employee or customer impact. For example, a “High” impact rating might reflect the complexity of project delivery rather than the degree of disruption felt by frontline staff.
2. Limited Decision-Making Value A single, combined rating has limited utility for decision-making. If you need to focus specifically on employee impacts, customer experience, or partner relationships, a broad H/M/L assessment won’t help you target your interventions. It becomes a blunt instrument, unable to guide nuanced action.
3. Lack of Granularity for Business Units For business units, three categories (High, Medium, Low) are often too broad to provide meaningful insights. Important differences between types of change, levels of disruption, and readiness for adoption can be lost, resulting in a lack of actionable information.
The Takeaway
Don’t rely solely on H/M/L ratings to understand business impact. Instead, tailor your assessments to the audience and the decision at hand. Use more granular, context-specific measures that reflect the true nature of the change and its impact on different stakeholder groups, where it makes sense.
Assumption 3: Number of Go-Lives Shows Us the Volume of Change
It’s easy to fall into the trap of using Go-Live dates as a proxy for change volume. After all, Go-Live is a clear, measurable milestone, and counting them up seems like a straightforward way to gauge how much change is happening. But this approach is fundamentally flawed.
Why This Assumption is Wrong
1. Not All Go-Lives Are Created Equal Some Go-Lives are highly technical, involving backend system upgrades or infrastructure changes that have little to no visible impact on most employees. Others, even if small in scope, might significantly alter how people work day-to-day. Simply tallying Go-Lives ignores the nature, scale, and felt impact of each change.
2. The Employee Experience Is Not Tied to Go-Live Timing The work required to prepare for and adopt a change often happens well before or after the official Go-Live date. In some projects, readiness activities—training, communications, process redesign—may occur months or even a year ahead of Go-Live. Conversely, true adoption and behaviour change may lag long after the system or process is live. Focusing solely on Go-Live dates misses these critical phases of the change journey.
3. Volume Does Not Equal Impact A month with multiple Go-Lives might be relatively easy for employees if the changes are minor or well-supported. In contrast, a single, complex Go-Live could create a massive disruption. The volume of Go-Lives is a poor indicator of the real workload and adaptation required from your people.
The Takeaway
Don’t equate the number of Go-Lives with the volume or impact of change. Instead, map the full journey of each initiative—readiness, Go-Live, and post-implementation adoption. Focus on the employee experience throughout the lifecycle, not just at the technical milestone.
Assumption 4: We Only Need to Track Strategic Projects
Strategic projects are naturally top of mind for senior leaders and transformation teams. They’re high-profile, resource-intensive, and often linked to key business objectives. But is tracking only these initiatives enough?
Why This Assumption is Wrong
1. Strategic Does Not Always Mean Disruptive While strategic projects are important, they don’t always have the biggest impact on employees’ day-to-day work. Sometimes, operational or BAU (Business As Usual) initiatives—such as process tweaks, compliance updates, or system enhancements—can create more disruption for specific teams.
2. Blind Spots in Change Impact Focusing exclusively on strategic projects creates blind spots. Employees may be grappling with a host of smaller, less visible changes that collectively have a significant impact on morale, productivity, and engagement. If these changes aren’t tracked, leaders may be caught off guard by resistance or fatigue.
3. Data Collection Bias Strategic projects are usually easier to track because they have formal governance, reporting structures, and visibility. BAU initiatives, on the other hand, are often managed locally and may not be captured in central change registers. Ignoring them can lead to an incomplete and misleading picture of overall change impact.
The Takeaway
To truly understand and manage the cumulative impact of change, track both strategic and BAU initiatives. This broader view helps you identify where support is needed most and prevents change overload in pockets of the organisation that might otherwise go unnoticed.
Assumption 5: We Can Just Use One Adoption Survey for All Initiatives
Surveys are a popular tool for measuring change adoption. The idea of using a single, standardised survey across all initiatives is appealing—it saves time, simplifies reporting, and allows for easy comparison. But this approach rarely delivers meaningful insights.
Why This Assumption is Wrong
1. Every Initiative Is Unique Each change initiative has its own objectives, adoption targets, and success metrics. A generic survey cannot capture the specific behaviours, attitudes, or outcomes that matter for each project. If you try to make one survey fit all, you end up with questions so broad that the data becomes meaningless and unhelpful.
2. Timing Matters The right moment to measure adoption varies by initiative. Some changes require immediate feedback post-Go-Live, while others need follow-up months later to assess true behavioural change. Relying on a single survey at a fixed time can miss critical insights about the adoption curve.
3. Depth and Relevance Are Lost A one-size-fits-all survey lacks the depth needed to diagnose issues, reinforce learning, or support targeted interventions. It may also fail to engage employees, who can quickly spot when questions are irrelevant to their experience.
The Takeaway
Customise your adoption measurement for each initiative. Tailor questions to the specific outcomes you want to achieve, and time your surveys to capture meaningful feedback. Consider multiple touchpoints to track adoption over time and reinforce desired behaviours.
Assumption 6: ‘Change Impost’ Understanding Helps the Business
The term “change impost” has crept into the vocabulary of many organisations, often used to describe the perceived burden that change initiatives place on the business. On the surface, it might seem helpful to quantify this “impost” so that leaders can manage or minimise it. However, this framing is fraught with problems.
Why This Assumption is Wrong
1. Negative Framing Fuels Resistance Describing change as an “impost” positions it as something external, unwelcome, and separate from “real” business work. This language reinforces the idea that change is a distraction or a burden, rather than a necessary part of growth and improvement. Stakeholders who hear change discussed in these terms may lead to the reinforcement of negativity towards change versus incorporating change as part of normal business work.
2. It Artificially Separates ‘Change’ from ‘Business’ In reality, change is not an add-on—it is intrinsic to business evolution. By treating change as something apart from normal operations, organisations create a false dichotomy that hinders integration and adoption. This separation can also lead to confusion about responsibilities and priorities, making it harder for teams to see the value in new ways of working.
3. There Are Better Alternatives Instead of “change impost,” consider using terms like “implementation activities,” “engagement activities,” or “business transformation efforts.” These phrases acknowledge the work involved in change but frame it positively, as part of the ongoing journey of business improvement.
The Takeaway
Language matters. Choose terminology that normalises change as part of everyday business, not as an external burden. This shift in mindset can help foster a culture where change is embraced, not endured.
Assumption 7: We Just Need to Avoid High Change Volumes to Manage Capacity
It’s a common belief that the best way to manage organisational capacity is to avoid periods of high change volume—flattening the curve, so to speak. While this sounds logical, the reality is more nuanced.
Why This Assumption is Wrong
1. Sometimes High Volume Is Strategic Depending on your organisation’s transformation goals, there may be times when a surge in change activity is necessary. For example, reaching a critical mass of changes within a short period can create momentum, signal a new direction, or help the organisation pivot quickly. In these cases, temporarily increasing the volume of change is not only acceptable—it’s desirable to reach significant momentum and outcomes.
2. Not All Change Is Equal The type of change matters as much as the quantity. Some changes are minor and easily absorbed, while others are complex and disruptive. Simply counting the number of initiatives or activities does not account for their true impact on capacity.
3. Planned Peaks and ‘Breathers’ Are Essential Rather than striving for a perfectly flat change curve, it’s often more effective to plan for peaks and valleys. After a period of intense change, deliberately building in “breathers” allows the organisation to recover, consolidate gains, and prepare for the next wave. This approach helps maintain organisational energy and reduces the risk of burnout.
The Takeaway
Managing capacity is about more than just avoiding high volumes of change. It requires a strategic approach to pacing, sequencing, and supporting people through both busy and quieter periods.
Practical Recommendations for Change Leaders
Having debunked these common assumptions, what should change management and transformation leaders do instead? Here are some actionable strategies:
1. Use Multiple Lenses to Assess Change
Combine quantitative tools (like heatmaps and data tables) with qualitative insights from employee feedback, focus groups, and direct observation.
Distinguish between positive and negative impacts, and tailor your analysis to specific stakeholder groups.
2. Get Granular with Impact Assessments
Move beyond generic H/M/L ratings. Develop more nuanced scales or categories that reflect the true nature and distribution of impacts.
Segment your analysis by business unit, role, or customer group to uncover hidden hotspots.
3. Map the Full Change Journey
Track readiness activities, Go-Live events, and post-implementation adoption separately.
Recognise that the most significant work—both for employees and leaders—often happens outside the Go-Live window.
4. Track All Relevant Initiatives
Include both strategic and BAU changes in your change portfolio.
Regularly update your inventory to reflect new, ongoing, and completed initiatives.
5. Customise Adoption Measurement
Design adoption surveys and feedback mechanisms for each initiative, aligned to its specific objectives and timing.
Use multiple touchpoints to monitor progress and reinforce desired behaviours.
6. Use Positive, Inclusive Business Language
Frame change as part of business evolution and operations, not an “impost.”
Encourage leaders and teams to see change work as integral to ongoing success.
7. Plan for Peaks and Recovery
Strategically sequence changes to align with business priorities and capacity.
Build in recovery periods after major waves of change to maintain energy and engagement.
Managing multiple changes in a complex organisation is never easy—but it’s made harder by clinging to outdated assumptions. By challenging these myths and adopting a more nuanced, evidence-based approach, change management and transformation leaders can better support their people, deliver real value, and drive sustainable success.
Remember: Effective change management is not about ticking boxes or flattening curves. It’s about understanding the lived experience of change, making informed decisions, and leading with empathy and clarity in a world that never stands still.
At The Change Compass, we’ve incorporated various best practices into our tool to capture change data across the organisation. Chat to us to find out more.
Section 1: What Change Maturity Looks Like – And How Data Made It Real
Shifting from Capability Sessions to Data-Driven Change
For years, the default approach to improving organisational change maturity has been through capability sessions: workshops, training programs, and methodology deep dives. These sessions often focus on the mechanics of change management-how to assess impacts, create stakeholder maps, or run engagement activities. While valuable, they rarely move the needle on actual change maturity, because they don’t address the systemic challenge: embedding change into the rhythm of business.
This is not to say that capability sessions are inherently not valuable nor make an impact. The point is if this is the core approach to lift change maturity, you may want to re-think this approach.
In contrast, the financial services organisation we’re profiling achieved a step-change in maturity not by running more workshops, but by making change a measurable, managed discipline-driven by data. This is the essence of “what gets measured gets managed.” When change is tracked, analysed, and reported with the same rigour as financial or operational metrics, it becomes a core business focus and therefore evolving into a capability, not a project add-on.
The Hallmarks of Data-Driven Change Maturity
So, what does this maturity look like in practice?
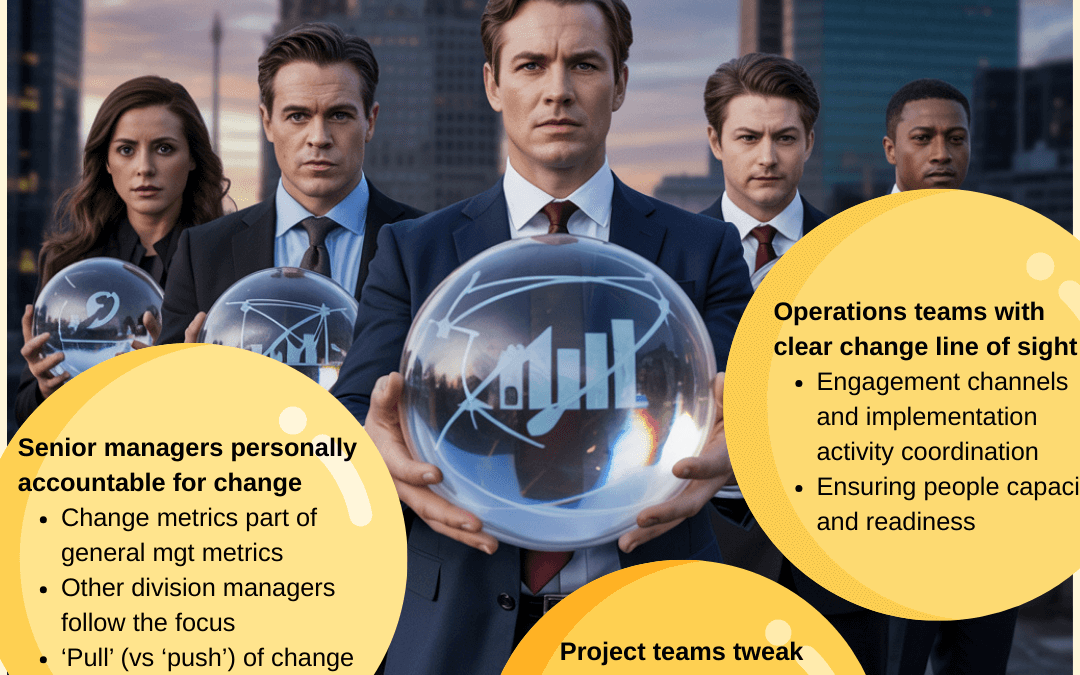
Senior Leaders Are Personally Accountable Change metrics are embedded in the general management scorecard. Senior managers are not just sponsors; they are accountable for change outcomes, not just at a project level but within their business function. Their performance includes the outcome and the impact of change on business results. This accountability cascades throughout the organisation, with other managers following suit, creating a culture where change performance is a core management concern.
Demand for Change Expertise Is Pulled, Not Pushed Instead of the central change team “pushing” support onto the business, managers proactively seek out change expertise. They do this because the data shows them where key risks and concerns are, making change support a value-added service rather than a compliance exercise.
Operations Teams Have Line of Sight Operations teams can see all upcoming changes affecting their areas, thanks to integrated change visuals and dashboards. This transparency allows for coordinated engagement and implementation, ensuring that people capacity and readiness are managed proactively, not reactively.
Project Teams Adapt Based on People Data Project teams don’t just track milestones and budgets; they monitor leading indicators like readiness, sentiment, and adoption. Governance forums provide visibility and decision-making authority on key people risks across all change initiatives, enabling real-time adjustments to project approaches.
The Data Infrastructure That Enabled This Shift
To achieve this level of maturity, the organisation should utilise a centralised change data platform, integrating inputs from project management and operational dashboards. Data governance was established at the management level, with clear ownership and enterprise definitions. Automation and AI were used to collect, cleanse, and analyse data at scale, removing manual bottlenecks and enabling real-time insights.
Contrasting Traditional and Data-Driven Approaches
Aspect
Traditional Approach
Data-Driven Change Maturity
Senior Manager Involvement
Sponsorship, not accountability
Direct accountability, metrics-driven
Change Capability Uplift
Capability sessions, workshops
Focus on metrics improvement drove ongoing holistic capability improvement
Change Data Usage
Limited, ad hoc surveys or hearsay opinions
Integrated, real-time, enterprise-wide
Operations Visibility
Siloed, reactive
Proactive, coordinated, data-informed
Project Team Adaptation
Based on lagging indicators
Based on leading, predictive analytics
Value Realisation
Incremental, project-based
Enterprise-wide, transformative with alignment across different management levels
The Real Work Behind the Results
Some might argue that this level of data infrastructure and governance is too complex or resource-intensive. However, with modern automation and AI, much of the data collection, cleansing, and analysis can be streamlined. The initial investment is quickly offset by the value unlocked-both in risk mitigation and in the ability to deliver change at scale, with greater precision and impact.
This is what change maturity looks like when it’s powered by data. It’s not about more workshops; it’s about making change visible, accountable, and actionable at every level of the organisation. The next section will explore how this approach transforms decision-making-from focusing on cost and timelines to prioritising people and value.
Section 2: From Cost and Timelines to People and Value – How Data Transforms Change Implementation
The Persistent Focus on Cost and Timelines
For decades, change and transformation decisions in large organisations have been anchored in two primary considerations: cost and project timelines. Budgets are scrutinised, schedules are tracked, and success is often measured by whether a project was delivered on time and within budget. While these are important, they are insufficient for delivering sustainable, people-centric change. By focusing narrowly on these factors, organisations risk overlooking the most critical element: the people who must adopt and sustain the change.
Injecting the People Element-Through Data
A growing number of organisations are recognising that change cannot be managed by these numbers alone. The financial services organisation in this case study made a deliberate shift: they began injecting people data into every change decision. This meant that, alongside cost and timeline metrics, leaders and project teams had access to real-time insights on people impacts and capacity/readiness risks.
These people metrics were not afterthoughts-they were integrated into the same dashboards and governance forums as financial and operational data. This integration enabled a more holistic view of change, allowing leaders to make informed decisions that balanced the needs of the business with the realities of its workforce.
How People Data Drives Better Decisions
Proactive Risk Management By monitoring leading indicators such as readiness and sentiment, project teams could identify potential risks before they became issues. For example, a drop in readiness scores could trigger targeted engagement activities, preventing delays and increasing the likelihood of successful adoption.
Dynamic Resource Allocation Data on people capacity allowed operations teams to anticipate and manage the impact of multiple concurrent changes. This meant that resources could be allocated more effectively, reducing the risk of change fatigue and ensuring that teams were not overwhelmed.
Evidence-Based Adjustments Project approaches were no longer set in stone. Teams could tweak their strategies based on real-time feedback, ensuring that change initiatives remained aligned with the needs and capabilities of the workforce. Often this is done in advance of any governance decision making as teams could already see potential risks and opportunities through data.
Governance That Delivers Value Governance forums used people data to prioritise initiatives, allocate resources, and escalate risks. This meant that decisions were made with a clear understanding of both the financial and human implications of change.
The Role of AI and Automation
The integration of people data into change management was made possible by advances in AI and automation. These technologies enabled the organisation to collect, analyse, and visualise data at scale, removing the manual burden and providing actionable insights in real time. The value of AI and automation was not just in saving a few hours on impact assessments-it was in providing the analytical horsepower to identify patterns, predict risks, and optimise change delivery across the enterprise.
Moving Beyond Incremental Value
By embedding people data into the heart of change decision-making, the organisation was able to move beyond incremental improvements. Instead of talking about saving a few thousand dollars on a single project, they unlocked tens of millions in enterprise value by delivering change that was adopted, sustained, and embedded across the business.
The New Decision-Making Framework
Decision Factor
Traditional Approach
Data-Driven Approach
Cost
Primary focus
Balanced with people and value
Timelines
Primary focus
Balanced with people and value
People Readiness
Secondary, ad hoc
Primary, real-time, data-driven
Sentiment/Adoption
Rarely measured
Continuously monitored
Resource Allocation
Based on project needs
Based on overall people capacity and readiness, so balancing not just project resources but impacted business resources
Governance
Focused on milestones
Focused on both financial and people goals
The Result: Change That Delivers Value
The shift to data-driven, people-centric change management transformed the organisation’s ability to deliver value. Change was no longer a series of isolated projects, but a core business capability-managed, measured, and continuously improved. The next section will explore how this approach can be scaled and sustained, and what it means for the future of change and transformation in large organisations.
Section 3: Scaling and Sustaining Change Maturity – The Future of Transformation
The Myth of Overwhelm: Practical Steps to Sustainable Change Maturity
For many organisations, the prospect of building and maintaining a data-driven change maturity model can seem daunting. The common perception is that it requires an overwhelming investment in new tools, processes, and training-one that may not be justified by the returns. However, the experience of this financial services company demonstrates that, while focused effort is required, the process does not have to be overwhelming-especially with the right use of experimentation, ongoing tweaks, automation and AI.
Automation: The Great Enabler Much of the heavy lifting in data collection, cleansing, and reporting can now be automated. Change impact assessments, sentiment tracking, and readiness surveys can be scheduled, administered, and analysed with minimal manual intervention. This frees up change professionals to focus on interpretation, action, and continuous improvement rather than data wrangling.
AI: Unlocking Predictive Power AI tools can analyse patterns across multiple change initiatives, predict adoption risks, and recommend interventions before issues arise. This predictive capability allows organisations to be proactive rather than reactive, reducing the risk of failed change and increasing the speed of value realisation.
Scalable Governance By embedding change metrics into existing governance structures-such as business reviews, risk committees, and leadership forums-the organisation ensures that change maturity is not a one-off project but an ongoing discipline. This integration makes it easier to scale across divisions, regions, and business units.
Continuous Experimentation and Adaptation
A critical aspect of scaling and sustaining change maturity is the willingness to experiment, learn, and iterate. Early adoption of data-driven change management should be approached with a mindset of ongoing refinement. For example, executive alignment is often achieved not in a single meeting, but through a series of tailored discussions where dashboards and metrics are gradually refined to match leadership priorities and language. Testing different dashboard designs-such as visualisations, drill-down capabilities, or alert mechanisms-allows teams to identify what best supports decision-making at each level of the organisation.
Similarly, designing change decision-making forums as iterative, rather than static, processes ensures that the right data is surfaced at the right time, and that governance structures evolve as the organisation’s change maturity grows. By embracing a culture of experimentation and continuous improvement, organisations can ensure their change management practices remain relevant, effective, and aligned with both business and people objectives.
From Thousands to Millions: The Real Value of Data-Driven Change
The ultimate value of this approach is not measured in hours saved or individual project successes. It is measured in the ability to deliver change at scale, with precision, and with confidence that people will adopt and sustain the new ways of working. This is what ultimately drives benefit realisation. In this financial services organisation, the shift from ad hoc, project-based change to an enterprise-wide, data-driven discipline unlocked tens of millions in value-far beyond the incremental savings of traditional approaches.
Risk Mitigation By identifying and addressing people risks early, the organisation avoided costly delays, rework, and failed implementations.
Faster Value Realisation Real-time data enabled faster, more informed decision-making, accelerating the time to value for major initiatives.
Sustainable Adoption Continuous monitoring and adjustment ensured that changes were not just implemented, but embedded and sustained over time.
Are You Ready to 10-100X the Value of Change?
For experienced change and transformation practitioners, the question is no longer whether data-driven change maturity is possible-it is whether you are ready to embrace it. The tools, technologies, and methodologies are available. The competitive advantage lies in how you use them-making change visible, accountable, and actionable at every level of the organisation.
Lift the Game Move beyond incremental improvements and unlock the full potential of change as a lever for enterprise performance.
Lead the Shift Champion the integration of people data into every change decision, and demonstrate the value of a disciplined, data-driven approach.
Scale and Sustain Use automation and AI to make change maturity a scalable, sustainable capability-not just a project or initiative.
The Future Is Now
The future of change and transformation is here. It is data-driven, people-centric, and value-focused. It is about making change a core business discipline-managed, measured, and continuously improved. Are you ready to take the leap and 10-100X the value that change delivers in your organisation?
Air traffic control is one of the most sophisticated and high-stakes management systems in the world. Ensuring the safety of thousands of flights daily requires rigorous coordination, precise timing, and a structured yet adaptable approach. When failures occur, they often result in catastrophic consequences, as seen in the tragic January 2025 midair collision between an army helicopter and a passenger jet in Washington, D.C. airspace.
Think about the last time you took a flight. You probably didn’t worry about how the pilot knew where to go, how to land safely, or how to avoid other planes in the sky. That’s because air traffic control is a well-oiled machine, built on a foundation of real-time data, clear protocols, and experienced professionals making split-second decisions. Now, imagine if air traffic controllers had to work with outdated information, or if pilots had to rely on intuition rather than hard facts. Chaos, right?
The same principles that apply to managing air traffic also hold valuable lessons for change and transformation management within organisations. Large-scale transformations involve multiple initiatives running in parallel, conflicting priorities, and significant risks. Without a structured, centralised approach, organisations risk failure, reduced value realisation, and employee fatigue.
The same logic applies to organisational change and transformation. Leaders are often trying to land multiple initiatives at once, each with its own trajectory, speed, and impact. Without real-time, accurate data, it’s all too easy for change initiatives to collide, stall, or overwhelm employees. Just as the aviation industry depends on continuous data updates to prevent disasters, businesses must embrace data-driven decision-making to ensure their transformation efforts succeed.
Here we’ll explore what air traffic control can teach us about using data effectively in change management. If you’ve ever felt like your organisation’s transformation efforts are flying blind, chaotic and uncoordinated, this one’s for you.
Lesson 1: The Danger of Overloading Critical Roles
The D.C. Midair Collision: A Case of Role Overload
In January 2025, a tragic midair collision occurred in Washington, D.C. airspace between an army helicopter and a passenger jet, claiming 67 lives. Investigations revealed multiple contributing factors, including inadequate pilot training, fatigue, insufficient maintenance, and ignored safety protocols. This incident underscored the dangers of overstretched resources, outdated processes, and poor data visibility—lessons that extend beyond aviation and into how organisations manage complex, high-stakes operations like change and transformation.
Additionally, the air traffic controller on duty was handling both helicopter and airplane traffic simultaneously, leading to a critical lapse in coordination. This split focus contributed to poor coordination and a lack of real-time situational awareness, ultimately leading to disaster. This is aligned with findings from various research that providing adequate resources is important in driving change and transformation.
Parallels in Change and Transformation Management
Organisations often suffer from similar overload issues when managing change. Many initiatives—ranging from business-as-usual (BAU) efforts to large-scale transformations—compete for attention, resources, and stakeholder engagement. Without a structured approach, teams end up working in silos, unaware of competing priorities or overlapping impacts.
There are some who argue that change is the new norm, so employees just need to get on the program and learn to adapt. It may be easy to say this, but successful organisations have learnt how to do this, versus ignoring the issue. After all, managing capacity and resources is a normal part of any effective operations management and strategy execution. Within a change context, the effects are just more pronounced given the timelines and the need to balance both business-as-usual and changes.
Key Takeaways:
Centralised Oversight: Organisations need a structured governance model—whether through a Transformation Office, PMO, or Change Centre of Excellence—to track all initiatives and prevent “collisions.”
Clear Role Definition: Initiative owners and sponsors should have a clear understanding of their responsibilities, engagement processes, and decision-making frameworks.
Avoiding Initiative Overload: Employees experience “change fatigue” when multiple transformations run concurrently without proper coordination. Leaders must balance initiative rollout to ensure sustainable adoption.
Lesson 2: Providing Initiative Owners with Data-Driven Decision Autonomy
The UPS ‘Continuous Descent Arrivals’ System
UPS has been testing a data-driven approach to landings called ‘Continuous Descent Arrivals’ (source: Wall Street Journal article: Managing Air Traffic Control). Instead of relying solely on air traffic controllers to direct landing schedules, pilots have access to a full dashboard of real-time data, allowing them to determine their optimal landing times while still following a structured governance protocol. While CDA is effective during light traffic conditions, implementing it during heavy traffic poses technical challenges. Air traffic controllers must ensure safe separation between aircraft while optimising descent paths.
Applying This to Agile Change Management
In agile organisations, multiple initiatives are constantly iterating, requiring a balance between flexibility and coordination. Rather than centralised bottleneck approvals, initiative owners should be empowered to make informed, autonomous decisions—provided they follow structured governance (and when there is less risk of multiple releases and impacts on the business).
Key Takeaways:
Real-Time Data Sharing: Just as pilots rely on up-to-date flight data, organisations must have a transparent system where initiative owners can see enterprise-wide transformation impacts and adjust accordingly.
Governance Without Bureaucracy: Pre-set governance protocols should allow for self-service decision-making without stifling agility.
Last-Minute Adjustments with Predictability: Agile initiatives should have the flexibility to adjust their release schedules as long as they adhere to predefined impact management processes.
Lesson 3: Resourcing Air Traffic Control for Organisational Change
Lack of Air Traffic Controllers: A Root Cause of the D.C. Accident
The D.C. accident highlighted that understaffing was a critical factor. Insufficient air traffic controllers led to delayed decision-making and unsafe airspace conditions.
The Importance of Resource Allocation in Change and Transformation
Many organisations lack a dedicated team overseeing enterprise-wide change. Instead, initiatives operate independently, often leading to inefficiencies, redundancies, and conflicts. According to McKinsey, companies that effectively prioritise and allocate resources to transformation initiatives can generate 40% more value compared to their peers.
Key Takeaways:
Dedicated Transformation Governance Teams: Whether in the form of a PMO, Transformation Office, or Change Centre of Excellence, a central function should be responsible for initiative alignment.
Prioritisation Frameworks: Not all initiatives should receive equal attention. Organisations must establish structured prioritisation mechanisms based on value, risk, and strategic alignment.
Investment in Change Capacity: Just as air traffic controllers are indispensable to aviation safety, organisations must invest in skilled change professionals to ensure seamless initiative execution.
Lesson 4: Proactive Risk Management to Prevent Initiative Collisions
The Risk of Unchecked Initiative Timelines
Just as midair collisions can occur due to inadequate tracking of aircraft positions, organisational change initiatives can “crash” when timelines and impacts are not actively managed. Without a real-time view of concurrent changes, organisations risk:
Conflicting Business Priorities: Competing transformations may pull resources in different directions, leading to delays and reduced impact.
Change Saturation: Employees struggle to absorb too many changes at once, leading to disengagement and lower adoption.
Operational Disruptions: Poorly sequenced initiatives can create unintended consequences, disrupting critical business functions.
Establishing a Proactive “Air Traffic Control” for Change
Enterprise Change Heatmaps: Organisations should maintain a real-time dashboard of ongoing and upcoming changes to anticipate and mitigate risks.
Stakeholder Impact Assessments: Before launching initiatives, leaders must assess cumulative impacts on employees and customers.
Strategic Sequencing: Similar to how air traffic controllers ensure safe landing schedules, organisations must deliberately pace their change initiatives.
The Role of Data in Change and Transformation: Lessons from Air Traffic Control
You Need a Single Source of Truth—No More Guesswork
Aviation Example: The Power of Integrated Data Systems
In aviation, pilots and controllers don’t work off scattered spreadsheets or conflicting reports. They use a unified system that integrates radar, satellite tracking, and aircraft GPS, providing a single, comprehensive view of air traffic. With this system, pilots and controllers can see exactly where each aircraft is and make informed decisions to keep everyone safe.
Application in Change Management: Why Fragmented Data is a Recipe for Disaster
Now, compare this to how many organisations manage change. Different business units track initiatives in separate spreadsheets, using inconsistent reporting standards. Transformation offices, HR, finance, and IT often operate in silos, each with their own version of the truth. When leaders don’t have a clear, real-time picture of what’s happening across the organisation, it’s like trying to land a plane in thick fog—without instruments.
Key Takeaways:
Create a Centralised Change Management Platform: Just like air traffic control relies on a single system, organisations need a centralised platform where all change initiatives are tracked in real time.
Standardise Data Collection and Reporting: Everyone involved in change initiatives should follow the same data standards to ensure consistency and accuracy.
Increase Visibility Across Business Units: Leaders need an enterprise-wide view of all change efforts to avoid conflicts and align priorities.
Real-Time Data Enables Agile, Confident Decision-Making
UPS has a fascinating system for managing landings, known as ‘Continuous Descent Arrivals.’ Instead of waiting for air traffic controllers to dictate their landing time, pilots receive real-time data about their approach, runway conditions, and surrounding traffic. This allows them to determine the best landing time themselves—within a structured framework. The result? More efficient landings, less fuel waste, and greater overall safety.
Application in Change Management: The Danger of Outdated Reports
Too often, business leaders make transformation decisions based on data that’s weeks—or even months—old. By the time they realise a problem, the initiative has already veered off course. When leaders lack real-time data, they either act too late or overcorrect, causing further disruptions.
Key Takeaways:
Use Live Dashboards for Initiative Management: Just as pilots rely on real-time flight data, change leaders should have constantly updated dashboards showing initiative progress, risks, and dependencies.
Empower Initiative Owners with Data-Driven Autonomy: When given up-to-date information, initiative owners can make faster, smarter adjustments—without waiting for top-down approvals.
Leverage Predictive Analytics to Anticipate Challenges: AI-driven insights can flag potential risks, such as change saturation or conflicting priorities, before they become full-blown issues.
Modern aircraft are equipped with automatic dependent surveillance-broadcast (ADS-B) systems, which allow them to communicate real-time flight data with each other. If two planes are on a collision course, these systems warn pilots, giving them time to adjust. It’s a proactive approach to risk management—problems are detected and resolved before they escalate.
Application in Change Management: Avoiding Crashes Between Initiatives
In organisations, multiple change initiatives often roll out simultaneously, each demanding employee attention, resources, and operational bandwidth. Without real-time risk monitoring, it’s easy to overwhelm employees or create operational bottlenecks. Many organisations don’t realise there’s an issue until productivity starts dropping or employees push back against the sheer volume of change.
Key Takeaways:
Invest in Impact Assessment Tools: Before launching an initiative, leaders should evaluate its potential impact on employees and the business.
Run Scenario Planning Exercises: Like pilots in flight simulators, organisations should model different change scenarios to prepare for potential challenges.
Set Up Early Warning Systems: AI-driven analytics can detect overlapping initiatives, allowing leaders to intervene before issues arise.
The High Cost of Inaccurate or Delayed Data
Aviation Example: The D.C. Midair Collision
The tragic January 2025 midair collision in Washington, D.C. was, in part, the result of outdated and incomplete data. A single air traffic controller was responsible for both helicopter and airplane traffic, leading to a dangerous lapse in coordination. Miscommunication about airspace restrictions only made matters worse, resulting in an avoidable catastrophe.
Poor Data Leads to Costly Mistakes
The corporate equivalent of this is when transformation teams work with old or incomplete data. Decisions based on last quarter’s reports can lead to wasted resources, poorly sequenced initiatives, and employee burnout. The consequences might not be as immediately tragic as an aviation disaster, but the financial, momentum and cultural costs can be devastating.
Key Takeaways:
Prioritise Frequent Data Updates: Change leaders must ensure initiative data is refreshed regularly to reflect real-time realities.
Collaborate Across Functions to Maintain Accuracy: Transformation leaders, HR, finance, and IT should work together to ensure all change impact data is reliable.
Automate Reporting Where Possible: AI and automation can reduce human error and provide real-time insights without manual effort.
Balancing Automation with Human Judgment
Aviation Example: Autopilot vs. Pilot Oversight
While modern planes rely heavily on autopilot, pilots are still in control. They use automation as a support system, but ultimately, human judgment is the final safeguard. It’s the perfect balance—automation enhances efficiency, while human oversight ensures safety.
Some leaders may find the process of collecting and analyzing data cumbersome, time-consuming, and even unnecessary—especially when they’re focused on quick execution. Gathering accurate, real-time data requires investment in tools, training, and disciplined processes, which can feel like an administrative burden rather than a value driver.
However, the benefits far outweigh the effort. A well-structured data system provides clarity on initiative progress, prevents conflicting priorities, enhances decision-making, and ensures resources are allocated effectively. Without it, organisations risk initiative overload, employee burnout, wasted budgets, and ultimately, failed transformations. Just like in aviation, where poor data can lead to fatal accidents, a lack of real-time insights in change management can result in costly missteps that derail business success.
Moreover, having an integrated process whereby data regularly feeds into decision making, as a normal business-as-usual process, builds the overall capability of the organisation to be a lot more agile and be able to change with confidence.
Navigating Change with Data-Driven Precision
Aviation has shown us what happens when decision-makers lack real-time, accurate data—mistakes happen, and consequences can be severe. In organisational change, the same principles apply. By embracing real-time data, predictive analytics, and structured governance, companies can navigate change more effectively, preventing initiative overload, reducing resistance, and maximising impact.
Ultimately, the goal is simple: Ensure your change initiatives don’t crash and burn. And just like in aviation, data is the key to a smooth landing.
If you would like to chat more about how to utilise a digital/AI solution that will equip you will insightful data to make critical business decisions in your air traffic control of your changes, reach out to us here.