Enterprise change management represents a fundamental evolution beyond traditional project-based change approaches. Rather than treating change as a series of isolated initiatives, enterprise change management (ECM) establishes systematic change capability across the entire organisation. According to Prosci’s research, ECM is defined as “the systematic deployment of change management skills, tools and processes throughout an organisation”. Beyond this limited interpretation, ECM is about embedding a system of change capabilities across the organisation to achieve business results.
This strategic approach transforms how organisations build, deploy, and sustain change capability. Unlike project-level change management that focuses on specific initiatives, ECM creates an organisational competency that enables rapid, effective response to changing business conditions whilst maintaining operational performance.
The core distinction lies in scope and integration. Traditional change management applies methodologies to individual projects or departments. Enterprise change management, however, embeds change capability into the organisational fabric itself, creating what researchers describe as “a strategic capability that enables the organisation to be agile, change ready and responsive to marketplace changes”.
The three levels of enterprise change capability
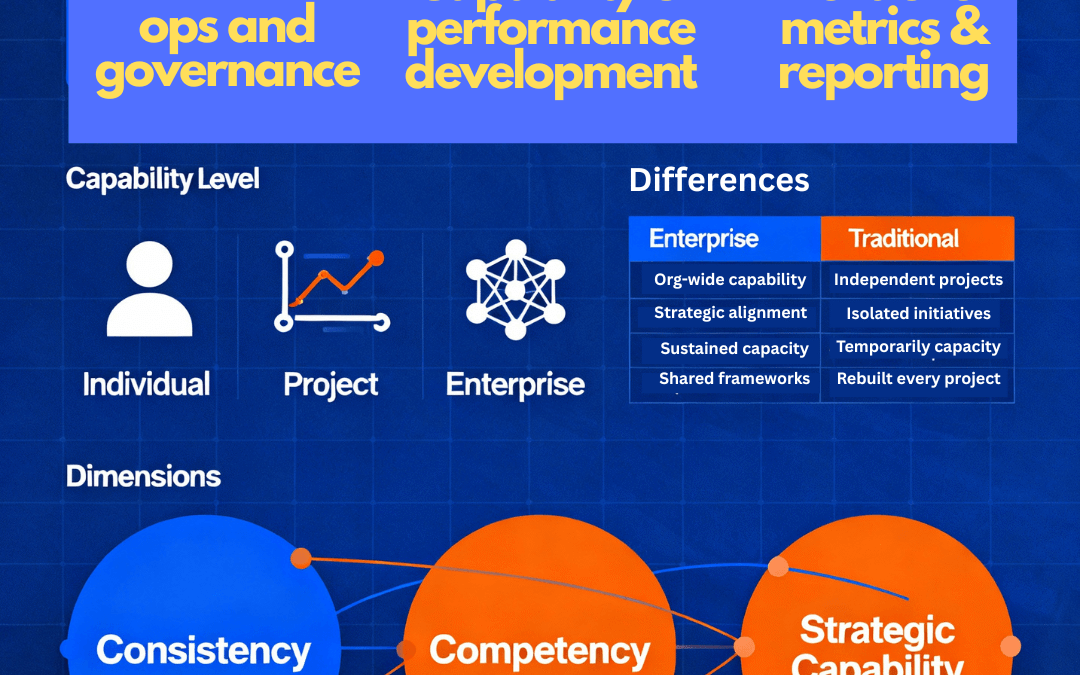
ECM operates across three integrated levels, each requiring different capabilities and governance structures. Research shows that organisations achieve sustainable transformation when they address all three levels systematically.
Individual level focuses on building personal change competency throughout the workforce. This means employees at all levels develop skills in navigating uncertainty, adapting to new processes, and contributing positively to transformation efforts. The goal is creating a change-ready workforce rather than relying on external change resources for each initiative.
Project level applies structured change management to specific initiatives whilst connecting them to broader organisational capabilities. Rather than treating each project as completely distinct, mature organisations leverage shared frameworks, common language, and integrated measurement systems that compound effectiveness across initiatives.
Enterprise level represents the systematic integration of change capability into organisational strategy, culture, and operations. At this level, change management becomes a core business competency that enables strategic agility and competitive advantage.
How enterprise change management differs from traditional approaches
The differences between traditional project-based change management and enterprise approaches are substantial and measurable. Traditional change management focuses on specific projects or departments, often operating in isolation with limited coordination across initiatives. The Project Management Office (PMO) may coordinate initiatives from a project resourcing or technical release perspective, but not from a people change perspective.
Scope of influence represents the most significant difference. Project-level change management targets only those directly impacted by a specific initiative, using output-based indicators like training completion rates or survey participation. Enterprise change management, however, builds organisational capability that scales across multiple initiatives simultaneously.
Strategic integration distinguishes mature ECM approaches from tactical project applications. Research from APMG International shows that ECM aligns all change initiatives with strategic goals, ensuring consistency and reducing confusion whilst increasing efficiency. This contrasts with project-specific approaches where different initiatives may define value differently, creating inconsistent outcomes.
Sustainability and learning transfer become possible only through enterprise approaches. Traditional project-based change management typically loses capability when projects end, requiring organisations to rebuild change capacity repeatedly. ECM creates persistent organisational learning that compounds across initiatives.
The research is clear about the performance implications. According to studies of enterprise versus traditional approaches, organisations implementing ECM report significantly higher success rates because “being a model that surrounds and sustains individual projects by ‘wrapping’ them into an organisation-wide view, ECM enables that aspect of change that is sometimes missing in other approaches: growth of the change capability itself”.
The three dimensions of enterprise change management
Effective ECM requires development across three interconnected dimensions, each contributing to overall organisational change capability.
Consistency involves applying common change management methods across all projects and initiatives. This creates organisational efficiency by eliminating the need to repeatedly train people on different methodologies, using the same language to avoid confusion and more effective from a capability development perspective. More importantly, consistency enables coordination across concurrent changes, reducing conflicts and competing demands on stakeholders.
Competency focuses on building and strengthening change management skills at every organisational level. This goes beyond training programs to encompass leadership competency from supervisors to senior executives. Research shows that sustainable ECM requires “a leadership competency at all levels of the organisation”, not just designated change professionals.
Strategic capability elevates change management to a key competency within business strategy itself. At this level, change management becomes integral to how the organisation plans, makes decisions, and executes strategic initiatives. This represents the most mature form of ECM, where change capability enables competitive advantage.
Why enterprise change management matters now
Today’s business environment demands more sophisticated approaches to managing change. Research indicates that organisations face unprecedented volumes of concurrent transformation initiatives, with 73% reporting being near, at, or beyond the point of change saturation. Traditional project-by-project approaches cannot effectively manage this complexity.
The velocity of change has also increased dramatically. Markets demand faster response to competitive threats and opportunities. Organisations with mature ECM capability can “respond more quickly to market dynamics because they don’t need to build change capacity from scratch for each new initiative”. They already have the frameworks, skills, and governance structures needed for rapid, effective transformation.
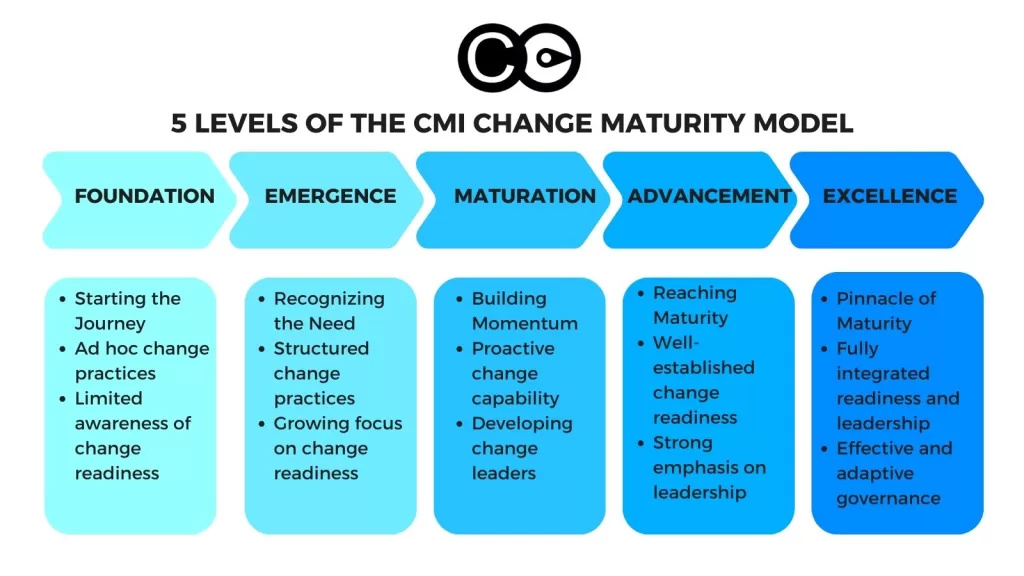
The financial implications are substantial. Organisations with effective ECM report higher success rates, faster implementation timelines, and sustained adoption of new capabilities. As the Change Management Institute’s research demonstrates, building enterprise-wide change maturity enables organisations to achieve “level 3 or 4 of change management maturity, characterised by consistent approaches, embedded processes, application-focused learning, coaching support, and leadership-led change”.
Enterprise change management frameworks and processes
The Change Management Institute’s integrated approach
The Change Management Institute (CMI) has developed one of the most comprehensive frameworks for building enterprise change capability through their integrated approach to organisational change maturity. The CMI framework recognises that sustainable enterprise change management requires systematic development across three core domains that work together synergistically.
Project Change Management represents the foundation level, focusing on building consistent change management capability at the individual project level. This domain ensures organisations can effectively manage the people side of change for specific initiatives whilst building transferable skills and methodologies that scale across the enterprise.
Business Change Readiness addresses the organisational capability to anticipate, prepare for, and respond to change demands. This domain focuses on developing the cultural readiness, resource allocation, and strategic alignment necessary for sustained transformation capability.
Strategic Change Leadership represents the most mature level, where change management becomes integrated into strategic planning, decision-making, and organisational culture. At this level, change capability enables competitive advantage and strategic agility.
The CMI framework differs significantly from project-specific approaches because it explicitly builds organisational capability that persists beyond individual initiatives. Research shows that organisations achieving maturity across all three domains can respond more quickly to market dynamics because they don’t need to rebuild change capacity for each new initiative.
The CMI Change Practice Framework: a structured process approach
The Change Management Institute’s Change Practice Framework provides a practical process model for implementing enterprise change management through four integrated dimensions: Define, Analyse, Co-design, and Refine. This circular, iterative process ensures continuous improvement and adaptation whilst maintaining focus on sustainable outcomes.
Define establishes the vision for change, benefits mapping, change approach and roadmap, desired outcomes, and target timeframes. At the enterprise level, this phase ensures alignment between individual changes and broader organisational strategy whilst considering change portfolio impacts and resource allocation.
Analyse encompasses change impacts assessment, success indicators development, stakeholder identification, change maturity evaluation, change capability assessment, change readiness analysis, and determining the degree and scale of change required. This comprehensive analysis enables organisations to understand not just what needs to change, but the organisational capacity and capability required for success.
Co-design and Engage focuses on developing communication and engagement strategies, co-designed solutions, organisational redesign approaches, new ways of working, implementation planning, and risk mitigation strategies. The co-design approach ensures stakeholder involvement and ownership whilst building internal capability for future changes.
Align and Refine includes leadership coaching, tracking success criteria, real-time problem solving, testing and refining approaches, and organisational realignment activities. This phase ensures sustainable adoption whilst capturing learning that enhances future change capability.
Competency-based framework implementation
The CMI Change Manager Competency Models provide the foundation for building individual and organisational capability across three progressive levels: Foundation, Specialist, and Master. These models identify specific behavioural competencies required for success at each level, creating clear development pathways for building enterprise change capability.
Foundation level competencies focus on understanding change principles, supporting change implementation, and developing basic skills in impact assessment, communication, and project management. Foundation practitioners provide essential support whilst building capabilities that prepare them for more complex roles.
Specialist level competencies encompass strategic thinking, coaching for change, advanced influencing skills, and the ability to assess and respond to complex organisational dynamics. Specialist practitioners can lead change initiatives whilst contributing to broader organisational change capability development.
Master level competencies include advanced strategic thinking, organisational diagnosis, change leadership across multiple initiatives, and the ability to develop change capability in others. Master practitioners drive enterprise-wide change capability whilst influencing organisational culture and strategic decision-making.
The competency models address eleven core skill areas that span technical change management capabilities and interpersonal effectiveness skills. Research shows that organisations using competency-based approaches to building change capability achieve higher success rates and sustained adoption because they develop comprehensive capability rather than focusing solely on tools and processes.
Maturity-based progression framework
Enterprise change management requires systematic progression through defined maturity levels. The CMI framework aligns with broader industry recognition that organisations must develop through predictable stages to achieve sustainable change capability.
Level 1 maturity represents ad-hoc or absent change management where organisations apply change approaches reactively and inconsistently. Most organisations begin at this level, with change management applied only when projects encounter resistance or difficulties.
Level 2 maturity involves isolated project applications where change management is recognised as valuable but applied inconsistently across initiatives. Organisations at this level may achieve project-specific success but don’t build enterprise capability.
Level 3 maturity represents the beginning of enterprise approaches, with defined processes and consistent application across projects. Organisations at this level have established change management methodologies and are building internal capability systematically.
Level 4 maturity involves organisational standards where change management is embedded in project governance and business processes. Organisations achieve consistent application whilst building change leadership capability across multiple levels.
Level 5 maturity represents organisational competency where change management becomes part of organisational culture and strategic capability. At this level, change management enables sustained competitive advantage and strategic agility.
Integrating frameworks for enterprise implementation
Successful enterprise change management requires integration across multiple framework elements rather than applying individual components in isolation. The most effective implementations combine the CMI maturity progression with competency development and structured process application.
Governance integration connects change portfolio management with strategic planning cycles, ensuring change investments align with business priorities whilst maintaining organisational change capacity. This requires governance structures that can coordinate across multiple concurrent initiatives whilst building sustainable capability.
Learning integration ensures insights from individual changes enhance organisational capability rather than remaining project-specific knowledge. Mature organisations establish learning systems that capture and transfer change capability across initiatives and business units.
Cultural integration embeds change management principles into organisational culture, making change capability a shared competency rather than specialist expertise. This requires leadership development, communication strategies, and recognition systems that reinforce change-positive behaviours and capabilities.
Research demonstrates that organisations implementing integrated approaches achieve significantly higher success rates than those focusing on individual framework components. The integration enables compound benefits where each change initiative strengthens organisational capability for subsequent transformations.
Implementing enterprise change management: measurement, networks, and business integration
Successful enterprise change management requires structured measurement approaches that go beyond traditional project metrics. Unlike project-level success indicators such as training completion rates or survey scores, enterprise measurement focuses on organisational capability development, portfolio-level performance, and strategic impact on business outcomes.
Leading indicators of enterprise change capability include change readiness assessments across business units, change leadership competency scores, and business operational performance linked to change impacts. These predictive measures enable organisations to identify capability gaps before they impact transformation outcomes. Research shows that organisations tracking leading indicators achieve significantly higher success rates because they can address capability deficits proactively rather than reactively.
Portfolio-level metrics provide visibility into the collective impact of change initiatives rather than individual project success. These include change portfolio health scores, resource utilisation across concurrent changes, and stakeholder engagement effectiveness across multiple initiatives. Advanced organisations track change saturation levels, ensuring they don’t exceed organisational capacity to absorb transformation.
Business performance integration represents the most strategic measurement approach, connecting change management effectiveness directly to operational and financial outcomes. This includes metrics such as productivity maintenance during transformation, revenue impact from improved adoption rates, and competitive advantage gained through superior change capability. Academic research demonstrates that organisations integrating change metrics with business performance measurement achieve compound benefits from their transformation investments.
The key insight is that enterprise measurement requires different analytical frameworks than project-level assessment. Enterprise metrics focus on building sustainable capability rather than achieving specific deliverables, creating compound value that increases over successive transformations.
Building enterprise change champion networks
Enterprise change management success depends heavily on distributed leadership through structured change champion networks. Unlike traditional approaches that rely on designated change professionals, enterprise approaches develop change capability throughout the organisational structure, creating what researchers describe as “embedded change capacity”.
Strategic network design requires careful consideration of organisational structure, culture, and change demands. The most effective networks combine formal authority relationships with informal influence patterns, ensuring change champions have both positional credibility and peer respect across different organisational layers. Research shows that well-designed champion networks increase adoption rates by 15-25 percentage points.
Bi-directional communication channels enable both top-down strategic alignment and bottom-up insight gathering. Champion networks serve as early warning systems for emerging resistance, resource constraints, and implementation challenges. They also provide channels for sharing success stories and best practices across business units, creating organisational learning that compounds across initiatives.
Competency development within networks ensures change champions have the skills needed for success whilst building organisational capability for future changes. This includes training in change principles, coaching techniques, communication strategies, and problem-solving approaches. The Change Management Institute’s research emphasises that sustainable champion networks require structured competency development rather than relying solely on enthusiasm and goodwill.
Successful champion networks become self-reinforcing systems that strengthen with use. Each change initiative provides opportunities for champions to develop skills, build relationships, and enhance credibility, creating increasing capability for subsequent transformations.
Integrating change management with business operations
The most mature enterprise change management approaches seamlessly integrate change capability with standard business operations rather than treating change as separate organisational function. This integration creates sustainable capability whilst reducing the administrative overhead associated with parallel change management processes.
Business planning integration ensures change capacity planning becomes part of standard strategic and operational planning cycles. This includes assessing change demands during annual planning, allocating change resources based on business priorities, and sequencing initiatives to optimise organisational capacity utilisation. Research demonstrates that organisations integrating change planning with business planning achieve 20-30% better resource efficiency compared to separate planning approaches.
Performance management integration embeds change-related objectives and competencies into standard performance evaluation and development processes. This includes change leadership expectations for managers, change collaboration requirements for individual contributors, and change capability development objectives across all roles. Integration ensures change capability development receives ongoing attention rather than episodic focus during transformation initiatives.
Governance structure integration connects change portfolio management with strategic decision-making processes, ensuring change investments align with business priorities whilst maintaining organisational capacity for transformation. This requires governance bodies with authority to sequence changes, allocate resources, and escalate systemic issues that individual projects cannot resolve.
Real-world success through data-driven enterprise change management
Leading organisations are achieving measurable business value through a structured data-driven approaches to enterprise change management. The Change Compass platform exemplifies this evolution, enabling organisations to embed change management within general business management rather than treating it as separate organisational function. Case Study 4.
A major global financial services corporation transformed their approach to change management by integrating change metrics with standard business reporting. Within one year, they achieved remarkable results: leadership began prioritising change management as part of strategic oversight, business leaders increasingly requested proactive change support, and the organisation developed consistent change management practices across previously disconnected business units. Case Study 4.
The transformation occurred through strategic data integration rather than additional bureaucracy. By partnering with their Business Intelligence team and utilising Change Compass data capabilities, the corporation embedded change management insights into routine business tracking, making change visibility part of standard leadership decision-making processes.
The shift from “push” to “pull” model represents a fundamental change in how organisations approach change support. Rather than change teams offering services that business leaders may or may not utilise, leaders began actively seeking change management support as they recognised its impact on business performance. This cultural shift enhanced change management maturity across the enterprise whilst improving transformation outcomes. Case Study 2.
Enhanced decision-making through integrated reporting enabled leaders to understand the connection between change management effectiveness and business performance. By combining operational metrics with change management insights, executives could make more informed decisions about resource allocation, timing, and implementation approaches. The results included measurable improvements in project delivery timelines, reduced implementation costs, and sustained adoption of new capabilities.
Capability development through data insights became possible when organisations could track change management effectiveness over time and identify patterns that enhanced future performance. Rather than relying on subjective assessments or anecdotal evidence, mature organisations use data analytics to understand which change approaches work best in their specific context, enabling continuous improvement in change capability. Case Study 3.
The strategic value of integrated change management platforms
Modern enterprise change management requires sophisticated technology tools that can integrate with existing business systems whilst providing change-specific analytics and insights to augment what is currently missing. The Change Compass platform demonstrates how organisations can achieve enterprise change management maturity through strategic technology implementation rather than organisational restructuring.
Data integration capabilities enable organisations to connect change management metrics with business performance indicators, creating comprehensive dashboards that support strategic decision-making. This integration provides leaders with real-time visibility into change portfolio health, resource utilisation, and business impact, enabling proactive management rather than reactive problem-solving.
Predictive analytics for change planning help organisations anticipate change capacity requirements, identify potential resource conflicts, and optimise transformation sequencing. By analysing historical change data alongside business planning information, organisations can make more informed decisions about when to launch initiatives, how to allocate resources, and where to focus capability development efforts.
Competency tracking and development becomes systematic when organisations can monitor change management skills across the enterprise whilst identifying development needs and tracking progress over time. This creates targeted capability building that addresses specific organisational gaps rather than generic training approaches.
Building your enterprise change management capability
Enterprise change management represents one of the most significant opportunities for competitive advantage in today’s rapidly changing business environment. Organisations that build systematic change capability position themselves to respond more quickly to market dynamics, implement strategic initiatives more effectively, and sustain transformation outcomes over time.
The evidence is compelling: enterprise change management delivers measurable ROI through improved project success rates, reduced implementation costs, faster time-to-value, and sustained adoption of new capabilities. More importantly, organisations with mature change capability can pursue strategic opportunities that competitors cannot effectively implement.
The Change Compass platform empowers organisations to accelerate their journey toward enterprise change management maturity through data-driven insights, integrated measurement, and systematic capability development. The Change Compass enables transformation through strategic enhancement of existing processes and systems.
Leading organisations are already experiencing the benefits: enhanced leadership decision-making through integrated change and business metrics, improved resource efficiency through portfolio-level visibility, and sustained capability development through systematic tracking and analytics. These results create compound value that increases with each transformation initiative.
The opportunity for competitive advantage through superior change capability has never been greater. Market conditions demand rapid response to changing customer needs, competitive threats, and regulatory requirements. Organisations with enterprise change management capability can adapt faster, implement more effectively, and sustain transformation outcomes that create lasting competitive advantage.
Ready to transform your organisation’s change capability and start delivering measurable business value through enterprise change management? Discover how The Change Compass can help you build the data-driven change capability your organisation needs to thrive in today’s dynamic business environment.
Managing multiple change initiatives is not a new concept nor is it new to organizations. What is perhaps ‘newer’ is how change practitioners are using data to manage multiple changes. Change practitioners that manage a portfolio of initiatives used to focus on building capability in various arenas from employee capability, leadership capability, through to the effectiveness of engagement and learning channels. However, using business and change management data to help companies is just as critical.
Is change management becoming more important?
Yes, change management is increasingly vital in today’s fast-paced business environment. Organizations face constant shifts in technology, market demands, and workforce dynamics, which impact their business processes. Effectively managing these changes helps minimize resistance, enhances employee engagement, and ensures smoother transitions, ultimately leading to improved performance and sustainability in a competitive landscape.
In this article, we will explore the top five challenges associated with the current approaches to managing multiple change initiatives, including the implementation of the change due to lack of resources and insufficient resources. We explore these common approaches and critique key challenges, along with alternatives.
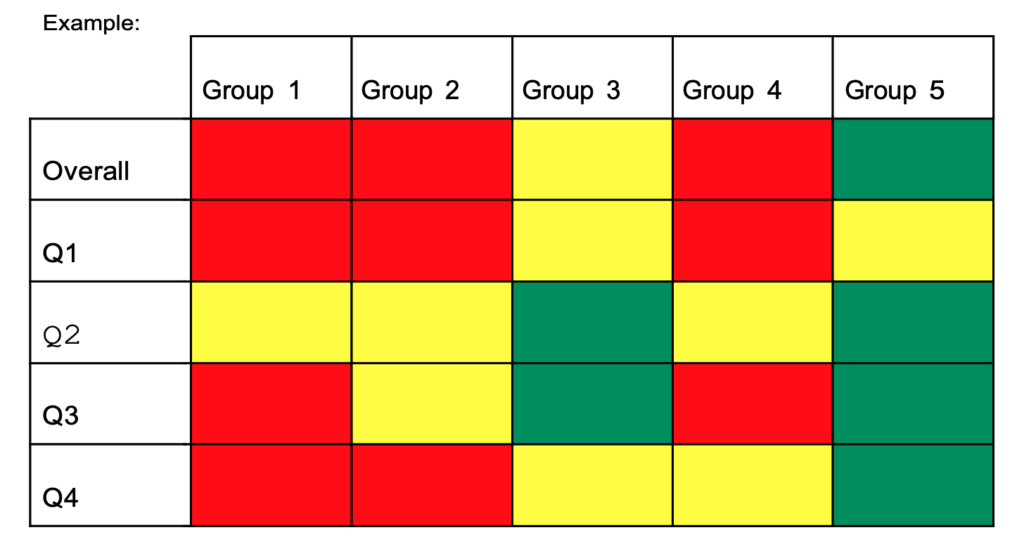
Change heatmaps have become a popular tool for classifying departments based on the impact of a change initiative. However, two key issues often arise with this approach: the oversimplification of the traffic light classification system and the lack of granularity at the department level.
One of the most common ways to visually depict the impact of multiple changes is to use the heatmap. This is normally using a 3-point rating system (high, medium, low) to determine the level of impact across the various departments across the organisation. Whilst the rating process is an easy exercise, there are some very serious challenges:
Even for the 3 level rating system the change practitioner may be challenged with how this rating is determined and what it is based on. Not every team within the same department may be equally impacted
There may be different impacts for different roles within the same team and department
The impact may be different depending on whether the focus is on employees, customers, process, system or partner
Typically most use a monthly rating scale. However, for busy organisations with lots of changes, the change volume may go up and down within the same month. With one rating it oversimplifies what actually happens throughout the month
With only 3 levels of ratings, a lot of departments end up having the same rating level for months, meaning there is not much they can do with this data.
In Summary, the summarised monthly rating for one department indicates medium-level change. But at what time of the month, for what role, for what team, and for what type of impact?
The below is an example of a change heatmap from the University of California, Berkeley.
a. Traffic Light Classification Too Simplistic:
The traditional red, yellow, and green traffic light system used in change heatmaps is a simple way to communicate the status of a department’s readiness for change. However, this simplicity can be misleading. Red may indicate a problem, but it does not provide insights into the nature or severity of the issue. Likewise, green may suggest readiness, but it might hide underlying complexities or dependencies.
Even for the 3 level rating system the change practitioner may be challenged with how this rating is determined and what fact it is based on. Also, the impact may be different depending on whether the focus is on employees, customers, process, system or partner. Typically most use a monthly rating scale. However, for busy organisations with lots of changes, the change volume may go up and down within the same month. With one rating it oversimplifies what actually happens throughout the month. Even if the singular departmental rating is split into rating by initiative, this does not provide an aggregate department-level rating that is aggregated based on logic.
To overcome this challenge, organizations need a more nuanced classification system that takes into account the specific issues within each category. This could involve incorporating additional colours or using a numerical scale to better represent the diversity and complexity of challenges within each department.
b. Department Level Not Granular Enough:
While change heatmaps provide a high-level overview, they often lack the granularity required to understand the specific challenges within each department. Different teams within a department may be impacted differently, and a broad classification may not capture these variations.
To address this issue, organizations should consider adopting a more detailed classification system that breaks down each department into its constituent parts. This granular approach allows for a more targeted and effective change management strategy, addressing specific issues at the team and role levels.
In Summary, the singular monthly rating for one department indicates medium-level change. But at what time of the month, for what role, for what team, and for what type of impact?
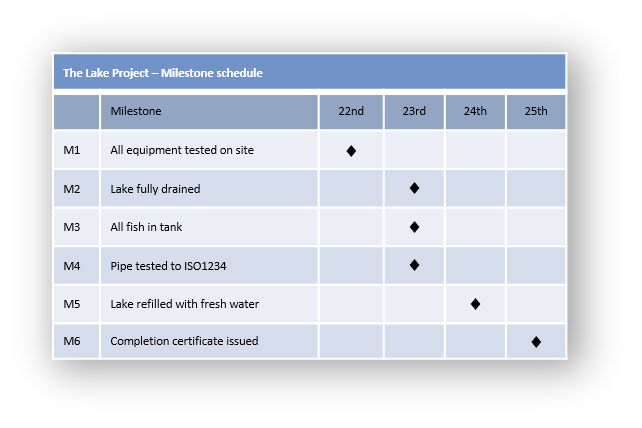
2) Using Project Milestone Roadmap to Sequence Impacts
Project milestone roadmaps are commonly used to sequence the impacts of change initiatives. However, this approach faces challenges in terms of the sufficiency of milestones and the difficulty of overlaying multiple capacity considerations.
Below is an example from Praxis Framework.
a. Milestones Are Not Sufficient vs Overall Aggregate Impact Levels:
While project milestones provide a structured timeline for change initiatives, they may not capture the full scope of the impact on the organization. Engaging key stakeholders is essential during this process, as milestones often focus on project-specific tasks and may overlook broader organizational changes that occur concurrently. For example, adoption may require months and is not a single point-in-time milestone per se.
To overcome this limitation, organizations should supplement milestone roadmaps with an overall aggregate impact assessment. This holistic view ensures that the sequence of milestones aligns with the broader organizational objectives and minimizes conflicts between concurrent initiatives.
b. Difficulty of Overlaying Multiple Capacity Considerations:
Managing multiple change initiatives requires a delicate balance of resources, and overlaying capacity considerations can be challenging due to the scope of the change. Project milestone roadmaps may not adequately address the interdependencies and additional resources needed due to the resource constraints that arise when multiple initiatives are in progress simultaneously.
To enhance capacity planning, organizations should invest in advanced project management tools that allow for the dynamic adjustment of timelines based on resource availability. This ensures a realistic and achievable sequencing of impacts, taking into account the organization’s overall capacity.
3) Relying Purely on Excel and PowerPoint to Manage Multiple Change Initiatives
While Excel and PowerPoint are ubiquitous tools in the business world, relying solely on them to manage multiple change initiatives presents challenges related to the agile nature of changes and the difficulty of having interactive data-based conversations. This is especially the case that most change initiatives are digital changes, and yet they are been managed using non-digital means? How can change practitioners ‘be the change’ when they are using dated ways of driving digital change?
a. Agile Nature of Changes Means Ongoing Updates Are Required:
Change initiatives are inherently dynamic, and their requirements can evolve rapidly, especially in response to market shifts. Excel and PowerPoint, while useful for static reporting, lack the real-time collaborative capabilities needed to accommodate the agile nature of changes while maintaining the status quo.
To address this challenge, organizations should consider adopting change management and collaboration tools that enable real-time updates and collaboration. Cloud-based platforms provide the flexibility to make ongoing adjustments, ensuring that stakeholders are always working with the latest information.
b. Difficulty of Having Interactive Data-Based Conversations and Federated Model of Change Data:
Excel and PowerPoint may struggle to facilitate interactive discussions around change data. As organizations increasingly operate in a federated model, with dispersed teams working on different aspects of change initiatives, a more collaborative and integrated approach is essential.
Implementing dedicated change management platforms that support interactive data-based discussions can enhance collaboration and provide a centralized repository for change-related information. This ensures that all stakeholders have access to the latest data, fostering a more transparent and collaborative change management process.
4) Preparing Business Operations Readiness for the Amount of Change
Preparing business operations for a significant amount of change requires a strategic approach that incorporates capacity and time considerations while maintaining granularity in data.
a. Using Business Operations Speak: Capacity, resources, time.
Business operations readiness is often discussed in terms of capacity and time. However, the challenge lies in translating these concepts into actionable plans. Capacity planning involves understanding the organization’s ability to absorb change without compromising existing operations, while time considerations are crucial for ensuring a smooth transition without disruptions.
Change practitioners need to distill the ‘ask of the business’ in business speak. Business stakeholders may not be interested in the various classifications of change or the varying degrees of cultural changes involved. What they are interested in is what you want from my team, how much time you need them to dedicate, and for what team members, so that they can plan accordingly.
b. Granularity of Data:
The granularity of data is essential for effective business operations readiness. Generic metrics may not capture the specific needs and challenges of individual departments or teams, leading to oversights that can impact the success of change initiatives.
Implementing a comprehensive data collection and analysis strategy that considers the unique requirements of each business unit ensures a more accurate understanding of operational readiness. This granularity allows organizations to tailor change management strategies to specific needs, enhancing the likelihood of successful implementation.
5) Getting Executive Engagement and Decision Making
Ensuring executive engagement and decision-making is critical for the success of change initiatives. However, achieving this engagement poses its own set of challenges.
To overcome this challenge, organizations should:
Establish Clear Governance and Engagement Channels:
Ensure that there is in place a clear governance bodies making decisions on the overall control of successful change initiatives across the organisation, focusing on the success of the change. A robust communication strategy ensures that communication channels between change management teams and executives are also well-defined and effective. Regular updates and transparent reporting on the progress and challenges of change initiatives build trust and encourage executive engagement.
Align Change Initiatives with Strategic Objectives:
Demonstrate the alignment of change initiatives with key performance indicators related to the organization’s strategic goals and objectives. Executives are more likely to engage when they see how a particular change contributes to the overall success of the organization and its growth.
Provide Decision-Making Frameworks:
Equip executives with decision-making frameworks that guide them through the complexities of change initiatives. Clearly defined criteria for evaluating the success of a change, along with potential risks and mitigation strategies, empower executives to make informed decisions.
Highlight the Business Impact:
Clearly articulate the business impact of change initiatives. Executives are more likely to engage when they understand the tangible benefits and potential risks associated with a particular change. Use data and analytics to support the business case for change.
Offer Ongoing Support and Education:
Ensure that executives have the necessary support and training to navigate the complexities of change management at all levels of the organization. This includes providing relevant information, resources, and sufficient time to help them make informed decisions and actively participate in the change process, especially regarding new processes. Creating ‘bite-sized’ and summarised insights is key for executives.
Effectively managing multiple change initiatives is a complex task that requires a holistic and adaptive approach. By addressing the challenges of change management, including change management obstacles associated with classification, sequencing, tool reliance, business operations readiness, and executive engagement, organizations can enhance their change management strategies and increase the likelihood of successful outcomes, ultimately maintaining a competitive edge. Embracing innovative tools, fostering collaboration, and maintaining a strategic focus on organizational goals are key elements in overcoming these challenges and navigating the ever-evolving landscape of change.
In this article, we’ve stressed the importance of data. You may wonder about the amount of time and effort required to establish all the various points mentioned in the article and if this is even doable. Well, using Excel and other static non-digital ways of managing change data will mean a significant volume of work, and even then it may not provide a clear picture that gives you the various cuts of data required to drive meaningful conversations. Resort to automation provided by change management software such as The Change Compass to assist in data capture, data analysis, and dashboard generation.
How to measure change saturation: a practical methodology for enterprise change functions
Most organisations can feel change saturation before they can prove it. Leaders sense that employees are struggling, change managers notice adoption slipping, and business partners start raising concerns about “too much at once.” But when it comes to quantifying the problem, securing executive attention, or making a credible case for adjusting programme sequencing, feeling is not enough.
Measurement changes that dynamic entirely. An organisation that can measure change saturation can demonstrate it, act on it, and prevent it from quietly undermining transformation outcomes. An organisation that cannot measure it is stuck responding to symptoms rather than causes.
This article sets out a practical methodology for measuring change saturation in enterprise environments: what to measure, how to score it, what the data tells you, and how to turn the output into decisions that protect adoption and reduce change fatigue.
Why change saturation is so difficult to measure
The challenge with measuring change saturation is that it is not a single variable. It is an emergent condition that arises from the interaction between several variables: the volume of concurrent changes landing on a group, the intensity of each change, and the capacity of the group to absorb them. None of these is directly observable in isolation.
Volume is relatively straightforward to count: how many programmes are actively affecting this group right now? But volume without intensity gives you an incomplete picture. A group managing two major system replacements simultaneously is more saturated than a group managing ten minor policy updates. And both assessments are useless unless they are calibrated against capacity: a high-performing change champion network in a well-managed business unit with experienced managers can absorb more than a stretched team in the middle of a restructure.
Prosci’s Best Practices in Change Management research found that 73% of organisations surveyed were near, at, or beyond the saturation point. The reason that number is so high is not that organisations are careless. It is that most organisations have no systematic way to see saturation building before it becomes critical.
The three dimensions of a change saturation measurement model
A rigorous methodology for measuring change saturation needs to address all three dimensions: load, intensity, and capacity.
Dimension 1: Change load
Change load is the quantitative foundation of saturation measurement. It answers the question: how much change is being asked of this group, across all programmes, right now?
Calculating change load requires a portfolio-level view. For each group of employees, you need to know:
How many programmes are currently in active delivery (preparation, go-live, or post-go-live embedding)
The size of the group and the proportion affected by each programme
The timeline of each programme’s peak demand periods
A simple change load index can be constructed by assigning each programme a weight (based on the size and duration of its demand on the group) and summing those weights for each group across the current period. The output is a comparative score: Group A has a load index of 4.2, Group B has a load index of 1.8. High-load groups are immediate candidates for deeper investigation.
Dimension 2: Change intensity
Not all changes demand the same cognitive and behavioural adjustment. Change intensity measures how disruptive each individual programme is to the employees it affects. A robust intensity assessment covers the following dimensions:
Process change: Are employees being asked to follow materially different processes or procedures?
System change: Are new technologies being introduced that require new skills and habits?
Role change: Are roles being restructured, responsibilities shifting, or reporting lines changing?
Behavioural change: Are fundamental ways of working or cultural norms being challenged?
Location and environment: Are physical working arrangements changing?
Each dimension is typically scored on a scale of one to five: one meaning minimal adjustment required, five meaning radical shift. The total intensity score for a programme across all dimensions provides a standardised basis for comparison that goes well beyond “major” and “minor” labels.
When intensity scores are multiplied by the number of people affected, you get a weighted impact figure that can be aggregated across all programmes to give a cumulative impact score for any stakeholder group.
Dimension 3: Absorption capacity
Absorption capacity is the most subjective of the three dimensions, but it is also the most important for calibrating risk. Two groups facing identical change load and intensity may have very different actual saturation risk depending on their current capacity to absorb change.
Factors that increase absorption capacity include: a recent track record of successful change adoption, strong and engaged line managers who actively support transitions, low current business workload, a stable team structure, and access to dedicated change support resources.
Factors that reduce absorption capacity include: recent history of poorly managed change, a restructure or leadership transition in the past twelve months, high current business workload or seasonal pressure, high attrition in the period, and limited manager availability.
Capacity can be assessed using a structured scoring approach: assign each factor a weight and a score, sum the results, and produce a capacity index. When capacity is low and load is high, the saturation risk calculation shifts dramatically.
Combining the three dimensions: the saturation risk score
Once you have load, intensity, and capacity scores for each stakeholder group, you can combine them into a single saturation risk score. The formula is straightforward in principle:
Saturation Risk = (Change Load x Average Intensity) / Absorption Capacity
Groups with a high numerator (high load and high intensity) and a low denominator (low capacity) are at the greatest risk of saturation. Groups with moderate load, moderate intensity, and high capacity may be managing comfortably.
The specific weighting and calibration of this formula will vary by organisation. The important thing is that the formula is applied consistently across all groups and time periods so that comparisons are meaningful. An organisation that calculates saturation risk scores every quarter develops a trend view: is this group’s score rising, stable, or declining? That trend view is often more actionable than any single data point.
Gartner’s research on change fatigue identifies the cascading effects of high saturation: employee intent to stay declines by up to 42% and individual performance can fall by up to 27%. Having a risk score that flags these conditions before they materialise is what gives organisations time to intervene.
Leading indicators: what to watch before saturation becomes critical
Quantitative load, intensity, and capacity scores are the analytical foundation. But they are only as useful as the data that feeds them. Leading indicators provide an early warning layer that flags emerging saturation risk in real time.
The most reliable leading indicators for change saturation include:
Readiness assessment scores: If stakeholder readiness surveys are showing declining confidence in the same groups across multiple programmes, that is a strong signal of emerging saturation even before adoption data confirms it.
Support ticket volume and type: A spike in “how do I” tickets, process queries, or errors in a group that has recently gone through multiple changes indicates that new ways of working are not yet embedded.
Manager-reported concerns: Direct reports from line managers about team overload, confusion about priorities, or declining morale are a ground-level signal that formal data often misses.
Participation rates in change activities: Declining attendance at training sessions, communications open rates falling, or drop-off in workshop participation are early indicators that employees are starting to disengage from change processes.
Pulse survey sentiment: Structured short-cycle surveys asking employees specifically about their change experience, not just general engagement, can surface saturation signals weeks before adoption metrics deteriorate.
The value of these indicators is in their combination. Any single signal can have alternative explanations. When multiple leading indicators are moving in the same direction for the same group, the probability of saturation risk is high.
Lagging indicators: confirming what the leading indicators predicted
If saturation goes undetected or unmanaged, it will eventually show up in lagging indicators. These are retrospective: they confirm that saturation has already occurred, rather than giving you time to prevent it.
Key lagging indicators include:
Adoption rates below threshold: If post-go-live adoption data shows that target behaviours are not being sustained at expected levels, saturation is one of the most common root causes.
Benefits realisation shortfalls: When programmes that expected to deliver financial or operational outcomes within a defined period consistently fall short, compounded change load is often a contributing factor.
Attrition spikes in high-change groups: Research from Prosci identifies that 54% of employees experiencing change fatigue actively look for a new role. Voluntary attrition data disaggregated by group and correlated with change load data can confirm saturation impact after the fact.
Quality or error rate increases: In operational groups going through system or process changes, a measurable increase in errors or rework can indicate that employees are not yet proficient in the new ways of working.
Tracking lagging indicators matters for two reasons. First, they close the loop on the saturation risk methodology: if your risk scores correctly predicted the groups that experienced adoption failure, your model is calibrated well. Second, they provide the evidence base for executive conversations about saturation impact, which is often necessary before organisations will invest in prevention.
Building a change saturation dashboard
Measurement only creates value when it is visible to the people who can act on it. A change saturation dashboard serves as the primary communication tool for the enterprise change function, translating complex multi-variable analysis into a format that programme sponsors, business unit leaders, and transformation executives can consume quickly.
An effective saturation dashboard includes:
Portfolio heat map by group: A matrix showing which stakeholder groups are carrying the highest change load in the current quarter, with colour coding indicating saturation risk levels.
Trend lines for high-risk groups: For groups flagged as high-risk, a rolling view of their saturation score over the past two to four quarters.
Programme convergence view: A calendar-based visualisation showing where multiple programmes are landing on the same groups in the same window.
Leading indicator summary: A consolidated view of the current readings on key leading indicators, with flagging for any that are trending in a concerning direction.
Intervention log: A record of what saturation management interventions have been initiated, by whom, and for which groups.
This kind of visibility transforms saturation management from a reactive exercise into a governance function. When the dashboard is presented regularly to the portfolio governance committee, saturation risk becomes a standing agenda item alongside cost, schedule, and scope.
Practical tools for saturation measurement at scale
For enterprise change functions managing ten or more concurrent programmes, the practical challenge of measuring saturation is significant. The data collection, aggregation, and analysis required to maintain a current, accurate view of saturation risk across a complex portfolio cannot be managed sustainably in spreadsheets.
Change Compass is built specifically for this challenge. The platform provides enterprise change functions with a centralised data infrastructure for capturing change impact and load across the portfolio, automated aggregation of cumulative change demand by stakeholder group, and real-time visualisation of saturation risk. Rather than manually compiling data from twelve different programme SharePoint sites, change managers can work from a single source of truth that surfaces portfolio-level risk automatically.
For change teams in the early stages of building measurement capability, starting with the Change Compass weekly demo is a practical way to see what portfolio-level saturation measurement looks like in practice before committing to a platform investment.
Making measurement actionable: from scores to decisions
The ultimate purpose of measuring change saturation is not to produce scores. It is to produce better decisions about how the change portfolio is managed. A saturation risk score that sits in a report and is never acted on has no value.
The decisions that saturation measurement should be driving include:
Sequencing decisions: When high-risk groups are identified, programme governance should have a mechanism to delay or phase go-live dates for lower-priority programmes to reduce peak load.
Resourcing decisions: Groups identified as high-risk may require additional change support capacity, including dedicated practitioners, enhanced manager coaching, or intensified communication.
Scope decisions: When sequencing is not possible, MVP thinking applied to change scope can reduce the intensity of individual programmes landing on high-risk groups.
Reporting decisions: High-risk groups should be on the executive sponsor radar, with regular updates on saturation indicators and intervention progress.
Prosci’s research on change management metrics consistently identifies that organisations that actively measure and act on change data are significantly more likely to meet or exceed their project objectives. The measurement methodology matters, but the governance mechanism that turns measurement into action matters just as much.
Where to start: a phased approach to building saturation measurement capability
Most enterprise change functions cannot build a full saturation measurement system overnight. The most practical approach is phased.
Phase 1: Establish the data foundation. Standardise the change impact assessment template across all programmes so that group-level impact data is collected in a consistent, comparable format. Without this, aggregation is impossible.
Phase 2: Build the portfolio view. Map all active and upcoming programmes against the employee population in a shared register. Identify which groups are affected by more than two significant changes in the next quarter.
Phase 3: Add the intensity layer. For the highest-load groups identified in Phase 2, conduct structured intensity assessments for each programme affecting them. Calculate cumulative intensity scores.
Phase 4: Introduce capacity assessment. Develop a structured capacity scoring instrument for the highest-risk groups. Combine load, intensity, and capacity scores into a risk index.
Phase 5: Automate and sustain. Move from manual calculation to platform-supported aggregation and visualisation, so that saturation risk is maintained as a live view rather than a quarterly exercise.
The organisations that manage change saturation most effectively are those that started this journey early enough to have meaningful data before the next major convergence point. The methodology above is scalable from small beginnings, but the longer measurement is deferred, the less lead time there is to act.
Frequently asked questions
What is the best way to measure change saturation?
The most robust approach combines three dimensions: change load (the volume of concurrent programmes affecting a group), change intensity (how disruptive each programme is across process, system, role, and behavioural dimensions), and absorption capacity (the group’s current ability to take on change). Combining these into a saturation risk score, tracked over time, provides a meaningful basis for governance and intervention decisions.
How do you know when an organisation has reached change saturation?
Saturation is typically confirmed by a combination of leading and lagging indicators. Leading indicators include declining readiness scores across multiple programmes for the same groups, rising support ticket volumes, and falling participation in change activities. Lagging indicators include below-target adoption rates, benefits realisation shortfalls, and voluntary attrition spikes in high-change groups. When multiple signals align, saturation is almost certainly a factor.
What data do you need to measure change saturation?
The minimum data set includes: the change portfolio (all active programmes and their timelines), impact assessment data (which groups are affected, how significantly), readiness and adoption metrics from each programme, and capacity indicators for the highest-risk groups. Ideally this data is maintained in a centralised platform rather than distributed across programme-level documents.
Can change saturation be measured at the team level?
Yes, and team-level measurement is often the most actionable. While portfolio-level heat maps identify which business units or functions are carrying the highest load, team-level analysis identifies where the risk is most acute and allows targeted support to be directed precisely. Line manager input is essential for accurate capacity assessment at the team level.
How often should change saturation be measured?
At a minimum, quarterly. For organisations running fast-moving transformation portfolios, monthly or rolling measurement is more appropriate. The goal is to have enough lead time to act on risk signals before they translate into adoption failure. A retrospective saturation assessment after go-live confirms what happened but does not allow intervention.
Every change leader has seen the heat map. It sits in the deck, a grid of red, amber and green cells showing which business units are being hit hardest over the next 12 months. The leadership team glances at the red cells, nods gravely, and the meeting moves on. Decisions are made. Resources are allocated.
But here is the problem: the heat map may be the most widely used change planning tool in organisations today, and one of the most misleading. It answers the wrong question. It flattens nuanced impact into a single colour. And it creates a false sense of certainty that can actively harm your change planning.
This article is a change management heat map explained for senior practitioners. We will cover what a heat map is, where it genuinely adds value, and why relying on it as your primary decision-making tool puts your programme at risk. We will also explore what better approaches look like in practice.
What is a change management heat map?
A change management heat map is a visual tool that maps the volume or intensity of change impacts across an organisation over time. Typically displayed as a grid, it plots business units or employee groups on one axis against a timeline on the other. Each cell is colour-coded, usually using a traffic light system, to indicate the relative level of change exposure.
The premise is straightforward: where the cells are red, change intensity is high. Where they are green, the change load is manageable. Leaders can scan the map quickly and form a view of where the organisation is under pressure.
According to a 2024 review of change management decision-making tools on ResearchGate, organisations that use structured, visual change data to support planning decisions are significantly more likely to align stakeholders and maintain project momentum than those relying on narrative reporting alone. That finding reflects why heat maps became popular, they translate complex programme data into something immediately scannable for executives. Their appeal is real.
How heat maps are constructed in practice
Most heat maps are built by change managers or PMO leads who collect data from individual project teams, typically asking each team to rate how much impact their initiative will have on each business unit in each quarter. Those ratings are then aggregated into a single heat level per cell.
There are two common formats:
Project-versus-stakeholder group: Each row is a project, each column is a business unit, and the cell shows that project’s impact on that group. This format works well when you need to communicate a specific initiative’s reach.
Business unit over time: Each row is a business unit, each column is a quarter, and the cell aggregates all project impacts on that group for that period. This is the more popular format for portfolio-level planning.
Both are useful. Both are also problematic when treated as the primary basis for change decisions.
Where the change management heat map adds genuine value
Before dismantling the heat map, it is worth acknowledging what it does well, because used appropriately, it remains a valuable part of the change practitioner’s toolkit.
It makes the case for change management resourcing. When a heat map shows a business unit sitting under sustained red for three consecutive quarters, it is a compelling argument for additional change capacity. The visual is immediate. Executives who struggle to grasp the volume of concurrent change often respond well to seeing it rendered spatially.
It supports initial triage. Early in a programme, when you are still gathering impact data, a heat map gives you a rough signal of where to direct attention first. It is not the final word, but it is a useful starting point for conversations.
It builds stakeholder alignment. Showing a leadership team a heat map of their organisation’s change exposure can generate productive dialogue. Leaders who assumed their business unit was not heavily affected may be surprised. That conversation, however imperfect the underlying data, can be valuable.
It communicates portfolio scale. For boards and executive committees who need a summary view, the heat map provides a visual shorthand for “this organisation has a lot happening simultaneously.” That message matters and the heat map delivers it efficiently.
The problem is not the heat map itself. The problem is what happens when it is used as the definitive basis for change planning decisions rather than one input among many.
Why the change management heat map creates risk when used alone
The aggregation problem distorts reality
The fundamental flaw in the standard heat map is that it aggregates impact ratings into a single score per cell. When a business unit is rated “red” in Q2, that cell may represent three projects each scoring moderate impact, or it may represent one catastrophic system implementation layered with a restructure and a compliance change. The cell colour is identical. The response required is entirely different.
This aggregation problem compounds when you consider that different types of change create different demands on employees. A technology rollout requires training time, system access, and behaviour change. A restructure creates psychological uncertainty and role ambiguity. A process change requires procedural relearning. Combining these into a single heat score does not reveal the nature of the burden, only the rough magnitude. And even the magnitude is suspect, because it depends entirely on how each project team calibrated their rating.
Prosci’s research on the correlation between change management and project success consistently finds that the quality of change management practice, not the quantity of change, is the primary driver of outcomes. Organisations that apply structured, high-quality change management are six times more likely to meet project objectives. The heat map, by focusing purely on volume, misses the quality dimension entirely.
Red cells do not tell you what to do
Suppose a business unit is sitting in red for Q3. What does that tell you? It tells you there is a lot happening. It does not tell you:
Which projects are driving the heat
Whether the impacted employees have capacity to absorb the change
Whether the business unit’s leadership is aligned and actively sponsoring the change
Whether there is any time within the quarter for training and adoption activities
Whether any of the projects could be de-scoped, delayed or phased
The heat map surfaces a symptom but provides no diagnostic information. It tells you the patient has a fever, not what is causing it or how to treat it. Senior leaders who see a red cell often ask the obvious question, “what should we do about this?” The heat map cannot answer that question.
Heat maps obscure the employee experience
The most significant limitation of the heat map is that it represents organisational units, not people. A business unit of 500 employees may have 50 people in roles that are heavily impacted by three concurrent changes, and 450 who are barely touched. The entire unit turns red because of the concentrated experience of a minority.
Conversely, a business unit showing amber or green may have pockets of employees who are completely overwhelmed because the changes affecting them happen to fall below the threshold that triggers a red rating at the aggregate level.
Research on change saturation in large organisations highlights that change overload is often a localised experience, felt acutely by specific groups, roles or teams, while the broader unit appears to be coping. A tool that averages across the business unit will consistently miss these hot spots. And it is the hot spots where change fails.
Better approaches to change impact decision making
The heat map should not be abandoned. It should be contextualised, supplemented, and in many cases, replaced as the primary planning tool with approaches that provide richer and more actionable insight.
Stakeholder-level impact analysis
Rather than mapping change at the business unit level, more sophisticated change teams map impact at the role or stakeholder group level. This means asking: which specific roles are affected by this change, and what does the change require of those people in terms of behaviour, process, systems and mindset?
This approach produces a much more granular picture of change exposure. It allows you to identify the roles carrying the highest load, where those roles cluster across the organisation, and whether those clusters correlate with your heat map’s red cells or deviate from it. Frequently, they deviate significantly.
Stakeholder-level analysis also supports much more targeted change activities. Rather than deploying a generic communications and training plan to an entire business unit, you can tailor your approach to the specific groups facing the highest impact and the lowest readiness.
Change volume over time, by impact type
A more informative version of the heat map separates change volume by impact type: process changes, technology changes, structural changes, and so on. This allows you to see not just how much change is happening to a group, but what kind. A quarter that contains significant technology change and structural change requires a very different response to one containing a series of smaller process updates, even if both produce the same aggregate heat score.
Adding a capacity dimension, actual available time for change activities within the quarter, makes this even more powerful. A business unit that is in a critical operational period, such as a financial year-end or a major product launch, has less capacity to absorb change regardless of the nominal heat level. Surfacing that constraint visually can prevent change teams from scheduling major activities during windows when employees simply cannot engage.
Integrated change analytics
The most effective change teams have moved beyond the heat map to integrated change analytics platforms that allow them to slice impact data by multiple dimensions simultaneously: project, business unit, role, impact type, timing, readiness, and adoption progress. This is not just a more complex heat map. It is a fundamentally different way of generating insight.
Prosci’s 2024 analysis of change management trends identifies data-driven change management as one of the most significant emerging practices in the field. Organisations that invest in change analytics capabilities are building a durable competitive advantage, not just for the current programme but for their long-term transformation capacity.
The shift from heat mapping to integrated analytics mirrors what has happened in project management, finance and HR over the past two decades. In each case, the move from summary dashboards to richer, multi-dimensional data produced better decisions. Change management is on the same trajectory.
Using digital tools to go beyond the heat map
Digital change management platforms are making it significantly easier for change teams to move from manual heat maps to integrated analytics without requiring data science expertise or custom IT development. Tools like The Change Compass allow change teams to input impact data at a granular level and then generate views that surface the insights a traditional heat map cannot: which roles are carrying the highest load, how change volume correlates with adoption outcomes, and where readiness gaps are most likely to translate into project risk.
Critically, these platforms allow the heat map to exist as one view among many, rather than the only view. Leaders who want the executive summary can see the heat map. Programme leads who need to understand the detail can interrogate the underlying data. Change managers who are designing interventions can filter by role, project, or time period to understand the specific context they are working in. This layered approach preserves the communicative value of the heat map while removing its limitations as a decision-making tool.
If your organisation is ready to explore what this looks like in practice, The Change Compass offers a weekly demo where you can see how leading organisations are using integrated change analytics to make better portfolio decisions.
Conclusion: use the heat map, but do not stop there
A change management heat map explained to its fullest is both a useful communication tool and a dangerous oversimplification. It makes complex portfolio data accessible to senior audiences. It supports initial triage. It creates a shared visual language for conversations about change volume and timing. These are genuine contributions.
But it was never designed to be the primary basis for change planning decisions, and treating it as such creates real risk. It flattens the nuance of different impact types, hides the employee-level experience of change saturation, and provides no diagnostic information about what to do when cells turn red.
The organisations managing change most effectively are those that use the heat map as an entry point, not a destination. They supplement it with stakeholder-level analysis, impact-type breakdowns, capacity data, and integrated analytics that allow them to understand not just where change is concentrated but why it is concentrated there and what the right response is. That is what good change portfolio management looks like in practice.
Frequently asked questions
What is a change management heat map?
A change management heat map is a visual tool, typically a grid, that displays the volume or intensity of change impacts across different parts of an organisation over time. Cells are colour-coded, most commonly using a traffic light system, to show where change load is highest. It is widely used in portfolio-level planning to give leaders a summary view of change exposure across the business.
Why do organisations use heat maps for change management?
Heat maps are popular because they translate complex programme data into a format that is immediately scannable for executives. They help build the case for change management resourcing, support initial triage of where to focus attention, and create a shared visual language for conversations about change volume and timing. Their simplicity is both their appeal and their limitation.
What are the main limitations of change management heat maps?
The main limitations are threefold. First, they aggregate impact into a single score per cell, losing the nuance of what types of change are happening and to whom. Second, a red cell tells you there is a problem but provides no information about what to do. Third, they operate at the business unit level, which can hide pockets of severe change saturation affecting specific roles or teams while the broader unit appears manageable.
How should a change management heat map be used effectively?
A heat map should be used as one input among several, not as the primary decision-making tool. It works best for executive communication and initial portfolio triage. For operational change planning decisions, it should be supplemented with stakeholder-level impact analysis, change volume breakdowns by impact type, capacity data, and, where possible, integrated change analytics that allow multi-dimensional interrogation of impact data.
What are the alternatives to change management heat maps?
Better alternatives include stakeholder group or role-level impact matrices, change volume timelines segmented by impact type, capacity-adjusted planning views, and integrated change analytics platforms that allow you to slice data by project, business unit, role, timing and readiness simultaneously. These approaches provide the diagnostic information that heat maps cannot, specifically what is driving the heat and what the right response is.
How do digital tools improve on traditional heat maps?
Digital change management platforms allow teams to input impact data at a granular level and generate multiple views from the same dataset. Leaders can access the summary heat map view for executive reporting while change managers can interrogate underlying data by role, project, or time period. This layered approach preserves the communicative value of the heat map while removing its limitations as a primary planning tool.
References
Prosci. The Correlation Between Change Management and Project Success. https://www.prosci.com/blog/the-correlation-between-change-management-and-project-success
Prosci. Change Management Trends Outlook: 2024 and Beyond. https://www.prosci.com/blog/change-management-trends-2024-and-beyond
ResearchGate. The Role of Change Management in Enhancing Data-Driven Decision Making: Insights from Business Intelligence Initiatives (2024). https://www.researchgate.net/publication/384017092_The_Role_of_Change_Management_in_Enhancing_Data-Driven_Decision_Making_Insights_from_Business_Intelligence_Initiatives
The Change Compass. Why Change Saturation Is a Pandemic for Most Large Organisations. https://thechangecompass.com/why-change-saturation-is-a-pandemic-for-most-large-organisations/
IMPLEMENTATION NOTES
Post ID: 13272
Suggested title: Change management heat map explained: what it tells you, what it hides, and what to do instead
Meta description: A change management heat map explained for senior practitioners , what it does well, its critical limitations, and how to make better change decisions.
Managing multiple changes simultaneously is not an edge case in enterprise transformation. It is the norm. Most large organisations are running ten, twenty, or more concurrent change initiatives at any point in time. The assumptions that change practitioners rely on to manage this complexity have largely been inherited from single-initiative change management and applied wholesale to the portfolio context. Many of them are wrong.
This matters because wrong assumptions about managing multiple changes lead to specific, predictable, and expensive failures: adoption rates that fall short of targets, employee fatigue that accumulates into resistance, and programme sequencing decisions that look reasonable in isolation but create unnecessary risk in aggregate. Gartner’s research on change adoption found that only 32% of business leaders report achieving healthy change adoption by employees. The gap between change investment and change outcomes is real and persistent.
Working through seven assumptions that are widespread in change management practice, and what the evidence actually shows, offers a clearer picture of where portfolio-level management typically breaks down.
Assumption 1: If each programme is managed well, the portfolio will be managed well
This is the foundational assumption of most enterprise change management: that quality at the programme level aggregates into quality at the portfolio level. It is comforting because it is consistent with how resourcing models work: staff each programme with capable change managers, and the organisation’s change burden is handled.
The evidence suggests otherwise. A programme can have excellent communication, well-designed training, rigorous stakeholder engagement, and still fail to achieve target adoption if it lands in a quarter when the relevant employee group is simultaneously absorbing two other significant changes. The failure is not programme-level. It is portfolio-level. And it is invisible to a resourcing model that assigns one change manager per programme.
The assumption treats change capacity as infinite. Smartsheet’s 2025 Project and Portfolio Management Priorities Report found that 92% of PPM professionals struggle to adapt to workplace changes, and 71% say constant workplace shifts make it difficult to stay productive. Employee capacity to absorb change is finite and varies by group and by history. Portfolio management of change requires treating it as such.
Assumption 2: Change saturation is visible
Most change managers who have worked in large organisations have seen change saturation: the glazed look when a new initiative is announced, the rising resistance that seems disproportionate to the scale of the change, the help desk calls that stay high long after go-live. The assumption is that saturation is detectable when it occurs, and that practitioners will notice it in time to respond.
The problem is that saturation often builds slowly, through the accumulation of changes none of which individually seems overwhelming. By the time the symptoms are visible, the capacity depletion has already occurred and the immediate change is already in trouble.
Managing multiple changes effectively requires measuring cumulative load before saturation becomes visible. This means tracking what is landing on specific employee groups across the full portfolio, quantifying the aggregate impact, and identifying when load is approaching or exceeding historical absorption capacity. This cannot be done by observing individual programmes in isolation. It requires portfolio-level data.
Assumption 3: Communications from different programmes can be managed separately
In organisations running multiple concurrent programmes, each programme typically has its own communications plan, its own channels, and its own messaging cadence. The assumption is that employees can contextualise each communication separately and engage with it on its own terms.
In practice, employees receive communications from multiple change initiatives, often in the same week or the same day. The communications compete for attention. Employees develop filters, often unconsciously, that route change communications directly to low-priority status. The most sophisticated change communication strategy for any individual programme has to work within this noise environment.
Effective management of multiple changes requires cross-programme communication coordination: understanding what employees in specific groups are receiving from all programmes simultaneously, and designing communications that acknowledge the full change context rather than pretending each change exists in isolation. An employee who has received three change communications this week does not need a fourth that opens with “we are excited to announce.” They need a communication that is specific, brief, and gives them exactly what they need to act.
Assumption 4: Training is the primary adoption lever
The allocation of change budget in most programmes is disproportionately weighted toward training design and delivery. This reflects an implicit assumption that knowledge is the primary barrier to adoption: if employees understand the new system or process, they will use it.
Knowledge is necessary but not sufficient. The research on adoption failure consistently finds that employees who have completed training and understand the new way of working often do not adopt it. The barriers are motivational, structural, and environmental, not informational. They include:
Performance frameworks that still measure old behaviours
Line managers who are themselves uncertain about the change and cannot credibly reinforce it
Peer norms that make the old way of working the default
Practical friction in the new process that makes old habits easier
When managing multiple changes, this assumption is compounded because training resources are frequently the binding constraint. Programmes compete for training developer time, LMS bandwidth, and employee training hours. If training is over-weighted as an adoption lever, the resource allocation is wrong in two ways: too much investment in content development, and not enough in manager enablement, environment redesign, and performance alignment.
Assumption 5: Resistance means the change is wrong
When a change encounters significant resistance, the instinctive response is to investigate what is wrong with the change: Is the design flawed? Is the business case unclear? Are sponsors not visible enough? These are legitimate questions. But in a portfolio context, resistance is frequently not a signal about the specific change. It is a signal about cumulative load.
A team that has been through three restructures and two major system implementations in 18 months may resist a relatively modest change with intensity that is disproportionate to the change’s actual impact on their work. The resistance is real and needs to be addressed, but diagnosing it as a problem specific to the current programme leads to misguided responses: more communication, more engagement sessions, more executive visibility. What the team may actually need is a genuine pause in change load, or meaningful acknowledgement of the cumulative burden they have been carrying.
This distinction matters for how change managers advise programme sponsors. When resistance patterns look inconsistent with the scale of the change, the right question is: what is the change history for this group, and what is the current portfolio load they are carrying?
Assumption 6: The sponsor of each programme is the right governance mechanism
In single-programme change management, executive sponsorship is consistently identified as one of the strongest predictors of change success. The programme sponsor provides visibility, resources, decision-making authority, and legitimacy for the change effort.
In a portfolio context, individual programme sponsorship is necessary but not sufficient. Each programme has a sponsor who is rationally motivated to advocate for their programme’s priority. The result is a governance dynamic where each sponsor argues for their programme to go first, receive the most resource, and face the fewest constraints on timeline. Without a portfolio governance mechanism that can make cross-programme trade-offs, these competing claims default to whoever has the most political capital. This is not portfolio management; it is portfolio politics.
Effective management of multiple changes requires a governance structure that sits above the individual programme sponsor level and has the authority to make sequencing and resource allocation decisions that may disadvantage individual programmes in service of better portfolio outcomes. This structure is often a change portfolio board or a change steering committee with cross-programme scope.
Assumption 7: Progress reporting from multiple programmes gives a complete picture
Most organisations aggregate progress reporting from individual programmes into a portfolio status report: traffic lights, milestone tracking, issue logs. This gives a picture of delivery status. What it does not give is a picture of adoption status across the portfolio, cumulative change load by employee group, or the interaction effects between programmes.
A portfolio where every programme is green from a delivery perspective can still be in serious trouble from a change management perspective, if multiple programmes are delivering simultaneously to the same groups, if adoption rates across programmes are uniformly low, or if change fatigue signals are accumulating in the engagement data.
The Change Compass is designed specifically to provide the portfolio-level view that standard project reporting cannot: cumulative impact by business unit and role group, adoption trend lines across multiple initiatives, and early warning signals when load or adoption patterns indicate portfolio risk. The shift from delivery reporting to adoption intelligence is the most significant operational change in how effective change portfolio management differs from traditional programme reporting.
What managing multiple changes well actually looks like
Effective management of multiple changes is defined less by any single practice and more by a shift in orientation: from programme-centric to portfolio-centric. It asks different questions.
Not “is this programme on track?” but “what is the cumulative change load on the groups this programme targets, and how does this programme’s go-live affect their absorption capacity?”
Not “why is this group resistant?” but “what is the change history and current portfolio load for this group, and is the resistance a programme signal or a portfolio signal?”
Not “how do we communicate this change effectively?” but “how does our communication for this programme fit into the total communications these employees are receiving from all sources this month?”
These questions require portfolio visibility. They cannot be answered with programme-level data. And the answers they generate drive meaningfully better decisions about sequencing, timing, resourcing, and intervention design.
Building that portfolio visibility, through consistent impact methodology, aggregated data across programmes, and regular portfolio governance, is the single most valuable investment that enterprise change functions can make in improving their outcomes from managing multiple changes.
Frequently asked questions
Why is managing multiple changes harder than managing individual changes?
Managing multiple simultaneous changes introduces portfolio-level problems that do not exist at the programme level: change collision (multiple demands landing simultaneously on the same groups), change saturation (cumulative load depleting absorption capacity over time), and cross-programme communication noise. Each of these requires portfolio-level management, not just better single-programme execution.
What is change collision?
Change collision occurs when two or more initiatives simultaneously require significant behavioural or process changes from the same employee group, without coordination of timing or support. The demands compete for attention, reinforce each other’s resistance, and result in lower adoption for both initiatives than would have been achieved if they had been sequenced or staggered.
How do you measure the change load on an employee group?
Change load is measured by aggregating the impact assessments from all active initiatives affecting a specific employee group. This requires a consistent impact taxonomy across programmes so that impact severity can be summed and compared meaningfully. High-load groups are those where the cumulative impact score exceeds historical absorption benchmarks for similar periods of change.
What is the right governance structure for managing multiple changes?
Effective governance requires a cross-programme body, typically a change portfolio board or steering committee, with authority to make sequencing and resource allocation decisions across the portfolio. Individual programme sponsors should sit below this level for portfolio decisions. The portfolio body needs consistent data on cumulative load, adoption status, and portfolio risks to make informed decisions.
How should I prioritise changes in a portfolio?
Prioritisation should be based on three factors: strategic importance (which changes are most critical to the organisation’s strategy), adoption readiness (which employee groups have the capacity and readiness to absorb which changes at this time), and interaction effects (which sequencing minimises collision between high-impact initiatives). Data from a portfolio management platform enables all three factors to be assessed systematically rather than through negotiation alone.
What tools help with managing multiple changes?
Portfolio change management platforms such as The Change Compass aggregate impact data across programmes, visualise cumulative load by business unit and role group, and enable the portfolio governance conversations that managing multiple changes well requires. Without this kind of tooling, portfolio management at scale defaults to manual aggregation and informal coordination, neither of which is reliable at the complexity levels most large organisations face.
References
Gartner. Gartner HR Research Finds Just 32% of Business Leaders Report Achieving Healthy Change Adoption by Employees (2025). https://www.gartner.com/en/newsroom/press-releases/2025-07-08-gartner-hr-research-finds-just-32-percent-of-business-leaders-report-achieving-healthy-change-adoption-by-employees
Smartsheet. 2025 Project and Portfolio Management Priorities Report: Teams Are Fatigued, and Executives Need to Pay Attention. https://www.smartsheet.com/content-center/inside-smartsheet/research/2025-ppm-priorities-report-key-takeaways
WTW. Future-Proofing Work: Key Drivers and Strategies for Work Transformation (2024). https://www.wtwco.com/en-us/insights/2024/09/future-proofing-work-key-drivers-and-strategies-for-work-transformation
Prosci. The Correlation Between Change Management and Project Success. https://www.prosci.com/blog/the-correlation-between-change-management-and-project-success