Organisational change management professionals are increasingly requested to provide measurement, data, and insights to various stakeholder groups. Not only does this include tracking various change management outcomes such as business readiness or adoption, but stakeholder concerns also include such as change saturation and visibility of incoming initiative impacts.
To become better at working with data there is much that change managers can learn best practices from data scientists (without becoming one of course). Let’s explore how change management can benefit from the practices and methodologies employed by data scientists, focusing on time allocation, digital tools, system building, hypothesis-led approaches, and the growing need for data and analytical capabilities.
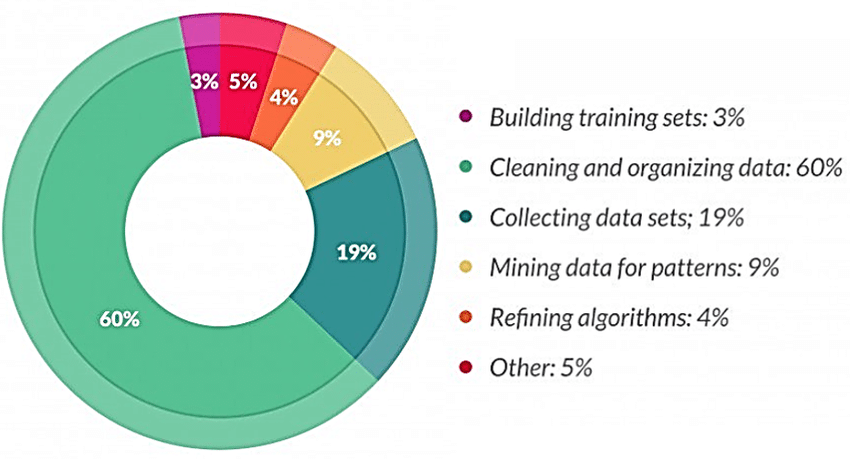
Data scientists spend a substantial portion of their time on data collection and cleansing from data sources. According to industry estimates, about 60-80% of a data scientist’s time is dedicated to these tasks. This meticulous process ensures that the data used for analysis is accurate, complete, and reliable.
In the below diagram from researchgate.net you can see that for data scientists the vast majority of the time is spent on collecting, cleansing and organising data.
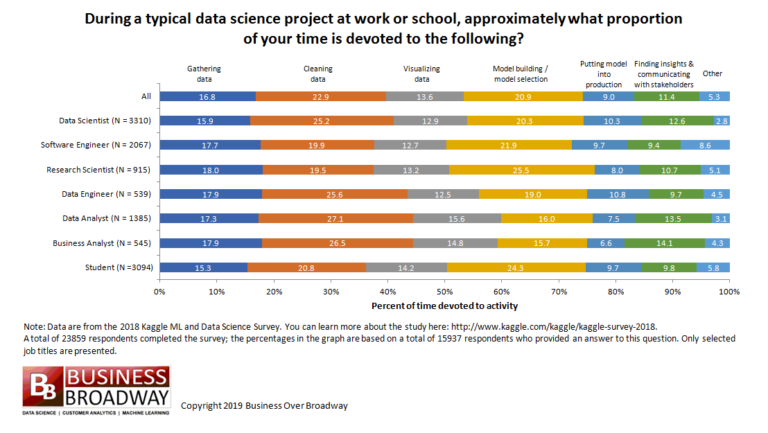
You might say that change managers are not data scientists because the work nature is different, and therefore should not need to carve out time for these activities? Well, it turns out that the type of activities and proportions of time spent is similar across a range of data professionals, including business analysts.
Below is the survey results published by Business Broadway, showing that even business analysts and data analysts spend significant time in data collection, cleansing, and preparation.
Lessons for Change Management
a. Emphasize Data Collection and Cleansing: For change managers, this translates to prioritizing the collection of reliable data related to change initiatives as a part of a structured approach. This might include stakeholder feedback, performance metrics, impact data and other relevant data points. Clean data is essential for accurate analysis and insightful decision-making. Data projects undertaken by change managers are not going to be as large or as complex as data scientists, however the key takeaway is that this part of the work is critical and sufficient time should be allocated and not skipped.
What is data change management and why is it important?
Data change management involves overseeing and controlling changes in data systems to ensure accuracy and consistency. It’s crucial for minimizing errors, maintaining data integrity, and enhancing decision-making processes. Effective management safeguards against potential risks associated with data alterations, ensuring organizations can adapt to shifts in information seamlessly.
b. Allocate Time Wisely: Just as data scientists allocate significant time to data preparation, change managers should also dedicate sufficient time to gathering and cleaning data before diving into analysis. This ensures that the insights derived are based on accurate and reliable information.
It also depends on the data topic and your audience. If you are presenting comparative data, for example, change volume across different business units. You may be able to do spot checks on the data and not verify every data line. However, if you are presenting to operations business units like call centres where they are very sensitive to time and capacity challenges, you may need to go quite granular in terms of exactly what the time impost is across initiatives.
c. Training and Awareness: Ensuring that the change management team understands the importance of data quality and is trained in basic data cleansing techniques can go a long way in improving the overall effectiveness of change initiatives in the desired future state. Think of scheduling regular data sessions/workshops to review and present data observations and findings to enhance the team’s ability to capture accurate data as well as the ability to interpret and apply insights. The more capable the team is in understanding data, the more value they can add to their stakeholders leveraging data insights.
2. Leveraging Digital Tools: Enhancing Efficiency and Accuracy
Data scientists rely on a variety of digital tools to streamline their work. These tools assist in data collection, auditing, visualization, and insight generation. AI and machine learning technologies are increasingly being used to automate and enhance these processes.
Data scientists rely on various programming, machine learning and data visualisation such as SQL, Python, Jupyter, R as well as various charting tools.
a. Adopt Digital Tools: Change managers should leverage digital tools to support each phase of their data work. There are plenty of digital tools out there for various tasks such as surveys, data analysis and reporting tools.
For example, Change Compass has built-in data analysis, data interpretation, data audit, AI and other tools to help streamline and reduce manual efforts across various data work steps. However, once again even with automation and AI the work of data checking and cleansing does not go away. It becomes even more important.
b. Utilize AI and Machine Learning: AI can play a crucial role in automating repetitive tasks, identifying patterns, data outliers, and generating insights. For example, AI-driven analytics tools can help predict potential change saturation, level of employee adoption or identify areas needing additional support during various phases of change initiatives.
With Change Compass for example, AI may be leverage to summarise data, call out key risks, generate data, and forecast future trends.
c. Continuous Learning: Continuous learning is essential for ensuring that change management teams stay adept at handling data and generating valuable insights. With greater stakeholder expectations and demands, regular training sessions on the latest data management practices and techniques can be helpful. These sessions can cover a wide range of topics, including data collection methodologies, data cleansing techniques, data visualisation techniques and the use of AI and machine learning for predictive analytics. By fostering a culture of continuous learning, organizations can ensure that their change management teams remain proficient in leveraging data for driving effective change.
In addition to formal training, creating opportunities for hands-on experience with real-world data can significantly enhance the learning process. For instance, change teams can work on pilot projects where they apply new data analysis techniques to solve specific challenges within the organization. Regular knowledge-sharing sessions, where team members present case studies and share insights from their experiences, can also promote collective learning and continuous improvement.
Furthermore, fostering collaboration between change managers and data scientists or data analysts can provide invaluable mentorship and cross-functional learning opportunities. By investing in continuous learning and development, organizations can build a change management function that is not only skilled in data management but also adept at generating actionable insights that drive successful change initiatives.
3. Building the Right System: Ensuring Sustainable Insight Generation
It is not just about individuals or teams working on data. A robust system is vital for ongoing insight generation. This involves creating processes for data collection, auditing, cleansing, and establishing data governance and governance bodies to manage and report on data.
Governance structures play a vital role in managing and reporting data. Establishing governance bodies ensures that there is accountability and oversight in data management practices. These bodies can develop and enforce data policies, and oversee data quality initiatives. They can also be responsible for supporting the management of a central data repository where all relevant data is stored and managed.
a. Establish Clear Processes: Develop and document processes for collecting and managing data related to change initiatives and document any new processes. This ensures consistency and reliability in data handling. There should also be effective communication of these processes using designated communication channels to ensure smooth transition and adherence.
b. Implement Governance Structures: Set up governance bodies to oversee data governance practices as a part of data governance efforts. This includes ensuring compliance with data privacy regulations and maintaining data integrity. The governance can sponsor the investment and usage of the change data platform. This repository should be accessible to stakeholders involved in the change management process, promoting transparency and collaboration. Note that a governance group can simply be a leadership team regular team meeting and does not need to be necessarily creating a special committee. Data governance group members (potentially representative business owners) foster a sense of ownership and can be empowered to resolve potential issues with data and usage. Key performance indicators and key change indicators may be setup as goals.
c. Invest in system Infrastructure: Build the necessary system infrastructure to support data management and analysis that is easy to use and provides the features to support insight generation and application for the change team.
Data scientists and data teams often use a hypothesis-led approach, where they test, reject, or confirm hypotheses using data. This method goes beyond simply reporting what the data shows to understanding the underlying causes and implications.
a. Define Hypotheses: Before analyzing data, clearly define the hypotheses you want to test. For instance, if there is a hypothesis that there is a risk of too much change in Department A, specify the data needed to test this hypothesis.
b. Use Data to Confirm or Reject Hypotheses: Collect and analyze data to confirm or reject your hypotheses. This approach helps in making informed decisions rather than relying on assumptions or certain stakeholder opinions.
c. Focus on Actionable Insights: Hypothesis-led analysis often leads to more actionable insights. It is also easier to use this approach to dispel any myths of false perceptions.
For example: Resolving Lack of Adoption
Hypothesis: The lack of adoption of a new software tool in the organization is due to insufficient coaching and support for employees.
Data Collection:
Gather data on the presence of managerial coaching and perceived quality. Also gather data on post go live user support.
Collect feedback from employees through surveys regarding the adequacy and clarity of coaching and support.
Analyse usage data of the new software to identify adoption rates across different departments.
Analysis:
Compare adoption rates between employees who received sufficient coaching and support versus those who did not.
Correlate feedback scores on training effectiveness with usage data to see if those who found the training useful are more likely to adopt the tool.
Segment data by department to identify if certain teams have lower adoption rates and investigate their specific training experiences.
Actionable Insights:
If data shows a positive correlation between coaching and support, and software adoption, this supports the hypothesis that enhancing coaching and support programs can improve adoption rates.
If certain departments show lower adoption despite completing coaching sessions, investigate further into department-specific issues such as workload or differing processes that may affect adoption.
Implement targeted interventions such as additional training sessions, one-on-one support, or improved training materials for departments with low adoption rates.
5. Building Data and Analytical Capabilities: A Core Need for Change Management
As data and analytical capabilities become increasingly crucial, change management functions must build the necessary people and process capabilities to leverage data-based insights effectively.
a. Invest in Training: Equip change management teams with the skills needed to manage data and generate insights. This includes training in data analysis, visualization, and interpretation.
b. Foster a Data-Driven Culture: A lot of organisations are already on the bandwagon to encourage a culture where data is valued and used for decision-making from current state to future state. The change process needs to promote this equally within the change management function. This involves promoting the use of data in everyday tasks and ensuring that all team members understand its importance. Think of incorporating data-led discussions into routine meeting meetings.
c. Develop Analytical Frameworks: Create frameworks and methodologies for analyzing change management data. This includes defining common key metrics, setting benchmarks, and establishing protocols for data collection and analysis for change data. Data and visual templates may be easier to follow for those with lower capabilities in data analytics.
Practical Steps to Implement Data-Driven Change Management
To integrate these lessons effectively, senior change practitioners can follow these practical steps:
Develop a Data Strategy: Create a comprehensive data strategy that outlines the processes, tools, and governance structures needed to manage change management data effectively.
Conduct a Data Audit: Begin by auditing the existing data related to change management. Identify gaps and areas for improvement.
Adopt a Hypothesis-Led Approach: Encourage the use of hypothesis-led approaches to move beyond descriptive analytics and derive more meaningful insights.
Invest in Technology: Invest in the necessary digital tools and technologies to support data collection, cleansing, visualization, and analysis.
Train the Team: Provide training and development opportunities for the change management team to build their data and analytical capabilities.
Collaborate Across Functions: Foster collaboration between change management and data science teams to leverage their expertise and insights.
Implement Governance Structures: Establish governance bodies to oversee data management practices and ensure compliance with regulations and standards.
By learning from the practices and methodologies of data scientists, change management functions can significantly enhance their effectiveness. Prioritizing data collection and cleansing, leveraging digital tools, building robust systems, adopting hypothesis-led approaches, and developing data and analytical capabilities are key strategies that change management teams can implement. By doing so, they can ensure that their change initiatives are data-driven, insightful, and impactful, ultimately leading to better business outcomes.
There is now plenty of research and articles on successful organizational change management out there. However, most of these are focused on driving a singular change process impacting a set of key stakeholders with one change management plan. The single change may be the launch of a new product, digital transformation, a radical change that impacts the company culture, changes to internal processes, a change in the company’s strategic goals, or some kind of organizational transformation that breaks from the status quo, or examples of transformational change that lead to clear success. How many organisations can you think of that are just driving one singular change initiative across the entire organisation? Exactly.
Particularly when an organization is adopting agile ways of working, managing multiple change initiatives becomes even more critical. If everyone is working towards one big initiative launch it is much easier to plan for. It is more complex with lots of initiatives all launching a series of changes throughout the year. However, in agile organisations this is the norm. Managing the impact of changes on the frontline, in this case, becomes more complex with significant coordination and planning involved.
To effectively manage multiple change initiatives one needs to establish the following:
To manage multiple change initiatives one needs to be able to see what is changing. This sounds simple but yet one of the hardest things to accomplish for large organisations where there are often more than a hundred or hundreds of change initiatives at any one time. This is not about individual project management. To achieve this, one needs to be able to capture the data on the change impacts and how they impact different parts of the organization. This can then be used to better plan for initiatives as a part of the strategic plan.
Most organisations still struggle with spreadsheets to try and create some view of what is changing, however still not able to effectively capture the totality of what is changing since this involves a view of not just projects, but also BAU (business as usual) initiatives. To move with the times, organisations need to be able to leverage digital means of understanding what is changing, how they impact stakeholders and team members, and what this means from a planning perspective.
Effective organisational change governance and decision making
Most organisations are good at ensuring that there is a structured way of allocating the dollars to the right priorities when it comes to funding projects. However, the same may not be said for effective governance in orchestrating and planning for how change initiatives are implemented and embedded into BAU, particularly with regards to business processes. This is often not a part of the company’s culture and a part of the change management process.
An effective operations governance process is required, leveraging from a clear view of the totality of what is changing, and through this effective sequence, package, integrate or prioritise the change impacts on the organization. This includes tracking key performance indicators of the changes and ensure the entire team understands how this is tracked and reported to drive the success of change initiatives. Strong organisational leadership from the senior executives and effective communication is required to drive full adoption.
The governance body needs to be able to establish clear decision-making and escalation processes and articulate this to initiative drivers.
Oversight of Change Initiatives: Strategies for Successful Change
With significant changes happening concurrently, it is a top priority for change managers to establish clear and scalable business engagement channels as a part of the change management strategy to ensure that stakeholder groups feel like they are a part of designing the changes (vs. being a victim of them). This includes regular business forums such as weekly, monthly or quarterly meetings and standups. Other communication channels would also include intranet, email, Yammer or audio-visual outlets.
It is through well-oiled engagement channels across the entire organization that initiative owners and business leaders can quickly and frequently implement changes rapidly and concurrently. This will thereby increase the chances of success for change.
To read more about managing multiple initiatives check out our Knowledge section under Portfolio Management where we have a range of practical articles.
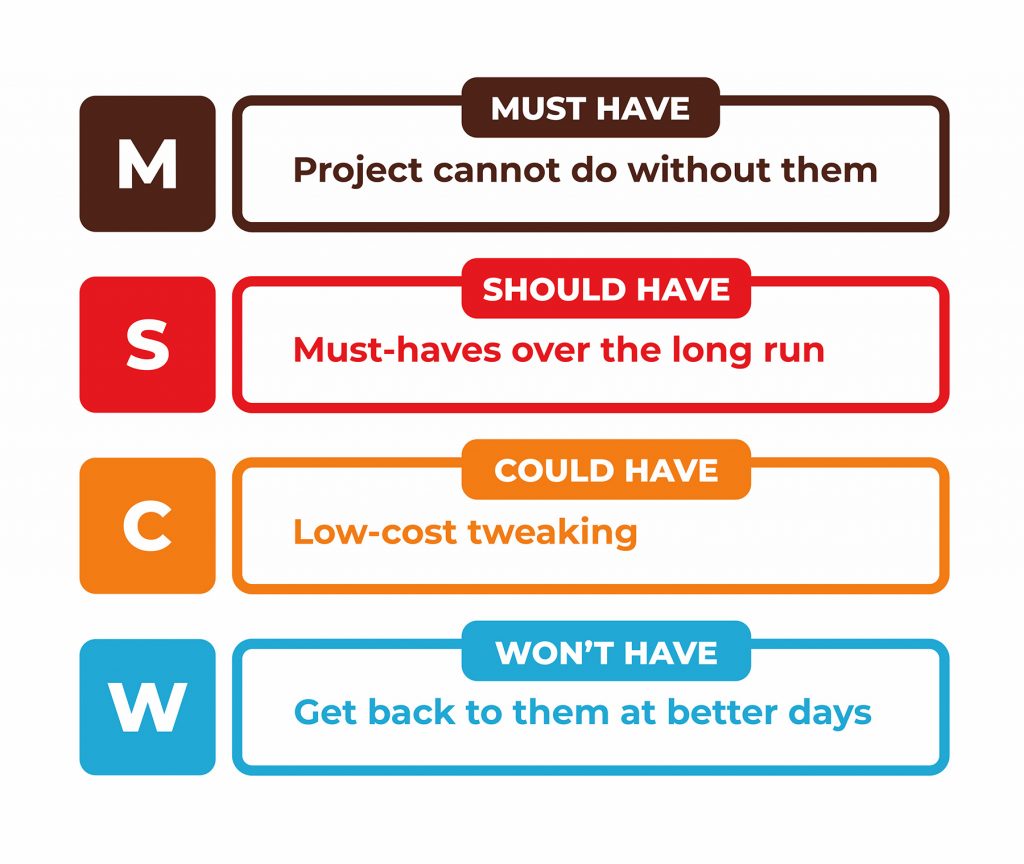
The MoSCoW method of prioritization is well used by Business Analysts, Project Managers, and Software Developers in software development. The focus is on identifying and agreeing with key stakeholders what are the core levels of requirements that should be focused on more than others. This process of prioritization is a great way to enable a better outcome in focusing the efforts of the team on the most important aspects of the solution given limited time and cost. Let’s take a closer look.
The MoSCoW prioritization technique is well used by Business Analysts, Project Managers and Software Developers and particularly relevant in agile project management. The focus is on identifying and agreeing with key stakeholders what are the core levels of requirements that should be focused on more than others. This process of prioritization will then enable a better outcome in focusing the efforts of the team on the most important aspects of the solution given limited time and cost.
MoSCoW stands for: Must Have, Should Have, and Could Have.
There is significant opportunity for change practitioners to also adopt this technique to better prioritise a range of different change interventions. Too often, change activities are planned as a result of stakeholder requests, and not necessarily as a result of a prioritized approach of what approaches/activities provides the best outcome versus others.
1. Must Haves:
These are core, fundamental project requirements that must be there for the end outcome to be there. These are the non-negotiable ones defined at the startup of the project without which the goals of the project cannot be achieved.
For example, in implementing a new system, the users must know that the system is going to replace the previous system and the reason for this. Users must also know how to operate the new system prior to the older system being switched off.
2. Should Haves:
These are features or requirements that would have a high priority to reach the project outcome within the product development process. These can often be core features that will add metrics to the user/customer experience. However, they are not a must, and given challenges in time or cost they can be deprioritized.
For example, for a new system implementation it would be highly desirable to allow the users to access a sandbox to be able to play with the features prior to the launch to improve their readiness. It could also be that due to the large number of users using the system it makes sense to conduct a large scale awareness campaign to broadcast the arrival of the new system. Core user experience requirements and basic navigation functionalities may be a part of this category, as a part of the minimum viable product (MVP).
3. Could Haves:
These are nice to haves given sufficient resources such as time and cost. These requirements are definitely not critical and can easily be deprioritized as needed.
For example, in implementing the new system it may be nice to have coaching workshops with users prior to the go-live to offer additional learning support for those who may need more help. It could also be various system support materials such as cheat sheets, booklets, etc. to help the user embed the ins and outs of using the new system.
4. Won’t Haves (or Would Haves):
These are potential features or requirements that may be looked at in the future if there is sufficient resources available. This is the lowest in the order of priority, meaning that it will not make significant impact to the outcome of the project.
For example, in implementing the new system refresh training sessions could be offered later down the line for some users after go live. Depending on the organization and previous experiences an ‘embedment campaign’ could also be scheduled to drive continual usage of the system. But given the cost required these are deemed lowest in the priority.
In prioritizing change management approaches and interventions this way, we are adopting a structured method of determining the activities we are investing in to get the right outcome. The clarity of which interventions are core and foundational, versus others that are desirable or nice to haves is important to the success of the initiative. This could also avoid any disagreements or questioning of the change approach further down the line as the approach follows a structured and agreed process with stakeholders.
In today’s dynamic business environment, marked by ongoing disruptions like environmental challenges, economic shifts, and the rapid advancement of AI tools, the pace of change demands that organizational agility and change readiness become critical capabilities for sustained competitive advantage and success. As businesses strive to remain competitive and responsive to ever-changing conditions, change practitioners play a pivotal role in designing and incorporating agility into their change planning and implementation efforts.
This article explores the importance of agility in creating an agile organization through effective organizational change management, drawing on research from industry experts such as McKinsey, and offers valuable insights for change practitioners to foster agility in their projects while building a change-ready workforce and navigating unpredictable business decisions, stakeholders, and environments.
The Significance of Agility in Change Management:
Agility has emerged as a key attribute for organizations seeking to thrive amidst disruption. McKinsey’s research on enterprise agility highlights the positive business impact achieved by companies that effectively embrace agility. These organizations demonstrate higher customer satisfaction, increased revenue growth, and improved employee engagement. By incorporating agility into their change initiatives, organizations can respond swiftly to market changes, capitalize on emerging opportunities, and mitigate risks more effectively.
Specifically, what this means is that imagine you are in a program of 5 projects over 2 years. All projects are working with a range of stakeholders within 2 divisions. There can be significant influence that your program can have on the work practices of these 2 divisions over a 2 year period. Now imagine incorporating agile practices in how you implement change. You now have the ability to really shift the dial for these work functions.
Designing Agile Change Management Strategies:
Change practitioners working on individual projects play a vital role in fostering agility within their organizations. To design and incorporate agility into change planning and implementation, practitioners should consider the following strategies:
Embrace iterative approaches: This may sound like a no-brainer, but definitely start by incorporating agile principles into your project planning and delivery. By breaking down change initiatives into smaller, manageable increments, practitioners can iterate and adjust their strategies based on real-time feedback and evolving stakeholder needs. Not a lot of change practitioners do this well. A lot still follow the standard plan and execute approach without a lot of iteration and pivoting of tactics and approaches.
Foster a culture of experimentation: Encourage stakeholders and team members to experiment with new ideas and solutions. Create a safe environment where psychological safety is prioritized, and setbacks are seen as learning opportunities, enabling continuous improvement and challenging the status quo of innovation. You may or may not have the luxury of being a part of a project team that promotes this environment. However, you can proactively set the expectation with your stakeholders and explain why this is valuable to help deliver a better change outcome.
Encourage collaboration and cross-functional teamwork: Establish channels for open communication, collaboration, and knowledge sharing. Cross-functional teams can contribute diverse perspectives and expertise, enabling quicker decision-making and adaptability. This may sound like a generic corporate speak … team work and collaboration. However, you can easily design cross-functional teams, work processes and decision making forums to encourage this. The connection and collaboration across teams helps them to be more agile to understand different business forces and perspectives, avoiding ‘insular thinking’.
Prioritize flexibility and adaptability: Recognize that change plans may need to be adjusted or revised as circumstances evolve. Build flexibility into the change management process, allowing for agility in response to unexpected challenges or opportunities. In every project, there are aspects that are different from other projects, even if you are involving the same stakeholders. Designing chuncked-down, flexible modules of change helps you to be more agile.
Remaining Agile as a Change Practitioner:
Change practitioners themselves must also cultivate transparency and agility to navigate the dynamic nature of their projects. Here are some key strategies for remaining agile:
Embrace a growth mindset in your change approach: Adopt a mindset that values continuous learning, adaptability, and continuous improvement. Embrace new change tactics, methodologies, technologies, and tools that enhance your change management capabilities. Try new digital or automation solutions.
Develop strong relationship-building skills: Cultivate effective relationships with stakeholders and maintain open lines of communication. Building trust and rapport enables better collaboration and facilitates agility in responding to shifting stakeholder needs. By doing this, you can have much more influence on your stakeholders.
Stay informed and anticipate change: Continuously monitor industry trends, technological advancements, and organizational dynamics. Anticipate potential disruptions and proactively adjust your change plans to accommodate evolving circumstances. This requires strong business acumen.
Foster personal resilience: Change management can be challenging, particularly when faced with unexpected changes. Develop personal resilience by cultivating emotional intelligence, stress management techniques, and the ability to adapt to new circumstances. To lead and influence your stakeholders you need to be their anchor.
In an era of ongoing disruptions and environmental challenges, agility has emerged as a crucial capability for organizations embarking on change initiatives. Change practitioners play a pivotal role in designing and incorporating agility into their change planning and implementation efforts.
By embracing iterative approaches, fostering a culture of experimentation, encouraging collaboration, and prioritizing flexibility, change practitioners can drive agility within their organizations. Additionally, by developing a growth mindset, nurturing strong relationships, staying informed, and fostering personal resilience, change practitioners can remain agile in the face of evolving business decisions, stakeholders, and environments. Embracing agility in change management is key to successfully navigating the ever-changing landscape of the digital world.
Change is an inevitable part of, not just corporate life and business processes, but life in general. It’s a natural occurrence that we all must face at some point. But despite the many benefits that organizational change can bring, many of us are still reluctant to embrace it. After all, for many, it is easier to keep doing the same thing than to do something different and unknown. With the unknown comes risks of disruption and a desire for consistency. Risks that may be scary. Risks that things may be worse than the current scenario.
Often resistance to change can be thought of as an outcome of bad change management. If you don’t effectively manage your stakeholders or have not effectively assessed the impact of change, there are likely going to be common reasons for root causes of resistance for change resistance, including a lack of confidence among stakeholders. Resistance may arise from bad change interventions, including ineffective consultation or engagement of stakeholders.
However, sometimes despite everything you’ve done. You’ve ticked every box and followed almost a ‘textbook’ approach to the change process. Despite this, you are still getting change resistance from some stakeholder groups. Why is this happening?
Sometimes there may be very few levers you can pull in preventing the resistance. You’ve gotten your leadership cohorts to reinforce and evangelize the purpose and benefits of the change. You’ve tried all you can to reach the hearts not just the minds of what you think impacted employees want to hear.
Why is this happening? It could be the fear of failure or loss aversion that has led to the resistance. This is the research-backed fact that people tend to have a cognitive bias where the pain of losing is much stronger than the pleasure of gaining.
One example of this phenomenon is why people stay in bad marriages. Despite the obvious benefits of leaving an unhappy marriage, many people still choose to stay in it. This is because they fear the loss of familiarity, comfort, and security that their marriage provides. This is despite how unhappy they honestly are in the marriage. They may also be afraid of the unknown or the changes that come with divorce. These same fears and reluctance to change can also be seen in organizations and their team members facing change.
For something less dramatic, another example could be changing phones. We are wedded to our phones for a big chunk of how we run our lives. Changing a phone operating system, brand, or even model can be a quite a change that a lot of people are not inclined to go through, until they are pushed to do it.
When organizations decide to implement successful changes, they often focus on the potential benefits that will come from the change, including the introduction of a new product line. They may present a logical argument for why the change is necessary and how it will benefit everyone involved. However, even with a clear and logical argument, people may still be reluctant to embrace change. This is because change often means loss, even if it is the loss of something negative or unwanted.
For example, if an organization decides to implement new software, employee resistance may occur even if it will make their jobs easier and more efficient. This is because they are comfortable with the current system, and they fear the unknown as a significant cause of resistance, or the potential loss of job security and skills that they have developed with the current system. They may also fear that the new system will require them to learn new skills or take on new responsibilities, stemming from their fear of the unknown. This can be despite your best efforts to create a positive picture of the end state.
There are still lots of examples in organisations where employees prefer to stick to their current manual ways of work using spreadsheets, versus the more efficient and effective digital tools.
They may have created the spreadsheet themselves. They may have spent months building consensus across the organisation to use this process. Changing this process could mean not only a lack of familiarity, but it could also result in a loss of their ‘importance’ of their role. So as a result, people continue to maintain the status quo. Stay within the comfort zone. After all, if they don’t change, they can’t be ‘blamed’ if something goes wrong.
As change practitioners, we cannot just blame those impacted by the change. We may also need to see if this applies to us. For example, a lot of change practitioners still use manual spreadsheets to create a ‘single view of change’ despite the amount of manual work that is required. They may have faced leaders who question the integrity of the rating system or become ‘bored’ with the same heatmap or chart since they can’t use it to make black-and-white business decisions. But, fear of the unfamiliarity dominates.
Organizations need to recognize this fear of loss and work to address it in line with their organizational goals, as clarity is essential in managing change. Here are some practical suggestions for designing change initiatives that can help tackle this barrier:
1. Look at the data about how your target employees have responded to different types of changes in the past. What types of responses were there with a certain type or volume of change? How were these dealt with? What were the outcomes? What types of employees were more ‘resistant’ than others?
2. Communicate Clearly, Early and Transparently: Slow change adopters may need more time to prepare for change and what it means for them. Involving key stakeholders as part of the communication process can clarify available options if they do not like the end state. What if they disagree? Communication should be clear, transparent, and empathetic. It should focus on the benefits of the change, and address any concerns or fears employees may have. It should also focus on what would happen if the changes are not adopted.
3. Involve employees in the Change Process (where it makes sense): Inviting employees to participate in the change process can help them feel more invested in the change and less fearful of losing control. When employees have a voice in the decision-making process, they are more likely to feel valued and respected. This also allows businesses to identify potential challenges and concerns that employees may have, which can be addressed before the change is implemented. In addition, setting key metrics can help in evaluating the effectiveness of this approach. This approach may need to be applied carefully, especially when dealing with a highly resistant group of employees. If not carefully managed, the change approach may get out of control.
4. Provide Support: Change can be overwhelming and stressful, especially when employees feel like they are not equipped to handle it. Providing support and training can help employees feel more confident and prepared for the change effort. It can also help them see the benefits of the change more clearly. This may sound like common sense. But it’s amazing how many change initiatives don’t provide any support to impacted groups, beyond technical support.
5. Celebrate Successes: Change can be a long and difficult process, so it is essential to celebrate successes in a timely manner along the way. Recognizing and acknowledging employee efforts and successes can help maintain momentum and motivation. This is another seemingly ‘no-brainer’. Designing a series of successes helps create positivity.
6. Be Patient: Change takes time, and employees need time to adjust. It is essential to be patient and understanding. Rushing the process or ignoring employees’ concerns can lead to resistance and resentment. In your change readiness assessment or strategic plan during the baselining phase of the project, if you’ve found that change adoption could be slow and resistance could be expected, ensure you’ve factored in sufficient timing.
Change is difficult, even when it makes logical sense and has many benefits. People are often afraid of losing something, even if it is something negative or unwanted, which can lead to discomfort. Organizations need to recognize this fear of loss and work to address it when implementing changes. Recognising this cognitive bias is the first step. By providing support, and resources, and involving employees in the change process, organizations can help reduce the fear of loss and successfully implement change.