Every lawyer I have engaged over the course of my career has done the same disconcerting thing in the first meeting: they refused to accept my version of the problem. I would arrive with a situation already framed, a conclusion half-formed, and a preferred outcome. They would put all of that to one side and start somewhere much slower. What exactly is the question here? What are its parts? What does the evidence actually say about each part, one piece at a time, before we decide anything?
That habit used to frustrate me. Now I think it is the single most transferable skill I have watched a professional practise, and it is the one change and transformation practitioners most need to borrow. This article is for change managers, transformation leads and the executives who sponsor them. The argument is simple: lawyers are trained to decompose a complex problem into its elements and test each element against the evidence, and change practitioners can apply that same discipline far more widely than they currently do. By the end you will have a diagnostic method you can use across the change lifecycle, and a clear view of where artificial intelligence genuinely helps you apply it. Analytical thinking is now the skill employers rank above almost every other, and change work is overdue a more rigorous relationship with it.
Why analytical rigour is suddenly the skill that matters
The timing is not incidental. In its Future of Jobs Report 2025, the World Economic Forum found analytical thinking to be the most sought-after core skill among employers worldwide, with roughly seven in ten companies treating it as essential. Independent coverage of the same research confirmed that analytical thinking again topped the list ahead of resilience, flexibility and leadership.
For a profession that has spent two decades defending its value, this should land as good news and as a warning. Change management has always claimed to be evidence-led. In practice, a lot of change work still runs on assertion: a readiness rating that reflects the mood in the room, a stakeholder plan built from an org chart rather than from data, an intervention chosen because it worked somewhere else. As generative tools make it trivial to produce confident-looking change artefacts at speed, the differentiator stops being production and becomes judgement. The practitioner who can take a messy transformation problem apart and reason about it cleanly will be worth far more than the one who can generate a plausible plan in thirty seconds. That analytical capability sits alongside the other under-discussed skills we have written about in the change management skill set for the AI era.
How a lawyer takes a problem apart
Watch a good litigator work and you see a repeatable method, not improvisation. Law schools teach a version of it under the acronym IRAC: Issue, Rule, Application, Conclusion. The American Bar Association describes IRAC as the structure that underpins nearly all legal analysis, and its logic maps almost perfectly onto change diagnosis. Three moves inside it are worth stealing outright.
Define the actual problem, not the presenting one
The first thing a lawyer does is resist the framing you hand them. The client who says “I have a contract problem” might actually have an evidence problem, or a jurisdiction problem, or no viable claim at all. Precision about the real question comes before any analysis, because the wrong question produces a confidently wrong answer.
Change practitioners skip this more often than they admit. A sponsor says “we have an adoption problem” and the team leaps to training and communications. But low adoption might be a capability problem, a workload problem, a conflicting-incentives problem, or a symptom of three other initiatives hitting the same team in the same month. Naming the wrong problem wastes the entire intervention. McKinsey’s long-running research on transformation found that fewer than one in three transformations succeed at both improving performance and sustaining it, and a recurring cause is effort aimed at the wrong target: activity mistaken for outcome, symptoms mistaken for causes.
Break the question into its elements
Once the issue is defined, a lawyer decomposes it into the elements that must each be satisfied. To prove negligence you need duty, breach, causation and damage. Each is a separate sub-question with its own evidentiary test. You cannot wave at the whole and declare it proven; you work element by element.
This is the move change work borrows least often outside of impact assessment. “Is this organisation ready?” is not one question. It is a bundle: does leadership visibly sponsor the change, do affected teams have the capacity to absorb it on top of everything else, do people have the capability, is the operating environment stable enough, are the incentives aligned? Treated as a single gut-feel rating, readiness tells you almost nothing. Decomposed into elements, each with its own evidence, it becomes a diagnosis you can act on.
Test each element against the evidence, one piece at a time
The part I find most instructive is the pace. A lawyer does not evaluate all the evidence at once and form an impression. They take each element and ask what the documents, the timeline and the testimony actually establish about that specific point, considering the contrary reading before settling. Weak evidence on one element is not averaged away by strong evidence on another. It is flagged as the exposure it is.
Change diagnosis tends to do the opposite. We blend everything into a single traffic-light status and lose the detail that mattered. A whole initiative rated amber hides the fact that one business unit is deep red and another is green. Rigour means resisting the premature average and looking at the evidence for each element on its own terms.
Where change practitioners already reason like this
To be fair to the profession, there is one area where change managers already apply genuine analytical discipline: the change impact assessment. Done properly, an impact assessment is exactly the lawyer’s method in disguise. You take a change, break it into the specific shifts it imposes (process, system, role, structure, behaviour), and assess each against the affected groups. You do not declare “this is a big change” and move on; you itemise what changes for whom.
That itemising instinct is the strength to build on. If you can decompose a change into its impacts, you already have the muscle to decompose readiness, stakeholder engagement, intervention choice and adoption the same way. The tragedy is that the rigour usually stops once the impact assessment is filed. The rest of the lifecycle reverts to intuition. Our guide to conducting a change readiness assessment with data rather than surveys alone is really an argument for extending the impact-assessment discipline into the readiness question.
Where the rigour runs out, and how to restore it
Here is where I want to be specific, because “be more analytical” is useless advice on its own. There are four diagnostic decisions across the change lifecycle where practitioners routinely substitute assertion for evidence, and each can be rebuilt element by element.
Change readiness. Instead of a single readiness score, break it into sponsorship, capacity, capability, environment and incentives. Attach evidence to each: sponsorship measured by leaders’ visible actions and diary time, not their stated commitment; capacity measured by how much other change the same people are already carrying.
Stakeholder engagement. Instead of an influence-interest grid drawn from memory, decompose engagement into who is actually affected, how heavily, when, and whether their behaviour is shifting. An org chart tells you who exists. It does not tell you who is overloaded or disengaging.
Intervention choice. Instead of reaching for the familiar training-and-comms package, ask which specific element of the problem each intervention addresses, and what evidence says it will move that element. A communication campaign does not fix a capacity problem.
Measuring success and adoption. Instead of declaring victory at go-live, define in advance what evidence would show the change has actually been adopted and sustained, and track it. Organisations that tracked defined metrics through implementation succeeded far more often than those that did not.
The unifying idea is that each of these is a bundle of elements masquerading as a single judgement. Pull them apart, demand evidence for each, and refuse the premature average.
The premature average is the enemy
If there is one anti-pattern to name, it is the single blended rating. A lawyer would never tell a court “the case is roughly 70 per cent strong”. They would say the duty element is clearly met, breach is contested, and causation is the exposure. Change reporting is full of roughly-70-per-cent statements: one amber dot for an initiative that is thriving in one division and failing in another, one readiness percentage that averages a committed executive with an exhausted frontline. The average feels responsible. It is actually where the signal goes to die.
Consider the contrary reading
The other habit worth importing is the lawyer’s discipline of arguing the other side. Before concluding, they test how the evidence reads against them. Change teams, invested in the change succeeding, rarely do this. Ask deliberately: what would I expect to see if this initiative were in trouble, and do I see it? Framing the disconfirming question is how you catch the missed impact before it lands, which is the whole premise behind detecting change conflicts across initiatives before they derail delivery.
A worked example: The adoption problem that was not
A few years ago I watched a transformation team wrestle with what everyone called an adoption problem. A new system had gone live across a large operations function, usage was well below target, and the reflex was predictable: more training, more communications, a fresh round of floor-walking. The presenting problem had been accepted whole, and the intervention followed automatically from it.
Run the lawyer’s method over the same facts and it comes apart. State the real question: not “how do we lift adoption” but “why are trained, informed people not using the system”. Decompose it: is it a capability gap, a workload gap, an incentive conflict, or a design issue in the system itself? Attach evidence to each, separately. Training completion was high, which weakened the capability explanation. Usage was lowest precisely in the teams carrying two other major changes that quarter, which pointed hard at capacity. And the frontline consistently reported that the new workflow took longer than the one it replaced, which is an incentive-and-design problem no communications campaign can touch.
The disconfirming question sealed it: if this were genuinely a training-and-awareness problem, usage would be uniformly low, but it was not, it tracked capacity almost exactly. The diagnosis was never adoption in the abstract. It was that overloaded teams were rationally protecting their time from a tool that cost them more than it gave. The evidence had been available the whole time. What was missing was the discipline to look at it element by element instead of averaging it into a single red number and reaching for the usual response.
A diagnostic method you can use today
Pulling this together, here is a five-step routine you can run on any change decision, borrowed wholesale from how a lawyer approaches a brief.
State the real question in one sentence. Not the presenting complaint. The actual decision you are trying to make. Write it down and pressure-test it before going further.
Decompose it into elements. List the specific sub-questions that must each be answered for the whole to hold. Readiness becomes five elements; adoption becomes a set of observable behaviours.
Attach evidence to each element separately. For every element, note what evidence you have, how strong it is, and where it is thin. Resist blending.
Argue the contrary case. For your emerging conclusion, ask what you would expect to see if you were wrong, and check whether you see it.
Conclude at the element level, then aggregate transparently. State which elements are solid and which are exposures, and only then form an overall view, keeping the weak elements visible rather than averaged away.
None of this requires a law degree. It requires the willingness to slow down at the point where change work usually speeds up, and to treat a diagnosis as something you build from evidence rather than something you assert from experience.
What AI changes: Rigour at a scale a human cannot reach
There is a natural objection to everything above: this level of rigour is expensive. Decomposing every decision into elements and hunting evidence for each is exactly the painstaking work a busy practitioner does not have time for. This is where the current wave of technology earns its place, and it is worth being precise about what it actually does rather than gesturing at “AI”.
The value is not that a model can write a readiness report. It is that a system holding your organisation’s own change history can do three things a human analyst cannot do at scale. It can draw on the historical record, showing how similar changes actually played out for similar teams in your organisation, so a readiness judgement rests on precedent rather than optimism. It can benchmark against what has worked and what has not, so an intervention is chosen against evidence of effectiveness rather than habit. And it can aggregate evidence across an entire portfolio continuously, surfacing the overloaded team or the colliding initiatives that no manual process would catch in time.
This mirrors legal practice more than it might seem. Precedent is the lawyer’s benchmark data. A litigator reasons from what courts have actually done in comparable cases, not from first principles each time. A change intelligence system gives practitioners their own version of precedent: a searchable, structured record of how change has landed before. The rigour is still yours. The technology removes the excuse that there was no time to be rigorous. It is also why generic tools fall short here: a model with no access to your organisation’s structured change data has no precedent to reason from, a point we have made at length about why generic AI cannot substitute for a purpose-built change intelligence platform.
Where a change intelligence platform fits
This is the problem Change Compass exists to solve. As a change intelligence platform, it holds the structured record of change across an organisation and shows both sides of the equation: your teams’ capacity to deliver change, and the business’s capacity to receive it. That two-sided view is exactly the decomposition this article argues for, made continuous and visible rather than assembled by hand for a single assessment. It lets a practitioner reason from evidence about readiness, collisions, engagement and adoption across the whole portfolio, and translate that evidence into terms an executive will act on. The discipline is the lawyer’s; the platform is what makes it sustainable at enterprise scale.
Where to start
If you take one thing from how lawyers work, make it this: never accept the problem as it was handed to you, and never let a single rating stand in for evidence you have not examined. Pick the next significant change decision on your desk, whatever it is, and run the five-step routine on it before you act. State the real question. Break it into elements. Find the evidence for each, separately. Argue the other side. Conclude transparently, with the exposures still showing. It will feel slower the first time and faster every time after, because you will stop solving the wrong problem. Analytical thinking is the skill the market is now paying for, and change is the domain that stands to gain the most from practising it properly.
Frequently asked questions
What are analytical skills in change management?
Analytical skills in change management are the ability to break a complex change problem into its component parts, attach evidence to each part, and reason to a conclusion rather than assert one. In practice this means decomposing questions like readiness or adoption into specific, evidenced elements instead of relying on a single intuitive rating.
Why is analytical thinking considered a critical skill for change practitioners?
The World Economic Forum’s Future of Jobs Report 2025 ranks analytical thinking as the most sought-after core skill among employers globally. As AI makes it easy to produce change artefacts quickly, the differentiating skill shifts from producing plans to judging them, which depends on rigorous analysis.
How can change managers apply legal reasoning to their work?
Borrow the lawyer’s sequence: define the real question precisely, decompose it into elements that each need to be satisfied, test each element against the evidence one at a time, argue the contrary case, and conclude at the element level before aggregating. This applies to readiness, stakeholder engagement, intervention choice and adoption, not just impact assessment.
Does AI replace analytical skills in change management?
No. AI removes the time constraint that stops practitioners being rigorous, by drawing on an organisation’s historical change records and benchmark data at a scale no individual could manage. The judgement about what the evidence means remains human. Generic AI without access to your organisation’s own change data has no precedent to reason from.
What is the most common analytical mistake in change diagnosis?
The premature average: collapsing many distinct elements into a single blended status, such as one amber rating for an initiative thriving in one division and failing in another. It feels responsible but hides the exact signal that matters. Rigorous diagnosis keeps the weak elements visible rather than averaging them away.
References
World Economic Forum, The Future of Jobs Report 2025: analytical thinking ranked the most sought-after core skill, essential for roughly seven in ten employers.
Most change teams are about to get very good at producing work that is confidently wrong. Generative AI can now draft a stakeholder impact assessment, a comms plan, or a readiness narrative in minutes, and the output looks polished enough to send. But polish is not correctness. An AI-drafted impact assessment can merge two stakeholder groups that experience a change very differently, understate the load on a team already carrying two other go-lives, and invent a training assumption no one ever agreed, all inside fluent prose that signals “this is fine”. Catching that takes a specific set of skills, and they are not the ones most teams are building.
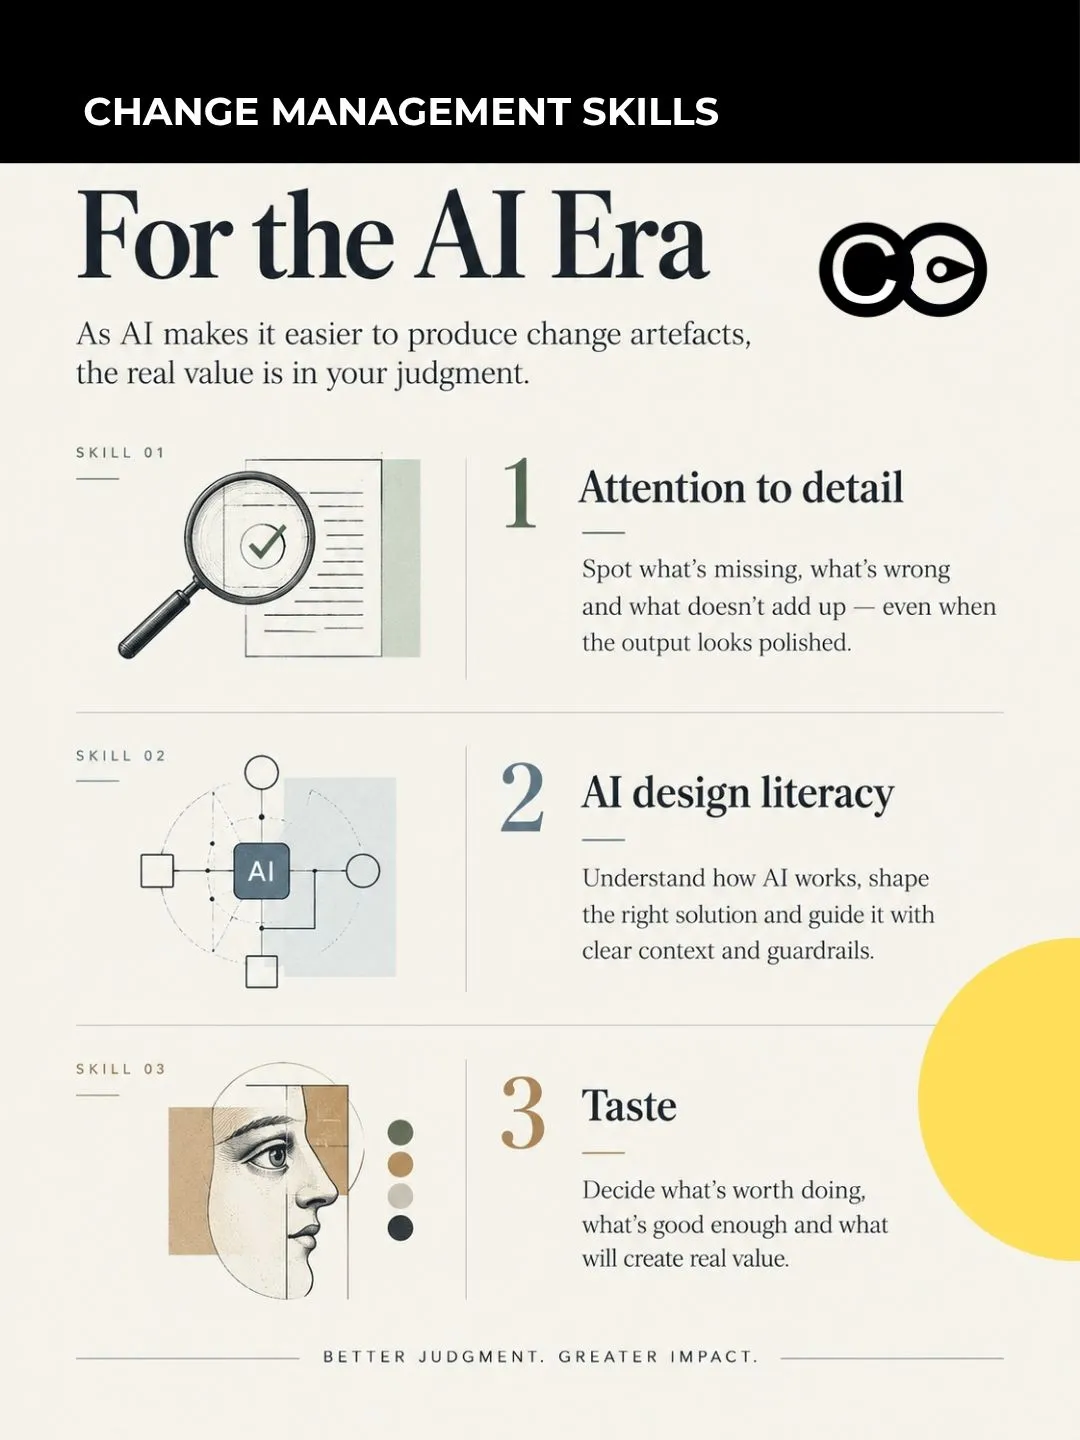
This article is for the leaders deciding which capabilities to develop across their change teams, and for practitioners deciding what to get better at themselves. The argument is straightforward: as AI drives the cost of producing change artefacts toward zero, value moves to the judgment that decides what to produce, whether it is right, and whether it is good enough to use. Three skills carry that judgment, and none of them is prompt engineering. They are attention to detail, the ability to read and shape how an AI solution is designed, and taste. Much of the commentary on AI and change work focuses on whether the job survives or on the operating model shifting from stage gates to a continuous flow of data, and we have covered both elsewhere. This piece is about the concrete skills to prepare your team around, and what to do to build each one.
Why the AI era rewards different change management skills
For most of the history of the profession, a large part of a change manager’s value came from production. Someone had to write the impact assessment, build the stakeholder map, draft the comms, assemble the training plan, and pull the readiness survey together. Those artefacts took real time, and the people who produced them well were valued for it. Generative AI has collapsed the cost of that production. A first draft of almost any change artefact is now minutes away.
When the cost of producing something falls to near zero, the value moves elsewhere. It moves to the judgment about what to produce, whether the output is actually correct, and whether it is good enough to put in front of the project team and stakeholders who will rely on it. The scarce skills are no longer the ones that fill a blank page. They are the ones that decide what belongs on the page and catch what does not.
The evidence that this shift is real, and that most organisations are handling it badly, is now hard to ignore. An MIT report on the state of AI in business in 2025 found that 95 per cent of enterprise generative AI pilots delivered no measurable impact on profit or loss, a gap the authors called the “GenAI divide”. Their explanation is instructive for change professionals: generic tools work for individuals because they are flexible, but they stall inside organisations because they do not learn from or adapt to the way the work is actually done. The failure is rarely the model. It is the design around the model, and the human judgment applied to its output.
There is a second, less obvious warning in the research. A randomised controlled trial by METR in 2025 had experienced developers complete real tasks with and without AI assistance. The developers believed AI made them roughly 20 per cent faster. Measured against the clock, AI made them 19 per cent slower. The gap between how productive people feel with AI and how productive they actually are is one of the defining risks of this period, and it is exactly the kind of gap that the three skills below are built to close.
Skill one: Attention to detail
Attention to detail has always mattered in change work. A wrong go-live date in a comms pack, a stakeholder left off a map, a training cohort double-counted: these have always caused real damage. What is new is that AI both raises the stakes and removes the natural friction that used to catch these errors.
It raises the stakes because AI produces errors that look nothing like human errors. A tired analyst produces work that is visibly rough, and the roughness signals “check this”. AI produces work that is uniformly polished, which signals “this is fine” even when it is not. The confident tone is not evidence of correctness. It is a property of the tool.
It removes the friction because the effort of producing the artefact used to force a slow read. When you wrote the impact assessment yourself, you engaged with every line. When you accept a draft, you can skim. This is where the research on automation bias becomes directly relevant. A 2025 review of automation bias in human and AI collaboration describes the well-documented tendency to over-rely on automated output and discount information that contradicts it, and notes that this tendency weakens the very reasoning and verification habits that catch mistakes. The same review points to a practical finding that should shape how you work: deliberately increasing the effort you put into verification measurably reduces the chance of accepting a wrong recommendation. Passive review does not protect you. Active checking does.
Where AI output tends to go wrong in change work
Knowing the general failure modes lets you check the right things rather than re-reading everything with equal suspicion. In change artefacts specifically, AI-generated content tends to fail in recognisable ways:
It flattens groups that should be kept distinct, merging stakeholders who actually experience a change very differently.
It underweights cumulative load, treating each initiative in isolation and missing the fact that a team is already saturated.
It invents plausible specifics, such as a training duration, an adoption target, or a milestone date, that no one ever agreed.
It reproduces generic best practice that is technically true but disconnected from your organisation’s real constraints.
It states correlations and assumptions with the same confidence as verified facts.
How to build the habit
Attention to detail in the AI era is not a personality trait you either have or lack. It is a discipline you can install:
Read AI output against a source of truth, not on its own terms. Keep the actual stakeholder register, the portfolio load view, and the agreed plan open beside the draft.
Check the specifics first. Dates, numbers, named groups, and commitments are where invented detail hides.
Ask what the draft is assuming without saying so. If an assumption is load-bearing and unstated, surface it and confirm it.
Treat fluency as neutral. A well-written paragraph is neither more nor less likely to be correct than a clumsy one.
This is also where the state of your data decides how far the skill can take you. Verification is far faster and far more rigorous when your change data lives in structured form, because the AI’s claims can be tested against real fields rather than your memory of them. But structured is only half of it. The data also has to be integrated. If impact severity sits in one team’s spreadsheet, stakeholder groups in another’s slide deck, capacity in a third’s project plan, and adoption in a survey tool no one has opened in a month, then neither you nor any AI has a single reliable picture to check against. What a change team needs is structured and integrated change data across the whole portfolio, held in a form an AI can actually ingest and reason over: consistent fields, shared definitions, and one place where impact, capacity, stakeholder load, and adoption live together. That foundation is what makes fast verification possible, and it is also the precondition for the second skill, because you cannot design or judge an AI capability well if the data underneath it is scattered and inconsistent.
Skill two: Reading and shaping how the AI solution is designed
Here is the skill that is least discussed and, over the next few years, probably the most valuable. Change managers do not need to become engineers. They do need enough literacy in how AI solutions are designed to reason about them, ask sharp questions, and shape the adoption approach around the design rather than around a vendor’s marketing. When an AI capability is introduced into a change function or a wider transformation, the practitioner who understands its architecture will make far better decisions than the one who treats it as a magic box.
A handful of design concepts do most of the work. You do not need to implement any of them. You need to be able to hold a competent conversation about each.
Agent design. Increasingly, AI does not just answer a question. It takes a sequence of steps toward a goal: reading data, drafting, checking, and acting. Understanding that an “agent” is a designed sequence, with defined inputs, permitted actions, and stopping points, lets you ask where the human sits in that sequence and what happens when a step goes wrong.
Gating. A gate is a checkpoint where the system pauses for a human decision before it proceeds, or where it refuses to act unless its confidence is high enough. Good AI design in a high-stakes area like change puts gates in the right places. The practitioner’s job is to know which decisions should never be fully automated and to insist a gate sits there.
Continuous learning loops. A system that captures outcomes and corrections and feeds them back improves over time. A system that does not stays generic. The MIT finding above is a learning-loop failure at heart: the tools that failed were the ones that never adapted to the organisation. When you evaluate an AI capability, ask how it learns from what actually happened, and whether anyone is responsible for closing that loop.
Data structure and AI access. An AI is only as useful as the data it can read and the permissions it is given. Structured data, where impact severity, stakeholder groups, and adoption are captured as consistent fields, is something an AI can reason over. Prose buried in slide decks and inboxes is not. Equally, what the AI is allowed to see, and what it must not, is a design decision with real privacy and governance consequences.
None of this requires you to write code. It requires you to ask better questions than “does it use AI?” Questions like: what data does this read, and is that data structured enough to be reliable? Where are the human gates, and are they in the right places? How does this improve, and who owns that? What is this system allowed to access, and what should it never touch? These are change and governance questions dressed in technical language, and they are squarely the practitioner’s territory.
This is also where generic tools reveal their limits. As we argued in why generic AI tools fall short of an enterprise change intelligence platform, an AI with no access to your organisation’s structured change data can only give you faster generic summaries. The upgrade is not a cleverer model. It is the structured foundation underneath it. The companion argument, that the change manager increasingly becomes the steward and strategist of that data foundation, is developed in our piece on agile change management and the change intelligence layer; rather than repeat it here, the point for this article is simpler. You cannot steward or shape something you cannot reason about, which is why this design literacy is now a core skill rather than a nice-to-have.
Prosci’s own research reflects the same gap from the adoption side. In its early findings on AI in change management, it reports that a lack of AI literacy is a leading barrier to adoption, and that organisations increasingly expect adoption and value to be measured with real-time data throughout the life cycle rather than at the end. Both of those expectations land on the practitioner who understands how the system is built.
Skill three: Taste
The third skill is the hardest to name and the easiest to underrate. Call it taste. It is the judgment that decides, among many possible outputs that are all technically acceptable, which one is actually right for this audience, this moment, and this organisation. It shows up in design, and it shows up just as much in expression.
Taste has become a serious topic precisely because AI has made production abundant. When anyone can generate a hundred versions of a comms plan, a stakeholder deck, or a readiness narrative, the constraint is no longer making them. It is choosing well. A 2026 Forbes piece by Marcus Collins argued that when AI can make almost anything, taste becomes the last defensible advantage, a view echoed across a growing body of writing describing a shift from a creation economy to a “taste economy”, where value comes from editing and selection rather than raw output. For change professionals, this is not abstract. Taste is what separates a change story that lands from one that is accurate but inert.
Taste in design
In design terms, taste is the ability to look at three AI-generated options for a stakeholder heatmap, a change roadmap, or an adoption dashboard and know which one communicates and which one merely decorates. AI will happily produce a visually busy chart that technically contains the right data and completely fails to make the point. Taste is knowing that a single clear view beats a dense one, that the severity of an impact should be visible at a glance, and that a stakeholder skimming between meetings has thirty seconds, not thirty minutes. It is the editorial instinct for structure, hierarchy, and emphasis applied to the artefacts change managers actually use.
Taste in expression
Expression is where taste matters most and where AI most often falls short. The default register of generative AI is fluent, even, and generic. It has no ear for your organisation’s language, no sense of what will reassure a nervous middle manager versus what will convince a hard-nosed executive, and no instinct for what to leave unsaid. A change practitioner with taste knows when to cut three paragraphs to one sentence, when a plain declarative line will do more than a polished one, and when the AI’s confident phrasing needs to be softened because the reality on the ground is genuinely uncertain.
This connects to something we have written about at length. Change teams often present data at an awareness level when it needs to be decision-forcing, and they speak in their own idiom rather than the language of the business. Our article on why change teams need to speak executive language makes the case in full. Taste is the faculty that does this translation well. AI can draft the words. Only judgment tells you whether they are the right words for this reader.
The uncomfortable truth about taste is that it cannot be prompted into existence. It is built the slow way, through repeated exposure, deliberate attention, and genuine engagement with the craft over years. That is precisely why it is defensible. A practitioner who has run twenty transformations has a calibrated sense of what good looks like that no one can shortcut, and in an era of infinite cheap production, that calibration is worth more, not less.
How the three skills reinforce each other
These are not three separate competencies to develop in parallel. They form a chain. Design literacy tells you where an AI system is likely to be weak and where its output needs the hardest scrutiny. Attention to detail is how you apply that scrutiny, checking specifics against a real source of truth rather than trusting fluent prose. Taste is the final judgment that turns a corrected, verified draft into something genuinely fit to put in front of the project team, the stakeholders it affects, and, when it needs to go up, a sponsor.
Consider the impact assessment from the opening. Design literacy tells you the AI has no reliable access to cross-initiative load data, so its view of capacity is probably shallow. Attention to detail catches the merged stakeholder group and the invented training assumption. Taste decides that the corrected assessment, while accurate, buries its most important finding on page four, and moves it to the front where the project team and stakeholders will actually see it. Remove any one of the three and the artefact fails in a different way: unexamined, uncorrected, or accurate but ignored.
This is also why the old debate about whether AI replaces change managers misses the point. As we explored in what practitioners need to know about the future of the profession, the work does not disappear. It moves up a level, from producing artefacts to designing, verifying, and exercising judgment over them. The three skills here are the concrete content of that move.
How digital change tools support these skills
Two of the three skills depend heavily on your underlying data. Attention to detail is far faster when an AI’s claims can be checked against structured fields rather than your memory, and design literacy only translates into value when there is a real, structured data foundation for AI to read. This is where a dedicated change platform earns its place. Tools such as Change Compass capture impact, capacity, stakeholder load, and adoption as consistent, structured, and integrated data across the whole portfolio, which gives both you and any AI a single reliable source of truth to reason from rather than a scatter of disconnected files. The point is not that the tool replaces judgment. It is that good structured data makes your judgment faster and your checking more rigorous.
Where to start
If you want to build these skills, do not begin with a course on prompting. Begin with the habits that compound. Pick your next AI-assisted change artefact and read it against a real source of truth, checking every date, number, and named group before you trust a word of it. The next time an AI capability is proposed for your function, ask the four design questions: what data does it read, where are the human gates, how does it learn, and what can it access. And treat every artefact you send as a judgment call, not a transfer: decide what to cut, what to emphasise, and what to say plainly.
Attention to detail, design literacy, and taste are not the skills the AI era makes obsolete. They are the skills it makes decisive. Production has become cheap, and in a world of cheap production, the practitioners who thrive will be the ones who can tell the difference between output that looks right and work that is right.
Frequently asked questions
What change management skills matter most in the AI era?
The skills that separate valuable practitioners from fast producers of low-quality work are attention to detail, the ability to reason about how AI solutions are designed, and taste in both design and expression. These matter because AI has made producing change artefacts cheap, which moves value to judgment, verification, and selection rather than raw output.
Do change managers need technical AI skills?
Not in the sense of building or coding AI. Practitioners do need enough literacy to reason about how an AI solution is designed, including where human approval gates sit, how the system learns from real outcomes, what structured data it can read, and what it is allowed to access. These are governance and change questions expressed in technical language.
Why is attention to detail more important with AI, not less?
Because AI produces errors that look polished and confident, which removes the natural signals that used to prompt a careful review. Research on automation bias shows people tend to over-trust automated output and skim rather than verify. Deliberately increasing verification effort is one of the few things proven to reduce the chance of accepting a wrong answer.
What does “taste” mean for a change practitioner?
Taste is the judgment that chooses the right output among many acceptable ones. In design it is knowing which chart communicates rather than decorates. In expression it is knowing what to cut, what to emphasise, and how to speak in language that lands with a specific audience. AI can generate options, but taste decides which one is fit to use.
Can these AI-era skills be learned quickly?
Attention to detail and design literacy can be built through deliberate habits and asking better questions, and they improve relatively fast. Taste is slower, built through years of exposure and reflection, which is exactly why it is a durable advantage that AI cannot replicate for you.
Your calendar already tells the story. The daily stand-up. Sprint planning on Monday. The retrospective at the end of the sprint. A program increment planning offsite pencilled in for next month. Over the past decade, change managers have moved into agile teams and taken on their rituals, and for many practitioners the sprint, not the phase gate, is now the real unit of work. That shift has barely bedded in, and AI is already changing what those rituals are for.
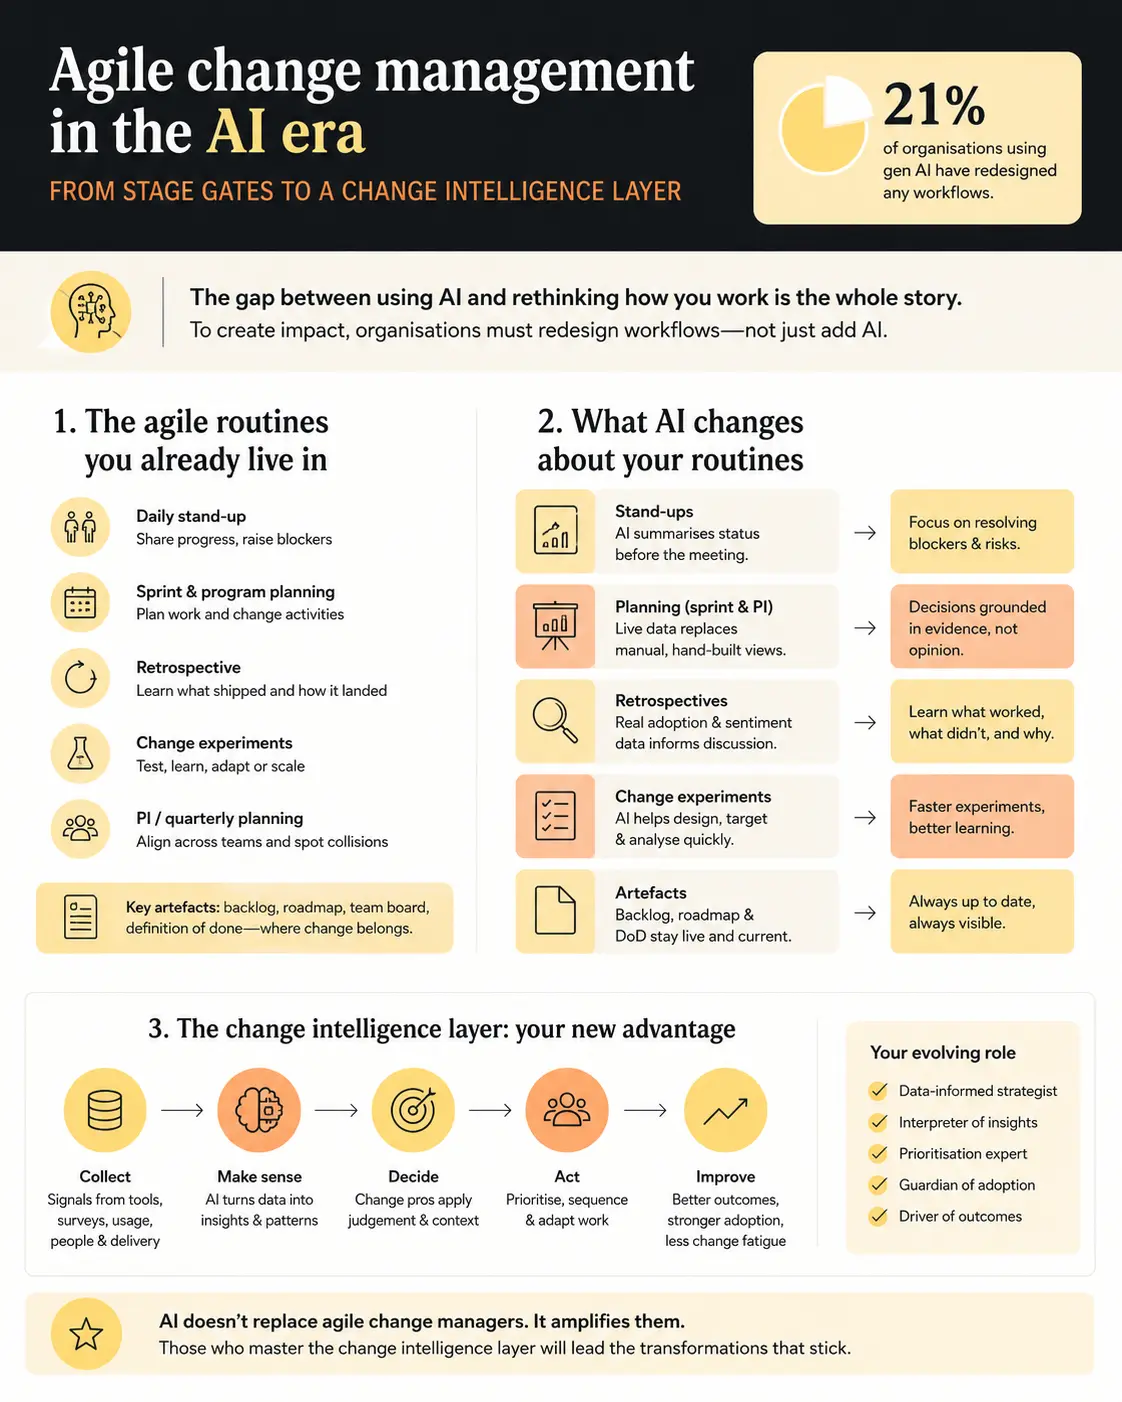
The gap between using AI and rethinking how you work is the whole story here. McKinsey’s 2025 research found that of all the organisational changes linked to gen-AI success, fundamental workflow redesign correlates most strongly with financial impact, yet only 21% of organisations using gen AI have redesigned any workflows at all. Nearly eighty per cent are layering AI on top of processes they have not touched. For change managers, the processes about to be layered on are the agile routines and artefacts you run every week: the stand-ups, the backlogs, the roadmaps, the retrospectives.
This article is about what actually happens to those routines, and about the skill that decides whether you thrive as they change. The interesting question is not whether AI replaces change managers. It is how your agile ways of working are reshaped when AI is in the loop, and why the practitioners who come out ahead are the ones who become stewards and strategists of a change intelligence layer.
The agile routines and artefacts you already live in
Before looking at what changes, it is worth naming what is actually on the table, because the transformation is specific rather than vague. If you work in or alongside an agile delivery team, your week already runs on a familiar set of ceremonies and artefacts.
The routines are the recurring events that give agile its cadence. The ones a change manager is genuinely part of include:
The daily stand-up, where the team shares progress and raises blockers.
Sprint planning, where the team agrees the next short cycle of work, including the change activities that go with it.
The retrospective, where the team looks back at what shipped and how well it landed with the people it affected.
Change experiments, which some teams run as a core agile habit: test an approach with a small group or pilot, see how it lands, and let the result decide whether to adjust, scale, or drop it.
Program increment or quarterly planning, where several teams align on the bigger picture and spot where their work collides.
The artefacts are the objects those events produce and use: the product backlog, the roadmap, the team board, and the definition of done. For a change manager, these are not someone else’s furniture. Change activities increasingly sit as items on the backlog. Adoption criteria increasingly belong in the definition of done. Stakeholder impacts increasingly need to be visible on the same board as the delivery work. The standalone change plan has been folding into the team’s shared backlog for years.
This is the current state that AI now acts on. Not a blank page, but a mature set of routines and artefacts that change managers have spent a decade learning to work within.
What AI changes about your agile routines and artefacts
AI does not abolish the ceremonies. It changes what each one is for, by taking over the manual assembly of information and pushing the human contribution up towards judgement. The pattern is consistent across every routine: the part of the ritual that was about gathering and reconciling status gets automated, and the part that was about deciding what to do gets more important.
The ceremonies
Stand-ups stop being status round-robins. Tooling that reads commits, tickets, and adoption signals can already summarise where work stands before anyone speaks, which means the fifteen minutes shifts from reporting progress to resolving the blockers and risks the summary surfaced. For a change manager, that is a promotion: less time chasing “where are we”, more time on “this initiative is about to land on a team that is already at capacity, and here is the evidence”.
Sprint and program increment planning change most of all. Historically, a change manager walked into planning with a hand-built picture assembled over days: how much change each group was already carrying, where initiatives clashed, how ready each stakeholder group was, and how earlier changes were being adopted. When that picture is generated live from a shared data layer, planning stops being a negotiation between confident opinions and becomes a conversation grounded in evidence: these two initiatives hit the same population in the same window, this group is not yet ready on the measures that predict adoption, and adoption of the last change here has stalled. The change manager’s job in the room moves from bringing the data to interpreting it and deciding what to do about it.
Retrospectives get an honest evidence base. Instead of debating from memory whether a change stuck, the retro can look at real adoption data: usage that rose or stalled, sentiment that moved, the support tickets that spiked. The conversation about what to do differently improves because it starts from what actually happened, not from the loudest recollection in the room.
Change experiments get faster and sharper. When you pilot an approach with one group, AI can help read the result quickly, comparing adoption and sentiment against a group that did not get the new approach, so you can see which version worked and decide whether to adjust, scale it, or drop it. The experiment stays a human decision; the evidence behind it arrives sooner and cleaner.
The artefacts
The artefacts change too, and mostly by absorbing data they never used to carry:
The backlog stops being a plain list of tasks and becomes a list of changes with real impact data attached: who each item affects, how heavily, and when.
The definition of done extends past “the feature works” to “the change is adopted”, so a piece of work is not finished until there is evidence people are actually using it, not just that it launched.
The roadmap stops being a static twelve-month picture and becomes a living view that reflects current load and readiness, and it updates when the plan changes instead of going out of date on the wall.
The team board gains a change dimension, showing not just the work remaining but how much change each group is carrying across everything landing at once.
Notice what every one of these shifts has in common. The ceremony or artefact only improves if the data feeding it is accurate, consistent, and current. An AI-assisted stand-up built on messy, inconsistent change data will still produce a confident summary, it will just be wrong. That dependency is the core of this article, and it is where the change manager’s most valuable work now sits.
The deeper pattern: From ceremony to continuous sensing
Agile itself came from software, and it is worth seeing where the software world took it next, because that is the direction AI is now pushing change work. The best engineering teams no longer rely on ceremonies alone to know what is happening. They run on continuous telemetry: live dashboards of adoption, error rates, and usage that update by the minute, plus dependency maps and release calendars that let one team see, before it ships, that another is about to hit the same service or the same customers.
Three of those habits translate straight into change work. Ship change in small, reversible increments rather than big-bang go-lives, because small changes are easier to absorb and reverse. Sense continuously through behavioural telemetry rather than lagged surveys, so you can act while the signal still matters. And maintain systemic visibility so you can catch two initiatives colliding on the same people before they land, which is change conflict detection by another name. For a number of technology companies, this is already how they work day to day. The methods are proven, and most change teams have adopted the language of agile but not yet this continuous, data-driven way of working.
Why the point-in-time change operating model breaks under AI
Layer AI onto that picture and the reason the old operating model fails becomes specific. AI compresses the build-and-deploy cycle for the changes themselves, so process redesigns that took two quarters now move in weeks. It is also, in the form of AI adoption itself, a rolling wave of change landing on the same people: McKinsey found 88% of organisations now use AI in at least one function but only about a third have scaled it, which means most organisations are in the continuous middle of AI change, not past it. Its work on AI in the workplace adds a twist change managers should sit up for: employees are already adopting AI faster than their leaders realise, so the change is landing on the workforce whether or not a programme is managing it.
Against that cadence, a quarterly, document-driven rhythm fails in diagnosable ways:
The point-in-time impact assessment is stale on arrival. By the time it is signed off, the initiative has moved.
Survey lag hides the moment you needed to see. Sentiment that arrives three weeks late describes a problem you can no longer prevent.
One rating per initiative averages away the truth. A single status for a whole programme conceals that one business unit is drowning while another is idle.
Manual consolidation cannot keep pace. Reconciling a dozen teams’ spreadsheets by hand takes longer than the interval between meaningful changes.
The annual roadmap goes out of date quickly. A fixed twelve-month sequence cannot keep up when AI keeps changing the plan underneath it.
McKinsey’s work on the agentic organisation reaches the same conclusion from the governance side: as work moves continuously, governance “cannot remain a periodic, paper-heavy exercise” and must become real time, data driven, and embedded, with humans holding final accountability. Periodic and paper-heavy is exactly what most change governance still is. The direction of travel is a continuous, data-driven layer with humans in charge of the judgement, and that layer needs an owner.
The change intelligence layer: What replaces the stage gate
If the stage gate is the artefact of the old model, the change intelligence layer is the artefact of the new one, and it is worth defining precisely because the term is easy to wave at and hard to build.
A change intelligence layer is the continuously updated, organisation-specific data foundation that shows, at any moment, how much change each part of the business is carrying, how ready it is, where initiatives collide, and how adoption is tracking, and that feeds this picture to both human decision-makers and AI systems. It is the difference between a folder of assessments and a live nervous system for the portfolio. It is best understood as core infrastructure rather than a reporting nicety, which is the whole case for treating it as a change intelligence platform rather than another dashboard.
What sits in the layer:
Impact data: which roles, teams, and business units each initiative touches, at what depth, and when.
Saturation and load: the cumulative weight of all concurrent change on any given population.
Readiness signals: leadership alignment, capability, and structural readiness, refreshed as conditions move.
Adoption telemetry: behavioural evidence that a change is actually being used, not just launched.
Conflict and overlap: where two or more initiatives hit the same people in the same window.
Here is why this matters specifically in the AI era. Generic AI tools are confidently generic. Ask a general-purpose model to sequence your transformation portfolio and it will give a plausible, well-written answer that knows nothing about your organisation, because it has none of the data above. The AI you are already using becomes genuinely useful for change only when it can read your organisation’s real load, readiness, and conflict data. The layer is what turns a generic assistant into an adviser grounded in your context, the point developed further in what AI can and cannot do without your organisation’s data. Without the layer the AI has no context, and without context it cannot give useful change advice. That is why the layer needs a human owner who understands both the change discipline and the data.
Change managers as data stewards
Data stewardship is the least glamorous phrase in this article and the most important. A data steward owns the definition, quality, consistency, and governance of a class of data. For the change intelligence layer to produce trustworthy signal rather than confident noise, someone has to own change data the way a finance team owns the general ledger. That someone is the change manager.
Consider what happens without stewardship. One team rates impact on a five-point scale, another uses high/medium/low, a third invents its own. “Go-live” means the deployment date to one initiative and the end of hypercare to another. Stakeholder groups are named inconsistently, so the system cannot tell that “Branch Staff” and “Retail Frontline” are the same three thousand people carrying two changes at once. Feed that into an AI model and it will average incompatible scales, miscount overlaps, and generate recommendations that are wrong with total fluency. The problem is not the model. The problem is ungoverned data.
Gartner’s research shows how common and how costly this gap is. In its 2024 survey, poor data literacy sat among the top barriers to data and analytics success, and the sharpest failure points were organisational, not technical: a lack of clear ownership over data initiatives was cited by 69% of respondents, poor results from training by 52%, and more than a quarter said their organisation had no shared understanding of what data literacy even meant. Ownership is the number one gap. For change data, that owner can and should be the change manager.
A change data steward, in practice, owns:
Definitions: a single agreed meaning for impact severity, readiness, go-live, stakeholder group, and every other term the layer depends on.
Quality: the completeness and accuracy of what teams enter, with the standards and follow-up to keep it honest.
Consistency: the same taxonomy across every initiative, so aggregation is valid rather than misleading.
Governance: who can change definitions, how history is preserved, and how the layer stays trustworthy as it grows.
This is unglamorous, and it is decisive. An AI-enabled change function with excellent tools and ungoverned data will simply make faster mistakes. The steward is what makes the intelligence layer worth trusting.
Change managers as data strategists
Stewardship keeps the data clean. Strategy decides what the data should be in the first place, and that is the higher-value half of the role.
A data strategist for change asks a different set of questions. What must this layer be able to answer for our executives, and are we capturing the right data to answer it? Which signals actually predict adoption in our organisation, and are we capturing them or just the ones that are easy to collect? What context does our AI need to give advice we would actually act on, and how do we feed it that context deliberately rather than hoping? These are design questions, and they determine whether the layer drives decisions or just accumulates records.
The strategic payoff is a change in how the portfolio gets governed. Today, prioritisation and sequencing are too often settled by whoever is most senior in the room. A well-designed intelligence layer replaces that with evidence: this population is at saturation, these two initiatives collide in October, this unit is not ready on the dimensions that predict adoption. The strategist’s job is to make the layer answer the questions executives care about, in the language and at the altitude they decide at, the same discipline as presenting a single view of change in executive language rather than practitioner detail.
That reframe, from custodian of a methodology to strategist of a data asset, is the through-line of where the profession is heading. It is why the future of change management in the AI era rewards practitioners who can think in data and systems, not only in stakeholder maps and comms plans. The craft skills still matter. They are now table stakes rather than the differentiator.
How to make the shift: A practical sequence
You do not become a data-led, AI-ready change function by buying a tool and hoping. The move is a sequence, and it can start inside the agile routines you already run. Here is a five-step path a change lead can begin this quarter.
Record each change as structured data, not prose. For every active change, capture who it affects by role and business unit, the timing, and the adoption signals you expect to see, in fields on your backlog or tool rather than buried in a document. If it lives only in a document, the layer cannot read it, which is why teams eventually outgrow the spreadsheet that cannot add up impact across initiatives.
Standardise the definitions. Agree one taxonomy for impact severity, readiness, stakeholder groups, and lifecycle stages, and write it down. This is the steward’s founding act. Without it, every later step compounds inconsistency.
Move sensing into the cadence you already have. You do not need a new meeting. Feed a continuously updated load-and-readiness view into your existing sprint planning, PI planning, and retrospectives, so those ceremonies interrogate live data instead of hand-built decks.
Name the steward explicitly. Decide who owns change data quality and governance, even if it is part of an existing role at first. Gartner’s evidence is blunt: unowned data initiatives fail. Do not leave it implicit.
Put the layer in front of executives, and let AI work on top of it. Once the data is structured, governed, and current, connect it to AI for the analytical lift, surfacing conflicts, forecasting adoption risk, drafting the narrative, and put the resulting picture where decisions get made. The humans keep the judgement.
A common failure worth naming: skipping straight to step five. Bolting AI onto ungoverned, unstructured change data reproduces the McKinsey finding at team level, adding intelligence on top of a broken process rather than fixing the process. Steps one and two are boring and load-bearing. Do them first.
Where a change intelligence platform fits
Everything above can be started in a spreadsheet and a disciplined taxonomy, and for a small portfolio that is a reasonable place to begin. It stops scaling quickly. Once you are aggregating load across dozens of initiatives, detecting conflicts across overlapping populations, and feeding governed data to AI for analysis, the manual version consumes more time than it saves. This is the point of a purpose-built change intelligence platform such as Change Compass: it provides the structured capture, the shared taxonomy, the real-time aggregation, and the portfolio-level view that turn scattered change data into a genuine intelligence layer, and it gives AI the organisation-specific context it needs to move from generic advice to grounded recommendation. The platform is the infrastructure. The steward and strategist are the roles that make it produce something worth acting on.
Where to start
If you take one thing from this, make it the direction, not the destination. Your agile routines are not being abolished; they are being rewired to run on live data, and AI is doing the assembly work that used to fill your week. The change function is moving from a quarterly, document-driven model to a continuous, data-driven one, because AI has raised the cadence of change past the point a periodic rhythm can track. The skill that decides who thrives is not AI fluency in the abstract. It is the ability to steward change data so it can be trusted, and to strategise about what that data should answer.
Start this week with one concrete act inside a ceremony you already run: at your next planning session, agree a single shared definition of impact severity and stakeholder group across all your active initiatives. That is step two of the sequence, it costs nothing but a conversation, and it is the foundation the entire intelligence layer is built on. Get the definitions right and every later step, the automation, the forecasting, the executive reporting, becomes possible. Skip them and even the best AI will only give you fast, confident answers that are wrong.
Frequently asked questions
What happens to agile ceremonies like stand-ups and sprint planning when AI is involved?
AI does not remove the ceremonies; it changes what they are for. The manual work of gathering and reconciling status gets automated, so stand-ups shift from reporting progress to resolving blockers, and planning shifts from bringing hand-built data to interpreting live evidence. Human facilitation, discussion, and judgement remain essential, and arguably become the whole point of the meeting.
What is a change intelligence layer?
A change intelligence layer is a continuously updated, organisation-specific data foundation that shows how much change each part of the business is carrying, how ready it is, where initiatives collide, and how adoption is tracking. It replaces point-in-time assessments with a live view and gives AI systems the real context they need to produce useful, grounded advice rather than generic recommendations.
Why do change managers need to become data stewards?
Because an AI-enabled change function is only as good as the data it runs on. A data steward owns the definitions, quality, consistency, and governance of change data, so that when it is aggregated across initiatives or fed to AI, the result is trustworthy rather than confidently wrong. Gartner consistently finds that unowned data initiatives are among the most likely to fail, which makes explicit stewardship decisive rather than optional.
How is agile change management different from traditional change management?
Traditional change management works in large, sequential phases governed by periodic stage gates and point-in-time assessments. Agile change management works in small increments with continuous sensing of load, readiness, and adoption, steering the portfolio in a rolling cadence rather than a quarterly one. The AI era pushes change towards the agile model because it raises the rate at which change arrives.
Does AI replace change managers?
No, but it changes what the role is for. AI handles the analytical assembly, surfacing conflicts, forecasting adoption risk, drafting narratives, while humans hold the judgement and accountability. The change manager’s centre of gravity shifts from producing documents to designing and governing the data layer that AI, executives, and agile teams all draw on, which is a higher-value role than the one it replaces.
Deloitte’s 2026 industry outlook puts a number on what every utility executive already feels: peak electricity demand is projected to grow roughly 26% by 2035, driven by data centre buildout, transport electrification and industrial reshoring, while more than 2 terawatts of new capacity sit stuck in interconnection queues waiting to connect.
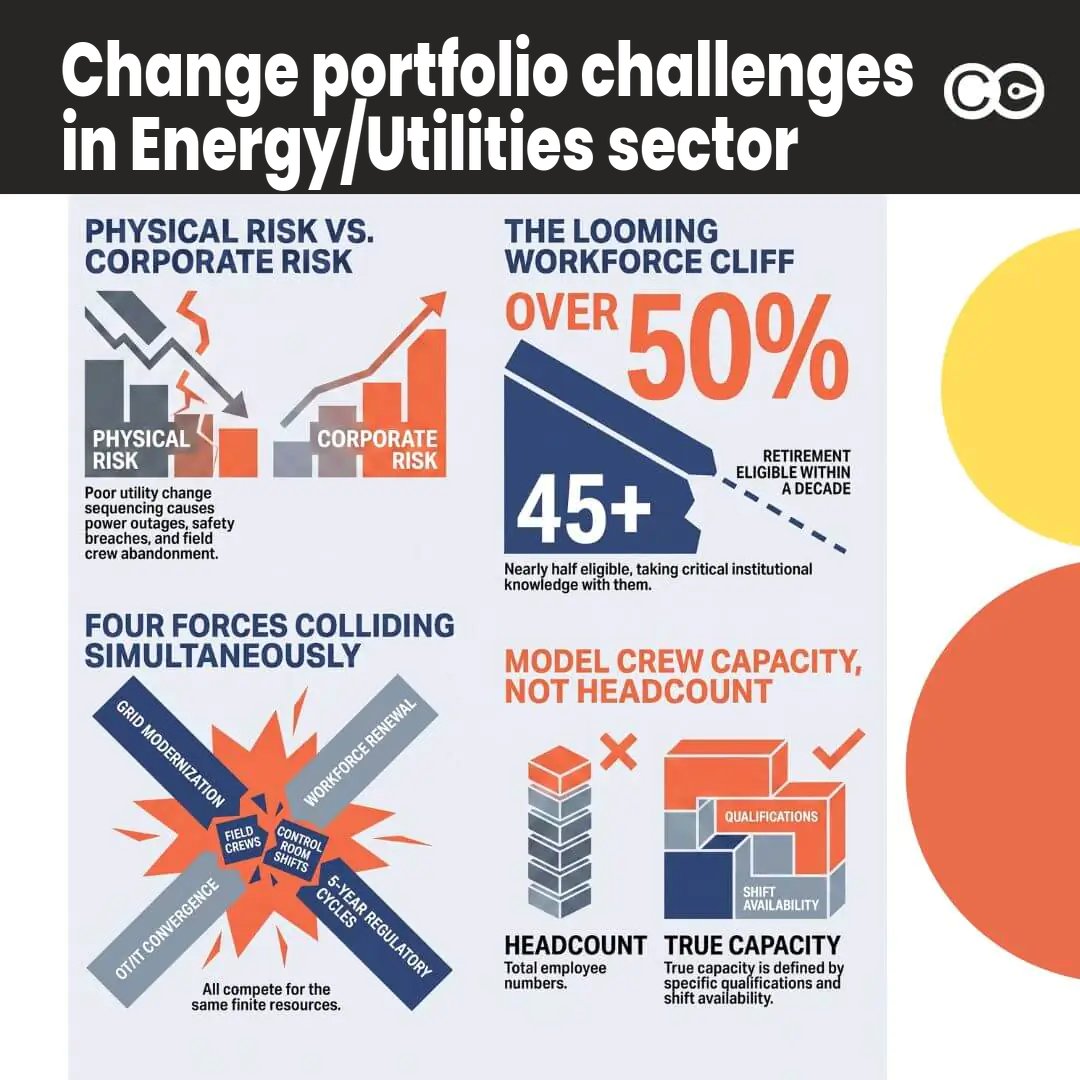
At the same moment, more than half the utility workforce is 45 or older, with between a third and a half of that group eligible to retire within five to ten years. Demand is accelerating. The people who know how to run the grid are leaving.
Neither of those facts is a change management problem on its own. What turns them into one is that utilities are trying to solve both simultaneously, in the same control rooms and field crews, alongside a five-year regulatory reset cycle that was never designed with digital or AI transformation in mind. A grid modernisation programme, a workforce renewal effort, an OT/IT convergence project and a regulator-mandated capital works schedule do not queue up politely. They compete for the same linemen and the same control room shifts, often without anyone holding a single view of the collision.
This is the structural reason generic change management frameworks under-serve energy and utilities. They were built for corporate reorganisations where the main risk is disengagement. In a utility, the main risk is physical: a badly sequenced rollout that pulls a control room operator into training during storm season, or a digital tool a field crew abandons because it was never tested against a rural coverage blackspot. This article sets out what actually differentiates change management for energy and utilities, the four forces colliding in transformation portfolios right now, and a practical framework for sequencing regulated and discretionary change without breaking the people who deliver both.
What makes change management for energy and utilities structurally different
Compare the failure mode. In financial services, the change management conversation centres on regulatory compliance and conduct risk: did the change get documented, evidenced and signed off in a way a regulator would accept. In healthcare, it centres on clinical risk: did the change protect patient safety during the transition.
In energy and utilities, the primary risk is physical and operational. A poorly managed change to switching procedures, outage scheduling or field dispatch does not just create rework or a compliance finding. It can put a lineworker in the wrong place during a live fault, or leave a community without power longer than it should have been.
That single distinction reshapes almost everything about how change should be planned and sequenced in this sector:
Safety-critical operational change cannot be rolled out on a marketing-style go-live date. It has to work around shift patterns, storm season and mandatory safety stand-downs.
Field-workforce logistics are a constraint, not an afterthought. A change that assumes reliable connectivity and a desk does not survive contact with a crew working from a ute in a coverage blackspot.
Long-cycle regulated infrastructure programmes run for years, not months, and have to coexist with faster-moving digital transformation happening in parallel.
Asset-heavy, unionised, multi-generational workforces bring a different change psychology than a corporate head office does: tenure and safety culture carry more weight than in a typical office reorganisation.
None of this means change management matters less in utilities. If anything, the stakes are higher, because the artefact you are changing is the thing that keeps the lights on. It also means the unit of analysis has to shift: a financial services change function can often reason initiative by initiative and still catch most of its risk through governance and sign-off, but a utility change function that reasons the same way will keep missing the risk that only shows up when several long-cycle programmes land on the same crew in the same month.
Four forces colliding in utility transformation portfolios right now
Ask most utility transformation leaders to name their single biggest change risk and they will usually point to one initiative. The real risk sits in how four separate forces are converging on the same finite pool of people, capital and attention at the same time, against a backdrop of capital investment that is itself accelerating: Deloitte puts the US electric power sector’s capital needs at more than $1.4 trillion through 2030. That scale of capital deployment does not translate cleanly into scale of delivery capacity on the ground.
Grid modernisation and the interconnection backlog
More than 2 terawatts of renewable, storage and large-load capacity are currently stuck in interconnection queues globally, nearly double what is currently installed. Clearing that backlog means new planning processes and new ways of working between engineering, regulatory affairs and commercial teams that have historically operated in separate lanes. That is a change programme in its own right, running on a timeline utilities do not fully control.
The workforce cliff
More than half of utility employees are 45 or older, and a meaningful share of that cohort is retirement-eligible within the decade. When an experienced switching operator or protection engineer leaves, they take undocumented judgement with them, not just a job title. Any transformation programme that assumes stable institutional knowledge as a constant is planning against a workforce that will look materially different in five years.
OT/IT convergence and the cybersecurity change nobody scheduled
As operational technology and IT systems converge, utilities gain real operational benefits, but the attack surface expands with every new connected device. Power grids and water systems are high-value targets, and disruption does not stay local. Regulators increasingly expect continuous monitoring and rapid incident response as a baseline, not an aspiration, which means cybersecurity uplift has become a recurring, unscheduled change event competing for the same control room and engineering time as planned modernisation work.
Five-year regulatory reset cycles
In markets like Australia, network businesses submit a regulatory proposal to the Australian Energy Regulator every five years to determine how much revenue they can recover for safe, reliable service. That cycle dictates a large share of capital works, tariff structures and depreciation schedules for the following five years, so digital and AI initiatives not built into the current determination often have to be justified and sequenced around a regulatory calendar the transformation team does not set.
Individually, each of these forces has an established playbook. Together, they draw on the same finite pool of field crews, control room operators and engineering capacity, and almost no utility change function has a single, portfolio-level view of how they overlap.
Most change management templates assume a workforce that sits at a desk, has reliable internet, and can attend a one-hour training session between meetings. None of that describes a field crew. Rollout logistics in utilities have to account for shift-based scheduling, low-connectivity work sites, safety-critical windows that cannot be interrupted, and a workforce that is frequently mobile between depots.
The common mistakes are predictable once you see the pattern:
Scheduling training and go-live during storm season, when field crews are stretched thinnest and least able to absorb new process.
Assuming desktop-style connectivity and device access, when much of the workforce works from vehicles, substations or rural sites with patchy coverage.
Treating union and safety consultation as a compliance checkbox rather than genuine input into sequencing, which slows adoption and erodes trust for the next change.
Rolling out one initiative at a time without checking what else is already landing on the same crew, which is how a well-designed programme still produces change fatigue.
Measuring adoption through system logins rather than field behaviour, which hides the gap between “the tool was deployed” and “the crew actually changed how they work.”
EY’s research into utility digital transformation makes the same point from the workforce side: skills and technology readiness are inseparable from a low-carbon energy future, and EY explicitly frames change management and experience programmes as core to closing that gap, not an add-on to the technology rollout. Design the change around the shift pattern, not the other way around.
A change portfolio management framework for regulated infrastructure programmes
Sequencing a single change well is a project management problem. Sequencing grid modernisation, workforce renewal, OT/IT convergence and a regulatory capital programme against each other is a portfolio problem, and it needs a different discipline: change portfolio management, treated as its own capability rather than a by-product of individual project plans.
Build a capacity model that spans crews, not headcount
A capacity ceiling in a utility is not “how many people we have.” It is how many people with the right qualification, clearance and shift availability can absorb change in a given week, in a given depot or control room, without compromising safety margins. A model built at that level, cross-referenced against every initiative in flight, is what turns “we think Q3 is busy” into “the Overhead Lines crew in the northern region is carrying three concurrent changes in the same fortnight, and one of them can safely move.”
Give portfolio sequencing a single owner with authority to say no
The point of a capacity model is wasted if no one has the mandate to act on it. A practical framework needs four elements:
A single register of regulated and discretionary change, so capital works tied to the current AER (or equivalent) determination sit in the same view as voluntary digital and AI initiatives, not in separate spreadsheets.
A capacity ceiling by crew, shift and control room, not by headcount, so overlap shows up before go-live, not after.
Sequencing rules that protect safety-critical windows first, then fit discretionary change around outage seasons and mandatory safety stand-downs.
A named portfolio owner with the authority to re-sequence, rather than leaving that call to whichever project manager shouts loudest.
Picture how that plays out. A distribution business is midway through a five-year AER determination period, delivering a mandated pole and wire replacement programme. In the same quarter, the digital team wants to pilot an AI-based outage prediction tool with the same control room shift, and the workforce team wants to run a knowledge-transfer programme pairing retiring linesmen with apprentices before three senior crew members leave within eighteen months.
Run in isolation, each initiative looks manageable on its own project plan. Mapped against the same capacity model, the overlap is obvious: all three want meaningful time from the same twelve-person crew in the same six-week window, right before storm season. A single portfolio owner with visibility across all three can push the AI pilot six weeks, run the knowledge-transfer sessions in shorter blocks, and leave the regulated pole replacement programme untouched, because that one carries the least flexibility. None of the three plans would have surfaced that decision alone.
This is a direct extension of change conflict detection applied to infrastructure: the goal is to make the collisions visible early enough that sequencing becomes a choice instead of an accident.
Where AI is actually helping in utilities, and where it is creating new change risk
AI is not a single change in a utility transformation portfolio. It is dozens of smaller ones, arriving on different timelines, into a workforce already carrying grid modernisation, workforce renewal and a regulatory reset cycle.
What is working
Deloitte expects nearly 40% of utility control rooms to be using AI by 2027, largely for grid balancing, demand forecasting and outage prediction. Kyndryl’s research points to concrete wins: AI-driven distributed energy resource management systems orchestrating real-time power flow from renewables, and digital twins that let engineers simulate grid behaviour and anticipate failures before they happen. Where AI is scoped narrowly, against a specific operational problem, it is genuinely reducing outage time and easing pressure on a stretched engineering workforce.
What is not
Only around half of utilities report a positive return from autonomous agentic AI systems, and 70% of sector leaders say they feel unprepared for external business risk, well above the cross-industry average. The research’s own framing is the sharpest summary of the problem: the biggest grid risk over the next decade is not weather or cyberattack, it is organisational inertia. AI initiatives treated as a procurement decision rather than a change programme are the ones most likely to fail, particularly when stacked on top of a workforce already absorbing grid modernisation and OT/IT cybersecurity uplift without anyone checking capacity first.
The practical implication for transformation leaders is to treat every AI initiative as a line item in the same capacity model as everything else, not as a separate, faster-moving track that gets to skip the queue because it is strategically important. Strategic importance is exactly why it needs to be sequenced properly.
Using AI for the change management function itself, not just the grid
Almost all of the AI conversation in utilities happens on the operations side: grid balancing, predictive maintenance, outage prediction. That is only half the opportunity. The change management function carries its own administrative load and its own blind spot, and applying AI there is a distinct, complementary problem.
Cutting the administrative load
A distribution business running a capital programme alongside a digital transformation portfolio generates significant manual overhead: drafting impact statements for every crew a change touches, summarising updates from a dozen project managers, building first-cut readiness assessments, and translating rollout detail into plain-language communications a field crew will actually read. A capable AI layer, grounded in the organisation’s own change data rather than operating as a generic assistant, can absorb a meaningful share of that drafting work without removing the change manager from the decision.
Surfacing what a spreadsheet can’t
The higher-value use of AI is insight, not drafting. Applied to a utility’s own portfolio data, an AI layer can flag that three initiatives are landing on the same crew in the same fortnight, or that a discretionary AI pilot and a regulated capital milestone are converging on the same window before anyone has manually cross-referenced the schedules. This is the same class of insight covered in the capacity-model framework above, surfaced continuously instead of waiting for the next planning cycle.
It is also why general-purpose tools such as ChatGPT or Copilot cannot do this work alone. They can draft a competent impact statement, but they have no access to a utility’s crew rosters, safety windows or regulatory calendar, so they cannot tell a transformation leader that a crew is already at 90 per cent of safe load before a fourth initiative lands on it. The insight only exists if the AI is grounded in the organisation’s own structured change and capacity data, not a generic wrapper bolted onto a chat interface.
Building the infrastructure to see the whole portfolio
Most of what breaks utility transformation portfolios is not a single bad decision. It is the absence of a shared, current view of what is landing where, held by anyone with the authority to act on it. A change intelligence platform gives transformation leaders that view: a live register of regulated and discretionary change, cross-referenced against real crew and control room capacity, so conflicts surface as a planning input rather than a post-incident finding.
This is the same structural argument that has led PMO directors and transformation leaders at firms including NiSource, a regulated US gas and electricity utility, to treat change data as infrastructure in its own right, not a spreadsheet rebuilt every quarter. The Change Compass is built for exactly this problem: a single, live view of capacity, conflict and sequencing, with AI grounded in that same data, so portfolio decisions get made with evidence instead of guesswork.
The portfolio is the unit of risk, not the project
Every individual change programme in an energy or utilities transformation portfolio can be well planned, well resourced and well executed, and the portfolio can still fail, because the risk was never in any single initiative. It was in the collision between grid modernisation, workforce renewal, OT/IT convergence and a regulatory reset cycle that none of the project plans were built to see. Change management for energy and utilities has to operate at the level where that collision is visible: a shared capacity model, a single register of regulated and discretionary change, and someone with the authority to re-sequence when the plan and the calendar disagree.
Start smaller than a full portfolio rebuild if you need to. Pick the one crew or control room carrying the heaviest concurrent load right now, map every initiative landing on it over the next two quarters, and see what the collision actually looks like on paper. Most leaders who do that exercise once do not go back to planning change one project at a time.
Frequently asked questions
What is change management for energy and utilities?
The discipline of planning, sequencing and embedding organisational change within the constraints of safety-critical operations, field-based workforces, long-cycle infrastructure programmes and five-year regulatory reset cycles. It differs from generic corporate change management because the primary risk is physical and operational, not purely compliance-based.
Why can’t utilities use the same change management approach as other regulated industries?
Financial services centres on regulatory and conduct risk, and healthcare centres on clinical risk. In energy and utilities, the primary risk is physical and operational safety, and a large share of the workforce is field-based and shift-based, which requires different rollout logistics entirely.
What is change portfolio management, and why does it matter for utilities?
Managing the combined load, sequencing and conflicts of every change initiative across an organisation at once, rather than each in isolation. For utilities, grid modernisation, workforce renewal, OT/IT convergence and regulatory capital programmes routinely draw on the same finite pool of crews and control room staff, and only a portfolio-level view catches that overlap before it causes an operational problem.
How should utilities sequence AI rollouts against other transformation programmes?
AI initiatives should sit in the same capacity model as every other change, mapped against real crew and control room availability, and sequenced around safety-critical windows and regulated capital works. Treating AI as a separate track that bypasses portfolio sequencing is a common reason AI programmes underdeliver.
How can utilities address the ageing workforce and skills gap through change management?
By capturing undocumented operational judgement before experienced staff retire, designing rollouts around shift patterns rather than desk-based assumptions, and building genuine frontline and union consultation into sequencing decisions rather than a late-stage compliance step.
How can AI support the change management function, not just grid operations?
It can reduce the drafting load (impact statements, stakeholder communications, first-cut readiness assessments) and, more valuably, surface portfolio-level insight, such as flagging that a crew is approaching its safe capacity load before a human would have cross-referenced every initiative manually. This only works if the AI is grounded in the organisation’s own change data, not a generic assistant with no visibility into rosters or the regulatory calendar.
On 1 July 2025, APRA’s Prudential Standard CPS 230 came into force, and with it, a requirement most financial services change functions still have not absorbed: boards must now oversee operational risk arising from their own institution’s change activity, as a standing governance responsibility, not a project-level concern raised only when something has already gone wrong. It is one of the first times a regulator has said explicitly, in a binding prudential standard, that a poorly sequenced portfolio of change is a board-level risk in its own right, and it is one instance of a pattern now playing out in board rooms well beyond Australia, from London to Toronto to Singapore.
CPS 230 did not invent this problem. It named it. And it forces a question most financial services change functions have never had to answer cleanly: at which level of the organisation, exactly, is the volume and sequencing of change actually governed, and does the board see the performance and benefit impact of that portfolio, or only a status summary of individual projects.
Most change management for financial services content treats regulatory pressure as one more generic source of “change volume” to manage. It is not generic. It is a structural governance question that plays out differently at three distinct levels, the frontline teams absorbing change day to day, the business unit coordinating it across them, and the enterprise and board reviewing what it is doing to performance and value. This article sets out a working governance model across those three levels, and shows why regulators well beyond Australia are now converging on the same demand.
Why this is now a board-level governance question
CPS 230 is not an isolated Australian requirement. Over the past three years, financial services regulators across several major markets have independently converged on treating change-related operational risk as a governance obligation, not a delivery detail. A few examples make the pattern clear.
Australia: alongside CPS 230’s operational risk requirement, the Financial Accountability Regime requires banks (from March 2024) and insurers and superannuation trustees (from March 2025) to name accountable persons against specific responsibilities, backed by formal accountability statements.
The United Kingdom: in April 2023, the Bank of England’s Prudential Regulation Authority personally fined TSB Bank’s former Chief Information Officer for breaching the PRA’s Senior Manager Conduct Rules, following a 2018 core banking migration that locked out 5.2 million customers and eventually cost the bank £48.65 million in combined FCA and PRA fines. The regulators were explicit that the failure was not the migration itself, migrations fail regularly, but that no one had both the authority and the full picture needed to stop it going ahead once the warning signs were there.
Canada: the Office of the Superintendent of Financial Institutions’ Guideline E-21, finalised in August 2024, explicitly lists change management alongside business continuity and crisis management as a named component of operational risk and resilience that federally regulated institutions must govern.
Singapore: the Monetary Authority of Singapore’s Guidelines on Individual Accountability and Conduct require financial institutions to clearly identify the senior managers responsible for each core function and hold them accountable for the conduct of the business under their purview.
The European Union: the Digital Operational Resilience Act, in force since January 2025 across roughly 22,000 financial entities, ties ICT and change-related operational resilience directly to internal governance obligations, with penalties reaching €1 million for individual senior managers.
None of these regimes were written with change management in mind specifically. All of them arrive at the same practical requirement: a financial services change portfolio needs real governance at every level where a decision about sequencing, capacity or risk actually gets made, not a single dashboard the board glances at once a quarter. If you already have a strong grip on the different categories of transformation running through your organisation, our companion piece on the eight core types of financial services transformation is the right place to map what is actually in your portfolio before applying the governance model below.
A governance model for change portfolios: operations, business unit, enterprise
Most financial services change functions have governance on paper, a steering committee here, a change advisory board there, but it rarely maps cleanly onto the three levels where decisions about change risk and value actually get made. Here is a model that does, built around a single artefact each level contributes to and draws from: a risk-in-change register, a live record of what change is landing where, how much capacity it is consuming, and what operational, consumer-outcome or performance risk it is creating, that exists as one shared view rather than three disconnected reporting lines.
Operations level: the source of real signal
The operations level, claims processing teams, contact centre agents, branch tellers, loan servicing staff, is where change load is actually experienced, not where it is reported from a spreadsheet. This is the frontline delivering the customer interaction every disclosure and prudential regime ultimately cares about. This level should surface three specific things upward:
Real capacity data, not estimated capacity. How many hours per week is this team realistically able to absorb in new process, system or product change, given its existing operational workload, not a generic FTE assumption inherited from a project template.
Early psychosocial and readiness signals. Frontline supervisors are the first people to see when concentrated change load is producing disengagement, error rates, or attrition risk, well before it shows up in a portfolio dashboard.
First-hand evidence from the customer interaction itself. Where a change affects a customer-facing product or process, frontline staff are the ones who can confirm whether customers actually understand what changed, not just whether a disclosure document was technically issued.
The failure mode at this level is not incompetence. It is that most portfolio governance never asks operations teams for this information in a structured, recurring way, so it only surfaces informally, if at all, until it becomes an incident.
Business unit level: the sequencing function
This is the divisional or business-unit layer, retail banking, claims, wealth advice, coordinating operations teams underneath it, and it is the level TSB’s case shows was structurally missing: someone with a live, cross-initiative view who can see that two individually “green” projects are about to land on the same operations team in the same fortnight, one driven by a hard regulatory deadline and one entirely discretionary.
This level should own:
Cross-referencing regulatory deadlines against operational capacity data, not managing regulatory and discretionary change as separate, uncoordinated streams reporting into different committees.
The sequencing and trade-off recommendation, deciding, with evidence, which discretionary initiative slows down when a mandatory obligation is added to a team’s load, rather than leaving that decision to whichever project manager escalates loudest.
Genuine change conflict detection across the business unit’s initiatives, treating overlapping change on the same team as a standing risk to monitor, not a coincidence discovered after go-live.
Aligning frontline readiness and engagement data with the customer communication plan, rather than letting the two run on separate tracks. A business unit that knows its contact centre team is stretched thin two weeks out from a major product change should be the same function deciding when and how customers hear about that change, because a rushed or poorly staffed customer response is exactly when a communications gap turns into a complaint, an escalation, or a DDO and Consumer Duty evidence problem.
Without a real system of record spanning every initiative, not a folder of individual project plans, this function is guesswork dressed up as governance. This is precisely the gap a dedicated change portfolio platform is built to close.
Enterprise and board level: performance and portfolio benefit impact
The board and executive committee should not be reviewing individual project statuses, and their interest in this governance model is not primarily who is personally accountable for what. It is performance: what is the change portfolio, taken as a whole, doing to operational performance, customer outcomes and the benefits the organisation committed to when it funded each initiative. This level should own three things:
A portfolio-wide performance and benefit-impact view, showing where concurrent change is degrading operational metrics, error rates, service levels, adoption, or customer satisfaction, against the benefit case that justified the investment in the first place, not a status roll-up of red, amber and green.
The change capacity ceiling, set as an explicit decision: how much combined regulatory-mandated and discretionary change the organisation can absorb in a given period without measurably eroding performance, informed by what the business unit and operations levels are reporting, not set once a year and forgotten.
The trade-off decision when capacity and benefit realisation conflict, deferring or resequencing discretionary transformation when the evidence shows it is putting delivery of committed benefits, or day-to-day performance, at risk. TSB’s board found this out only after the fact; CPS 230 and its international equivalents now expect boards to be asking the question before it happens.
If your board only ever sees a portfolio-wide status summary with no visibility of the performance and benefit impact underneath it, you do not yet have this layer, regardless of how many steering committees exist beneath it.
Customer disclosure obligations are now a change design constraint
Two regimes change what “ready to launch” means for any customer-facing financial services change. Under ASIC’s Design and Distribution Obligations, issuers and distributors must define a target market and take reasonable steps to keep distribution within it on an ongoing basis, not through a one-off disclosure document; ASIC has already secured an $8 million penalty against Firstmac and issued more than 80 preliminary stop orders for DDO contraventions. In the UK, the FCA’s Consumer Duty, in force since July 2023, goes further still, requiring firms to evidence good outcomes across products, price, consumer understanding and consumer support, with an annual board-level assessment of whether they achieved this.
The practical effect is that the customer communications and monitoring plan, historically a downstream deliverable finished once “the real work” was done, is now itself a compliance artefact that has to be designed before a change goes live, not written up afterwards. For any financial services group operating across more than one of these regimes, and most larger insurers and wealth managers do, a single change rolled out on one timeline needs two distinct evidence trails, not one disclosure pack adapted after the fact, because DDO and Consumer Duty ask genuinely different questions of the same change.
Inside the governance model, this obligation sits at the intersection of the operations and business unit levels, and it fails when it is treated as belonging to neither. Three things need to move earlier in the change lifecycle to close that gap:
Target market and product governance checks belong inside the change design phase, reviewed alongside scope and timeline, not bolted on as a compliance sign-off after design is locked.
Frontline readiness and engagement data has to be read alongside the customer communication plan, not separately. If operations-level signals show a team is already stretched, that is a reason to reconsider the timing or intensity of the customer-facing message going out at the same time, not just a resourcing footnote for the business unit to manage quietly.
Consumer-facing changes need enough lead time built into sequencing to construct the outcomes evidence base regulators expect, which the business unit level can only protect if it has visibility of the deadline early, not discover it competing with an unrelated regulatory-mandated change for the same launch window.
Overlapping customer segments need to be visible at portfolio level, because a segment absorbing three separate product changes in one quarter is a consumer-understanding risk even where each change individually cleared its own DDO or Consumer Duty review in isolation.
Two risk domains most governance models still bolt on instead of owning
AI as its own governance lane
APRA’s April 2026 letter to industry, following targeted engagement with large banks, insurers and superannuation trustees, found that “AI governance, risk management and assurance are struggling to keep pace” with adoption, with specific gaps in identity and access management, patch management and testing of AI-generated code. The governance model above answers this directly: an AI-enabled change, a new underwriting model, an AI-assisted advice tool, needs its own line in the enterprise-level performance and benefit-impact view and its own capacity and risk data at the operations and business unit levels, not a place inside the general “technology change” category where AI-specific risk gets diluted into a bucket it does not fit.
Badly managed change as a named operational and legal hazard
Canada’s OSFI Guideline E-21 is unusual among the regimes above in naming change management explicitly as a component of operational risk and resilience regulators expect institutions to govern, not folding it into generic technology or project risk. Australia’s Safe Work Australia Model Code of Practice on psychosocial hazards reaches a parallel conclusion from the workplace health and safety side, naming badly managed change, alongside high job demands and low role clarity, as a specific hazard organisations have a legal duty to identify and control. Read together, these two regimes from two different regulatory traditions are saying the same thing: change load concentration on a team is not a soft people-risk footnote. It belongs in the operations and business unit levels of the governance model as a tracked risk, on the same footing as a system outage or a compliance breach.
For financial services specifically, this hazard concentrates in exactly the operations and frontline teams carrying the heaviest regulatory-mandated load, claims, contact centre, lending operations, the same teams disclosure and prudential regimes place under the most scrutiny. A governance model that tracks capacity and readiness at the operations level is therefore not a parallel wellbeing initiative sitting alongside risk management. It is the same data serving both obligations at once, which is precisely why it belongs in the risk-in-change register rather than a separate HR dashboard nobody in risk or compliance ever sees.
What this looks like in practice
Take a claims operations team absorbing three concurrent changes: a mandatory process update to meet a new disclosure deadline, a core system upgrade, and a discretionary efficiency initiative the business case was signed off eighteen months ago. Under most current governance arrangements, each of these reports green individually, three separate project managers, three separate steering committees, no shared view of the team underneath them. Under the three-level model, operations would have flagged the combined load against real team capacity weeks earlier; the business unit would have used that signal to recommend deferring the discretionary initiative and to hold back the customer communication until the team had capacity to handle the resulting enquiries well, since the disclosure deadline is fixed and the system upgrade is nearly complete; and the enterprise level would have seen the benefit-realisation and performance trade-off explicitly, on the record, rather than discovering it once the team’s error rate, complaint volume or attrition spikes. That is the exact sequence of missing decisions TSB’s post-mortem points to, replayed at a smaller, everyday scale.
A governance model is only as good as the data feeding it. In practice, the financial services change functions doing this well share four disciplined habits.
They maintain a rolling, not point-in-time, change readiness assessment at the operations level, because readiness collected once at project kickoff is stale within weeks in a fast-moving regulatory environment.
They give the board a single portfolio-level view of performance and benefit impact, where regulatory deadlines, capacity and consumer-facing change intersect, rather than a stack of individual project RAG statuses that hide exactly the kind of overlap TSB’s failure exposed.
They treat the organisational structure question, centralised, federated or hybrid change governance, as a deliberate design choice rather than an accident of history; if this decision has not been made explicitly in your organisation, our guide to choosing the right enterprise change management structure is a useful next step.
They tie change delivery to sustained benefit realisation, not milestone completion, so the enterprise level’s capacity-ceiling decisions are informed by what previous change actually protected or delivered, not just what it shipped on time.
None of this is achievable through steering-committee reporting alone. It requires a system of record spanning the whole portfolio that can answer, for any team, at any level, “what is landing here, from every source, this quarter, and what is it doing to performance,” as a standing question rather than a special request pulled together after something has already gone wrong. This is the specific gap a change intelligence platform like Change Compass is built to close for financial services portfolios: giving each governance level, operations, business unit and enterprise, the same live view of change load, sequencing, readiness and benefit impact, rather than three disconnected versions of the truth.
Where governance actually has to start
TSB’s board found out only after the fact what its change portfolio was doing to operational performance and customer outcomes. That is the test worth applying to your own portfolio today: can your board see, right now, the performance and benefit impact of everything landing on your frontline teams this quarter, not just a status roll-up of individual projects. If the answer is no, that is where your governance model needs to start, at whichever of the three levels, operations, business unit or enterprise, currently has the least visibility, before the next regulatory deadline forces you to find out the hard way.
Frequently asked questions
What does governance at the operations, business unit and enterprise level mean for change management? It means splitting change portfolio governance into three distinct levels: operations teams who surface real capacity, readiness and customer-interaction data, a business unit layer that sequences change and aligns frontline readiness with customer communication, and an enterprise or board level that reviews the performance and benefit impact of the whole portfolio and sets the capacity ceiling. Most financial services change functions have committees at each level but rarely this clean a division of what each one actually owns.
Why do financial services regulators increasingly treat change-related operational risk as a board-level issue? Regimes such as Australia’s CPS 230, Canada’s OSFI Guideline E-21, the EU’s DORA and the UK’s Senior Managers regime were all designed to close a gap regulators saw repeatedly: institutional failures where no one at the right level had both the visibility and the authority to prevent them. Some of these regimes go further and require a named accountable individual, but the underlying demand in every case is board-level oversight of the risk change activity creates, not just after-the-fact accountability.
How is change management treated as an operational risk under regimes like CPS 230 and OSFI Guideline E-21? Both regimes require boards to oversee operational risk arising from an institution’s own change activity, not just external threats. OSFI’s Guideline E-21 goes further by explicitly naming change management as a component institutions must govern, alongside business continuity and crisis management, rather than treating it as a generic project management concern.
Why do design and distribution obligations affect how a change is rolled out, not just how it is communicated? DDO and the FCA’s Consumer Duty both require ongoing evidence that a product or service change is reaching its intended market and delivering good customer outcomes, not a one-off disclosure at launch. This means the monitoring and evidence plan has to be designed into the change itself before go-live, rather than treated as a communications task completed afterwards.
Is AI-enabled change different from other technology change in a governance model? Yes. Regulators including APRA have found that AI governance, risk management and assurance are not keeping pace with the speed of AI adoption in financial services. This means AI-enabled change needs its own line in the enterprise-level performance view and its own risk data at the operations and business unit levels, rather than being managed inside a general technology change category where AI-specific risks are easy to miss.
Why should frontline readiness data be linked to customer communication planning? If a frontline team is already stretched by concentrated change load, that is directly relevant to when and how a customer-facing message about that change should go out, because an under-resourced team is more likely to produce inconsistent answers, longer wait times or missed follow-up when customers respond. Treating readiness and customer communication as two separate workstreams is a common reason DDO and Consumer Duty evidence gaps appear even when each team believes it delivered its part correctly.
We use cookies to improve your experience and understand site use. Marketing cookies stay off until you accept, and in the EU, UK and Switzerland analytics does too. Cookie Policy.
Strictly necessary
Required for the site to work: security, load balancing, and remembering your choices. These cannot be switched off.
Always active
Analytics
Google Analytics and similar, so we can see which pages are useful and where visitors get stuck. Aggregated, never sold.
Marketing
Used to measure campaigns and show relevant content on other platforms such as LinkedIn.