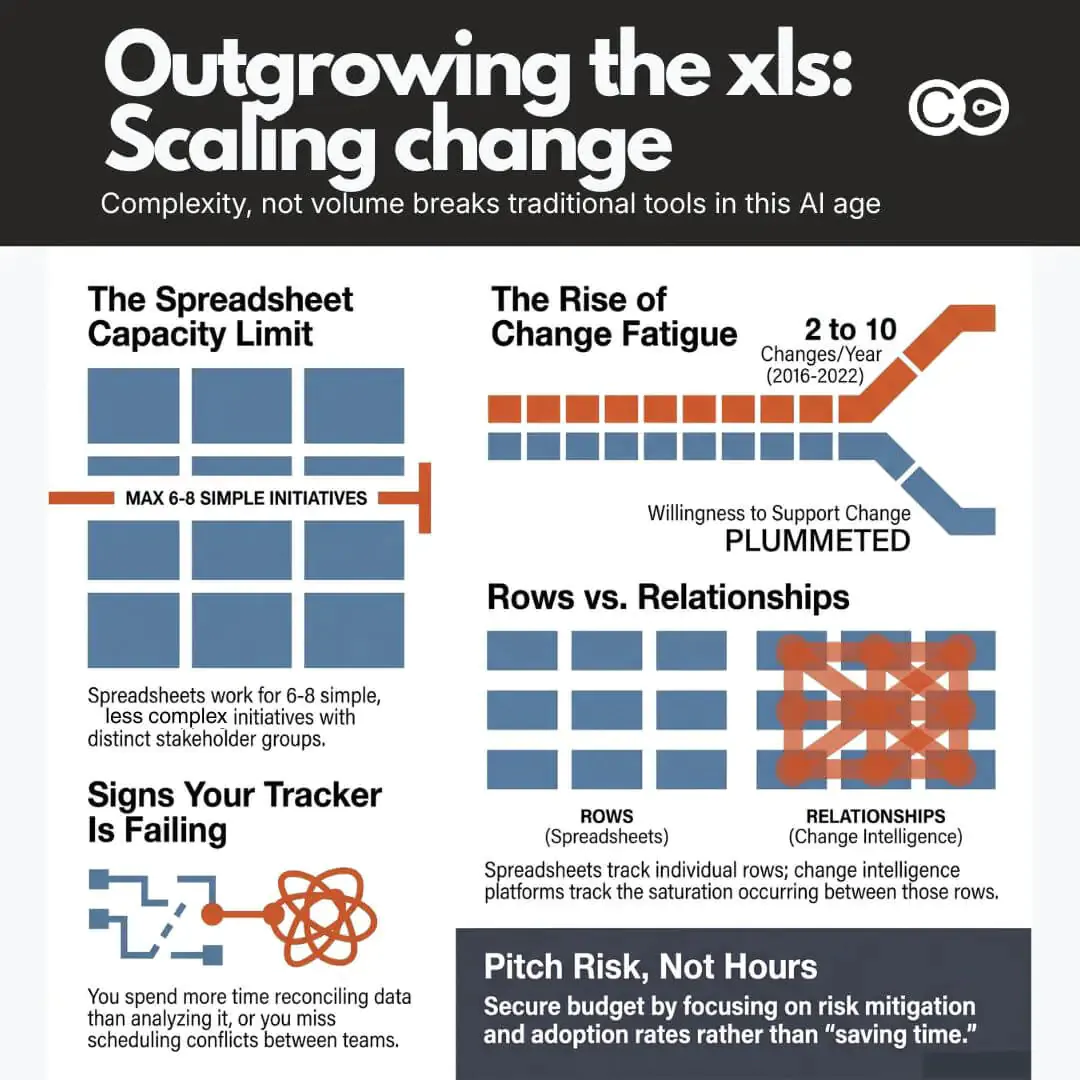
Most change practitioners build the same thing first: a spreadsheet with a tab for each project, a column for status, and a colour-coded RAG rating that everyone agrees to update “by Friday.” It’s a genuinely good tool, and it can comfortably hold six to eight initiatives if those initiatives are simple: different teams, different timing, no real overlap. Then, without any change in the initiative count, two project teams schedule mandatory training for the same 200 branch staff in the same week, nobody notices until the complaints start, and the practitioner spends the next afternoon reverse-engineering what went wrong from five different versions of the same file. This is not a story about too many initiatives, or bad discipline. It’s what happens when the complexity of the change outgrows a format that was only ever built to list projects, not to show where they collide.
This article is a practical guide to that whole arc. It starts with the spreadsheet almost everyone builds first, including exactly how to build one properly, because there is nothing wrong with starting there. It then covers the specific point where spreadsheet-based tracking stops showing you what you need to see, what that actually costs in hours and in risk, and how to make the case for something better when the time comes. The case, as you’ll see, is not really about saving time. It’s about what a portfolio of change looks like to the people who are betting the year’s strategy on it going well.
The point where spreadsheet-based change initiative tracking breaks down
A spreadsheet is a genuinely good tool for a portfolio of six to eight initiatives, provided the changes themselves are simple: a single stakeholder group each, no shared timing, no shared teams. Each has an owner, a timeline, a handful of stakeholders, and updates happen often enough that one person can keep the file current in their head. The failure mode isn’t sudden, and it isn’t really about count. It creeps in as complexity increases, and by the time it’s obvious, the practitioner has usually been quietly compensating for weeks: cross-checking two tabs by hand before a steering committee meeting, emailing three project managers to confirm a stakeholder count nobody trusts anymore, or maintaining a “master” version that only exists because the shared one kept getting overwritten.
The question worth asking isn’t “how many initiatives are we tracking?” A team running eight straightforward, non-overlapping changes can often stay on a spreadsheet indefinitely. The questions that actually predict whether your tracker is about to fail you are different, and none of them are about volume:
How complex are the changes this team is actually facing, not how many of them there are. A single high-impact system change with five stakeholder groups and three dependencies is harder to track than four simple, contained ones.
What’s the real risk of saturation building up underneath the numbers? A spreadsheet can tell you an initiative count. It can’t easily tell you whether the same people are being asked to absorb change faster than they can adapt.
Where are changes overlapping? Specifically: within one role, within a specific team, within a single week, or within a business unit, carrying more than one change at the same time. This is the question a row-per-initiative format is structurally worst at answering, because the overlap only exists in the relationship between rows, not in any single row.
A spreadsheet can hold the initiative count indefinitely; it’s the saturation and overlap questions it fails on, usually well before the sheet itself looks unmanageable. The signs are consistent enough to check yourself against. Your tracking has stopped working if:
Updating one initiative’s timeline doesn’t automatically update the shared view everyone else is looking at
Two people have edited the file this week and you’re not fully sure whose version is current
You’ve missed, or nearly missed, a scheduling conflict between two initiatives touching the same group of people
Building the monthly executive update takes the better part of a day, most of it spent reconciling data rather than analysing it
Nobody outside your team can self-serve an answer about portfolio status; they all have to ask you
None of these individually is a crisis. Together, they describe a practitioner spending an increasing share of their week being a human database instead of a change professional. The rest of this guide assumes you’re somewhere on that curve, whether you’re building your first tracker or you’re already living with three or four of the symptoms above.
Build a basic change initiative tracker in an hour
If you don’t have a tracker yet, or the one you have has sprawled past usefulness, start here. This is the structure that scales furthest before it needs to be replaced, and it takes about an hour to set up properly.
The three tabs you need
A workable spreadsheet tracker needs exactly three tabs, no more. Extra tabs are usually where trackers go to die, because each one is another place data can drift out of sync with the others.
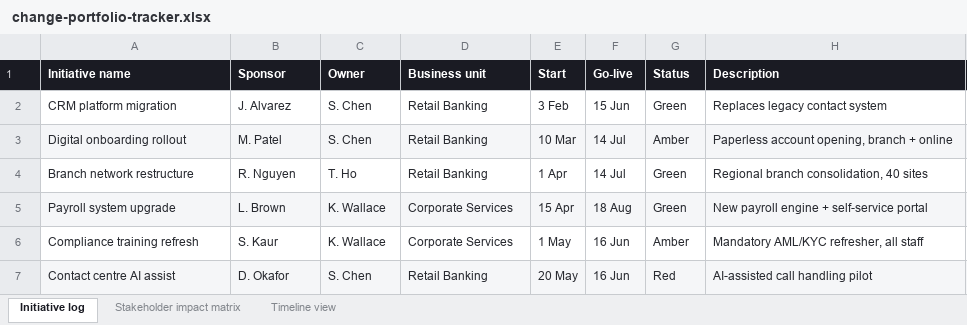
Initiative log. One row per initiative. Columns: initiative name, sponsor, owner, business unit, start date, go-live date, current status (RAG), and a one-line description. This is your portfolio anchor; every other tab refers back to the initiative name here.
Sample initiative log for a portfolio of six concurrent changes across two business units.
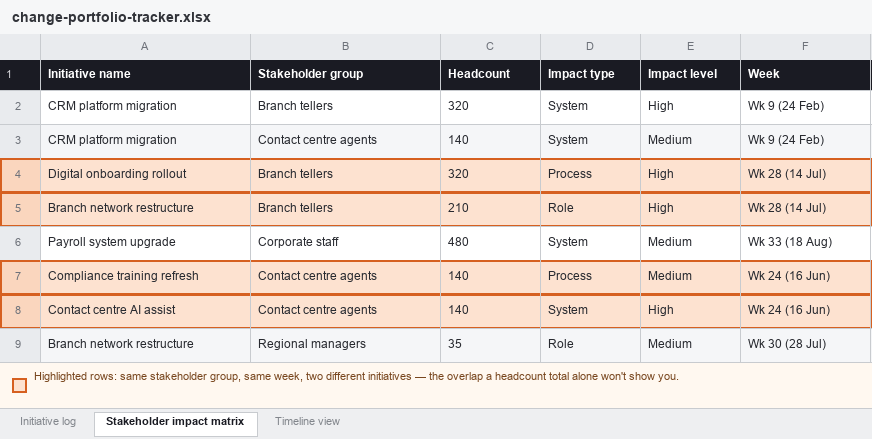
Stakeholder impact matrix. One row per stakeholder group per initiative (so a single initiative touching three teams gets three rows). Columns: initiative name (matched to the log), stakeholder group, headcount, impact type (process, system, role, or location), impact level (high/medium/low), and the week the impact lands.
The same portfolio’s stakeholder impact matrix. The highlighted rows show Branch Tellers and Contact Centre Agents each carrying two initiatives in the same week, an overlap invisible from the initiative log alone.
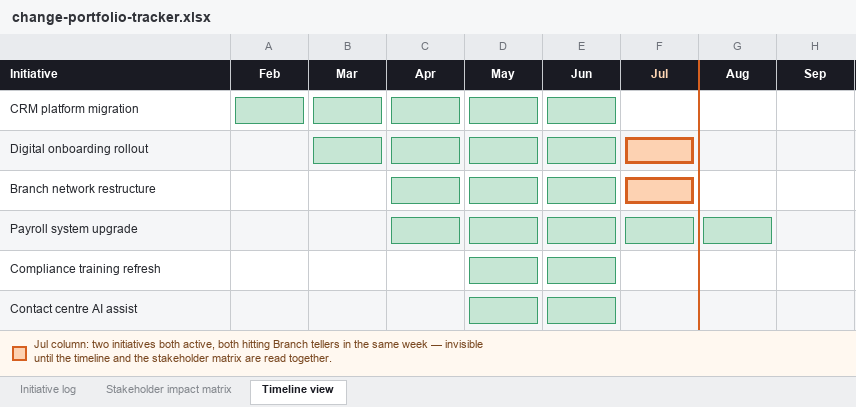
Timeline view. A simple week-by-week or month-by-month grid, with initiatives as rows and time periods as columns, shaded to show when each initiative is actively impacting people (not just its overall project timeline, but specifically when change hits the ground).
The timeline view of the same portfolio. The July column flags exactly where the overlap sits: two initiatives, one team, one month.
Read on their own, each tab answers a different question: the log tells you what’s running, the matrix tells you who’s carrying it, and the timeline tells you when it lands. Read together, as in the example above, they answer the harder question a spreadsheet is otherwise bad at surfacing: which team, in which week, is quietly carrying two changes at once.
Step-by-step: setting it up
Create the initiative log first and populate it with everything currently running or approved to start in the next quarter. Don’t wait for a “complete” list; add rows as new initiatives are approved.
Build the stakeholder impact matrix as a separate tab, using the initiative name as a lookup key (a simple data validation dropdown pulling from the log keeps names consistent, which matters more than it sounds like it should).
Sum total headcount impact per stakeholder group per week using a pivot table or SUMIFS formula referencing the matrix. This single calculation is the difference between a list of projects and an actual view of change load.
Build the timeline grid manually or with conditional formatting keyed off the start/go-live dates in the log.
Set a fixed weekly or fortnightly cadence to update all three tabs together, and put it in the calendar as a recurring task, not an ad hoc one.
Before every steering committee or portfolio review, manually scan the stakeholder matrix for any group appearing in more than one initiative in the same week. This is the conflict-detection step, and at this stage it has to be done by eye.
This will comfortably serve a portfolio of six to eight concurrent initiatives, as long as they’re relatively simple and don’t share stakeholder groups or timing. It will not comfortably serve a portfolio that’s grown more complex than that, regardless of how few or many initiatives are actually in it, for reasons covered next.
What spreadsheet tracking starts to hide as your portfolio grows
The specific limitation isn’t capacity in a literal sense; a spreadsheet can technically hold a hundred rows as easily as ten. What breaks is the set of questions the format can actually answer. Three facets, in particular, become invisible right when they matter most, which tend to be exactly the facets an executive audience is asking about.
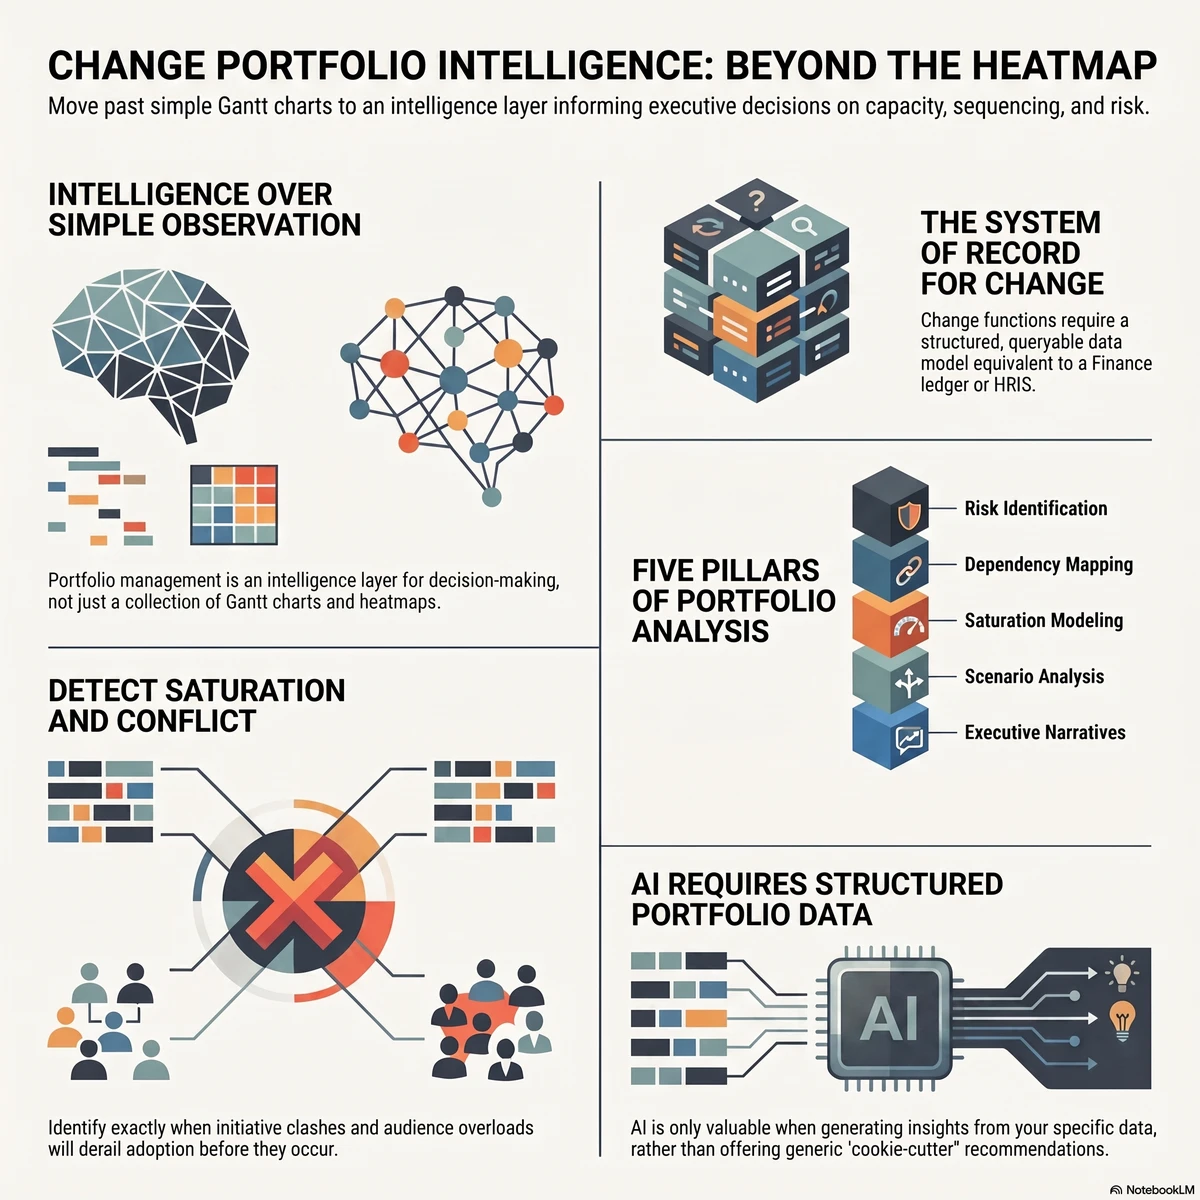
The first is aggregate load over time. A pivot table can sum stakeholder headcount for a single week if you build it correctly, but showing how cumulative change impact rises and falls across a rolling twelve-month view, filterable by division or stakeholder group, requires the kind of dynamic recalculation spreadsheets do badly at scale. This is the same underlying problem addressed by a practical methodology for measuring change saturation: saturation isn’t a property of any single initiative, it’s a property of the portfolio at a point in time, and a tool built around one-row-per-initiative structurally struggles to show it.
The second is cross-initiative conflict detection. Manually scanning a matrix for overlapping stakeholder groups, the way the July column in the timeline example above was found, works fine at six or seven initiatives. At fifteen, with multiple business units, regional variations, and shifting timelines, the manual scan either takes hours or misses things, and it usually does both.
The third is a single, trusted source of truth. The moment more than one person touches the file, version control becomes a live problem. Someone opens the file locally, someone else edits the shared copy, a formula gets accidentally overwritten, and the practitioner ends up spending real time each week confirming which version is “the” version before trusting anything in it enough to present it.
None of this is a criticism of the people building these trackers. It’s a description of what a row-and-column format was never designed to do: represent a dynamic, overlapping, many-to-many system where the same 200 people might sit inside three different initiatives at once, each with a different owner who has no visibility into the other two.
The manual cost of keeping it updated in 2026
The maintenance burden is worth being honest about, because it’s easy to underestimate how much of it is happening in the background of a busy change function.
Where the hours actually go
Every week, someone has to chase updates from initiative owners who are, understandably, more focused on delivering their own project than keeping a shared file current. Every steering committee cycle requires manually reconciling three tabs, checking totals by hand, and rebuilding at least part of the executive-facing view from scratch because the raw data was never structured to present cleanly. This is not unique to change management. Asana’s Anatomy of Work research found that knowledge workers spend roughly 60% of their time on “work about work”: chasing updates, reconciling status, and switching between tools rather than doing the work itself. Manual spreadsheet-based portfolio tracking is a concentrated version of exactly that pattern, sitting inside a function that is meant to be helping the rest of the organisation absorb change, not generating its own administrative load.
The error problem no one budgets for
The other cost is quieter and harder to see until it surfaces at the worst possible moment: error. Spreadsheet error research is one of the more consistently reproduced findings in applied computing, precisely because the format makes mistakes easy to make and hard to catch. A widely cited academic review of the spreadsheet-error literature summarised more than a decade of independent studies with the same conclusion each time: spreadsheet errors are common, not rare, and they are rarely caught by the people who made them, because a formula that returns a plausible-looking wrong number doesn’t announce itself. In a change portfolio tracker, that might mean an impact count that’s silently wrong, a stakeholder group double-counted across two tabs, or a formula that quietly stopped updating three tabs ago. None of that shows up until a number gets challenged in a steering committee, and by then it’s a credibility problem, not just a data problem.
In an environment where every other business function, from finance to sales to operations, is moving toward live dashboards and automated reporting, a change function still reconciling spreadsheets by hand each week looks increasingly like an outlier, and it is one of the more visible signals to executives that the practice hasn’t yet matured to match the rest of the business.
Why the funding conversation should be about risk and adoption, not hours saved
When practitioners eventually ask for budget to move beyond spreadsheets, the instinctive pitch is almost always about time: “this will save the team ten hours a week.” It’s true, and it’s the weakest version of the argument. Ten hours a week is a real but modest line item against most transformation budgets, and it invites an easy counter: hire an analyst, or just accept the manual work as the cost of doing the job.
The stronger argument, and the one that actually lands with a CFO or a transformation sponsor, is that a spreadsheet cannot show them the three things they are actually accountable for.
Risk
Gartner’s research on change fatigue found that the average number of major enterprise changes employees were expected to absorb rose from around two per year in 2016 to roughly ten per year by 2022, while the proportion of employees willing to support organisational change fell from 74% to 38% over the same period. That is a five-fold increase in change volume landing on a workforce that has become dramatically less willing to absorb it, and almost none of that risk is visible from an initiative-by-initiative spreadsheet, because the risk lives in the overlap between initiatives, not inside any single one. An executive asking “what’s our exposure to change fatigue this quarter” cannot get a real answer from a tool that was never built to show cumulative load across a portfolio.
Adoption
Portfolio blindness doesn’t just create fatigue risk; it actively undermines the return on the initiatives themselves. McKinsey’s research on large-scale transformations found that, on average, only about 2% of employees are directly involved in shaping a typical transformation effort, and organisations that meaningfully expand that participation see substantially better outcomes. Every initiative competing for the same finite attention, without a portfolio-level view of who is already stretched thin, makes that problem worse, not better. Adoption isn’t just a property of how well one initiative was managed; it’s a property of how much room the people affected actually had to adopt it, and that’s a portfolio-level question a spreadsheet isn’t structured to answer.
Capacity
Prosci’s Best Practices research found that 73% of organisations report being near, at, or beyond their change saturation point, largely because, as Prosci’s own analysis notes, no one in the organisation is keeping a genuine portfolio view of everything underway at once. That is precisely the gap a spreadsheet-based tracker leaves open even when it’s being maintained conscientiously: it tracks initiatives, not the cumulative capacity being drawn down across all of them.
Put those three together and the funding conversation changes shape entirely. You are no longer asking for a tool that saves the team time. You are asking for the organisation’s only reliable early-warning system for change fatigue, adoption failure, and capacity overrun across a portfolio worth, in most enterprises, many multiples of what the tool itself costs. That is the argument that gets budget approved, because it is framed in terms executives are already accountable for, not in terms of a practitioner’s weekly workload. It is also, not coincidentally, the same reframe that works when building the broader business case for change management investment: risk avoided and adoption protected are usually larger, more defensible numbers than hours saved, and they are the numbers a CFO already has a mental model for evaluating.
When to move from a spreadsheet to dedicated change initiative tracking software
There’s no single headcount that marks the exact moment to switch, and initiative count on its own is a weak signal, as the earlier reframe should make clear. A short, honest checklist gets most practitioners to the right answer. If two or more of the following are true, the spreadsheet is very likely costing more than a dedicated platform would:
You’ve moved past eight or so concurrent initiatives, or fewer than that but complex and overlapping (shared stakeholder groups, shared timing, shared business units)
More than one person needs to update or rely on the tracker
You produce a portfolio-level executive report on a recurring cycle (monthly or more often)
You’ve had, or narrowly avoided, a scheduling or stakeholder conflict between initiatives in the last quarter
Building the executive update takes longer than actually analysing what it shows
Leadership is asking questions about the portfolio (saturation, capacity, sequencing) that the spreadsheet structurally can’t answer
If that’s you, the natural next step is evaluating dedicated change initiative tracking software rather than continuing to patch the spreadsheet. That evaluation is its own piece of work, and a buyer’s guide covering the criteria that actually separate a real change portfolio tool from a generic project tracker is worth reading in full before shortlisting vendors, because the features that matter here (aggregation logic, saturation modelling, conflict detection) rarely show up clearly in a sales demo unless you know to ask for them specifically.
What a change intelligence platform gives you that a spreadsheet never can
This is where a platform like Change Compass earns its place, not as a fancier spreadsheet, but as a structurally different tool. Instead of one row per initiative that has to be manually cross-referenced against every other row, a dedicated change intelligence platform aggregates stakeholder impact automatically across every initiative in the portfolio, in real time, as initiative owners update their own data. The same 200 branch staff appearing in three initiatives in the same week shows up as a visible spike the moment the third initiative is entered, not three weeks later when someone happens to notice.
That structural difference is what the case for treating a change intelligence platform as core infrastructure actually rests on: change data, like HR data or financial data, only becomes useful at the moment it can be aggregated, queried, and trusted as a single source of truth, rather than reassembled by hand each reporting cycle. A spreadsheet can describe individual initiatives well. It cannot, by design, become that kind of system of record. Everything covered above, saturation visibility, conflict detection, a version-controlled shared view, executive reporting without a day of manual reconciliation, comes from that one structural shift, not from any single feature.
Start with a spreadsheet. Just don’t stay there.
There’s nothing wrong with building your first change portfolio tracker in Excel. It’s a genuinely good tool for six to eight simple initiatives, and the template in this guide will comfortably see most practitioners through their first year of managing concurrent change. The mistake isn’t starting there. It’s mistaking initiative count for the real signal, and staying on a spreadsheet past the point where the format can show what the organisation actually needs to see: how complex the change has become, how close the portfolio is to saturation, and where changes are overlapping on the same team, role, or business unit in the same week. Then, when the funding conversation comes, lead with risk and adoption, not hours. That’s the version of the pitch that gets funded.
Frequently asked questions
What is change initiative tracking software?
Change initiative tracking software is a purpose-built platform for managing multiple concurrent organisational change initiatives, as distinct from generic project management tools. It typically aggregates stakeholder impact data across initiatives, visualises change load and saturation over time, and flags scheduling or capacity conflicts automatically, rather than requiring manual cross-referencing.
Can I track multiple change initiatives in Excel?
Yes, and it’s the right starting point for most practitioners. A spreadsheet can comfortably handle six to eight concurrent initiatives, provided they’re relatively simple: different stakeholder groups, different timing, no real overlap. Use a three-tab structure (initiative log, stakeholder impact matrix, timeline view) with the initiative name as a shared lookup key across tabs, and set a fixed update cadence. What actually limits a spreadsheet isn’t the initiative count, it’s complexity and overlap: the same stakeholder group appearing in two initiatives in the same week is a much stronger signal that the format is breaking down than the number of tabs you’re maintaining.
How do you know when it’s time to move from a spreadsheet to dedicated software?
Two or more of the following are a reliable signal: you’ve moved well past eight concurrent initiatives, or have fewer than that but they’re complex and overlapping; you can’t say which team or role is carrying the most concurrent change this month, only how many initiatives exist in total; more than one person is maintaining the tracker; there’s a recurring executive reporting cycle; there’s been a recent near-miss on a stakeholder conflict; the executive update takes longer to build than to present; or leadership is asking portfolio-level questions (saturation, capacity, sequencing) the spreadsheet can’t answer.
What should a change portfolio funding request focus on?
Not hours saved. The stronger case is built on the three things a spreadsheet structurally can’t show an executive: change fatigue risk building up across the portfolio, adoption being undermined by initiatives competing for the same limited attention, and capacity being drawn down faster than the organisation can see. These map to risks executives are already accountable for, which makes the funding case easier to approve than a productivity argument.
How many change initiatives can a spreadsheet actually handle?
Volume alone isn’t the right measure. A spreadsheet can comfortably hold six to eight simple, non-overlapping initiatives, but a portfolio of three or four complex, overlapping initiatives will break it faster than eight simple ones will. The three questions that actually matter are how complex the changes are (not how many there are), how close the portfolio is to saturation, and whether changes are overlapping within the same role, team, week, or business unit.
What’s the difference between a project tracker and a change portfolio platform?
A project tracker, spreadsheet or software, is organised around delivery milestones for individual initiatives. A change portfolio platform is organised around cumulative impact on the people affected, aggregating stakeholder load, saturation, and adoption risk across every concurrent initiative at once, which is a structurally different question than “is this project on schedule.”
Most change management software on the market is not built for enterprise scale. It is built for a single project manager running a single initiative, then marketed up-market with the addition of a few user seats and a “team” pricing tier. When a global business with thirty active initiatives, twelve business units, and a regulator looking over its shoulder tries to deploy these tools, the gaps appear within weeks.
The procurement question for enterprise change leaders is not “which tool has the best features?” It is “which tool was actually designed for the operating environment we work in?” Those are different questions, and they produce different shortlists.
This guide is written for PMOs, Heads of Change, and HR leaders who are actively evaluating enterprise change management software in 2026. It sets out the seven non-negotiable features that distinguish enterprise-grade platforms from scaled-up SMB tools, the questions that should appear on every vendor scorecard, the red flags that disqualify a vendor regardless of how good the demo looks, and a structured compliance checklist for procurement and risk teams.
The goal is to help you make a decision that will hold up two years from now, not just to the first contract renewal.
Why enterprise change management software is a different category
The change management software market is broad and crowded, but it splits cleanly into two segments once you look past the marketing. SMB tools are designed around a single change manager working through a single initiative at a time. They optimise for ease of use, lightweight templates, and quick onboarding. For a small organisation running one or two changes a year, they are entirely adequate.
Enterprise change management software solves a fundamentally different problem. Enterprise organisations are running a portfolio of changes, often dozens at a time, against the same employee base. They have compliance obligations that constrain how data is handled and audited. They have integration requirements with HRIS, ITSM, and identity systems that the procurement team will not budge on. They need reporting that satisfies the board, not just the project sponsor.
The cost of treating these as the same category is significant. According to the Prosci 12th Edition Best Practices in Change Management report, the most mature change management functions are characterised by enterprise-wide integration, standardisation, and measurable adoption tracking across the portfolio. None of those capabilities are achievable when each project team is working in a separate tool with no aggregated view, or when a tool that was designed for one initiative gets stretched across thirty.
If your organisation is genuinely operating at enterprise scale, the seven features in the next section are not nice-to-haves. They are the criteria that determine whether the platform will be useful in eighteen months or whether it will be the tool nobody opens.
The seven features enterprise change management software must have
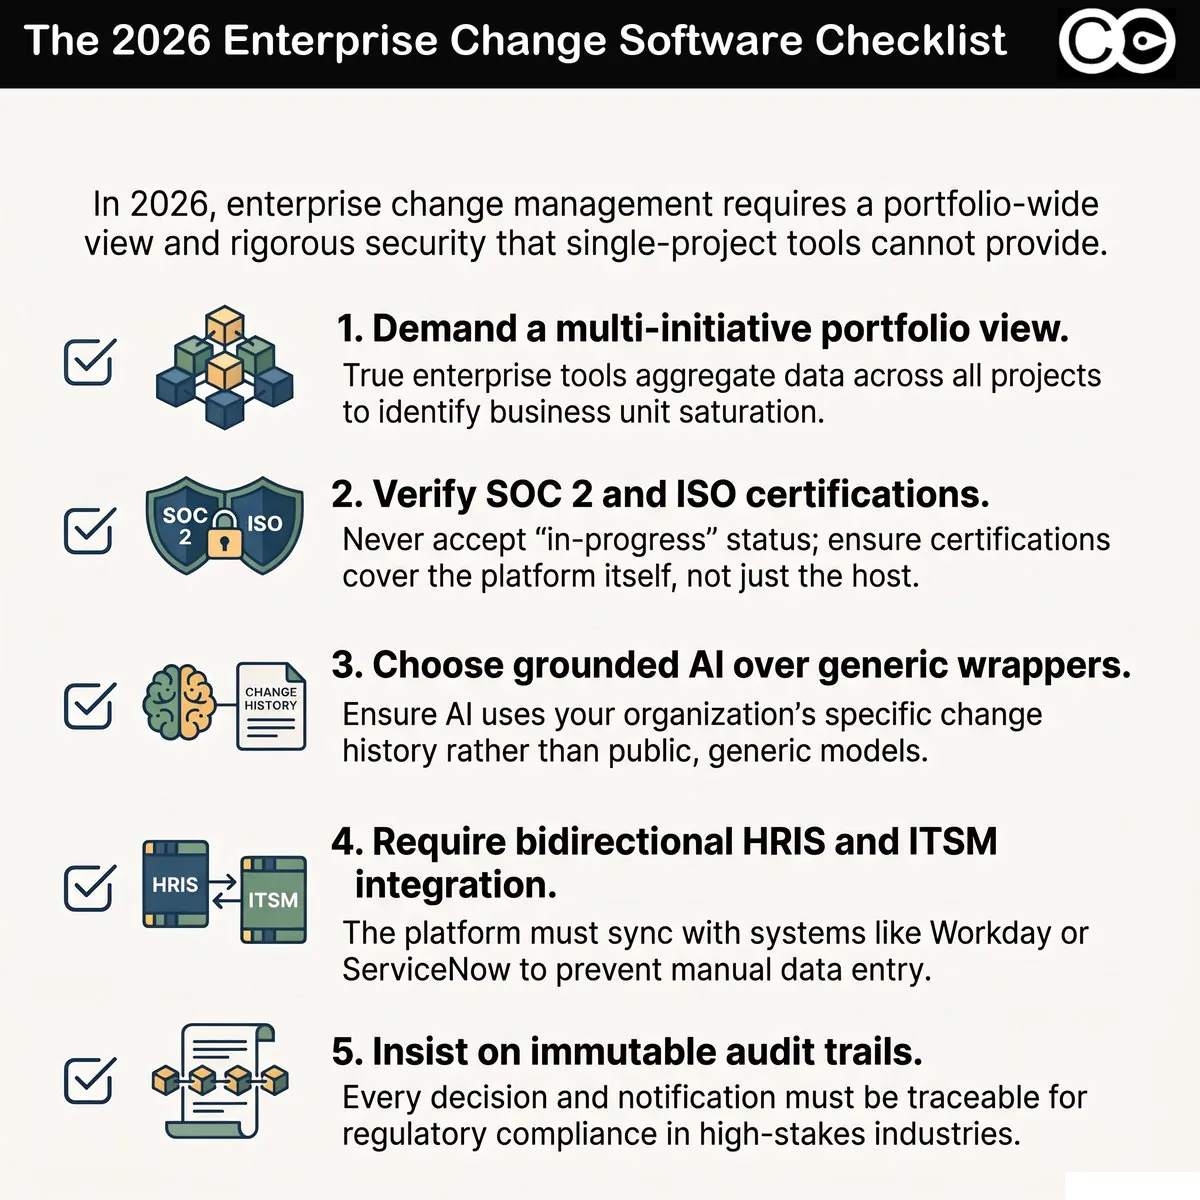
1. Multi-initiative portfolio view
The defining capability of enterprise change management software is the ability to aggregate change activity across every active initiative and present it as a single, coherent portfolio view.
This sounds obvious, but it is the feature most commonly missing. Many tools positioned as “enterprise” are still architecturally single-project. Each initiative lives in its own workspace, with its own data, its own stakeholders, and its own dashboard. Aggregation across initiatives is achieved, if at all, through manual export and consolidation.
The practical test: ask the vendor to show you, in their tool, the total change load on a single business unit across all currently active initiatives. If the demo path involves opening multiple project files and combining them by hand, you are looking at a single-project tool with enterprise pricing.
A genuine portfolio view shows initiatives, business units, and time on the same axes. It allows leaders to see immediately where saturation is approaching, where capacity is available, and where two initiatives are about to land on the same group at the same time. This capability is the foundation everything else depends on. Without it, executive reporting, sequencing decisions, and risk management all collapse back to the project level. For a PMO-focused evaluation framework covering this capability in depth, see our change management portfolio tools buyer’s guide.
2. Role-based access and governance
Enterprise organisations cannot operate on a model where every user sees every piece of data. There are sponsor groups who need executive views, project teams who need their own initiative data, business unit leaders who need their unit’s load profile, and external partners who may need limited read-only access.
A genuine role-based access control system supports configurable roles, granular permission scopes, delegated administration, and the ability to audit who changed what and when. This is not a feature that can be retrofitted. It has to be built into the data architecture from the start.
When evaluating vendors, ask how their access model handles four scenarios:
An external consultant needs read-only access to two specific initiatives but not the rest of the portfolio
A business unit leader needs write access for their division’s data but read-only access for organisation-wide reports
A senior sponsor needs the executive dashboard but no editing rights anywhere
A regulator or auditor needs a structured export of changes affecting a regulated function over a date range
If any of these scenarios produces a “we can configure that” rather than a clear demonstration in the live product, treat that as a signal that the access model is brittle.
3. Audit trail for compliance and reporting
In regulated industries, every material decision affecting the workforce or the operating model has to be traceable. When a regulator asks what change was implemented, who approved it, when employees were notified, and what evidence exists of the rollout, the answer cannot be “let me check our shared drive.”
Enterprise change management software provides a complete, immutable audit trail of changes to initiatives, decisions logged, communications issued, and stakeholder actions taken. This is a compliance requirement in financial services, healthcare, energy, government, and increasingly in any industry subject to operational resilience regulation.
The audit trail must include the user, the timestamp, the action, and the prior state. It must be exportable in a structured format. It must be retained according to the organisation’s data retention policy, and the platform must be able to demonstrate that it has not been tampered with.
This is not the kind of feature that gets demonstrated in a sales call. It needs to be verified during procurement diligence, and the vendor’s response should be a documented audit logging specification, not a verbal assurance.
4. Enterprise SSO and security standards
The procurement team will not approve a platform that requires users to maintain a separate password. Single sign-on integration with the organisation’s identity provider, typically through SAML 2.0 or OpenID Connect, is a baseline requirement. Multi-factor authentication, session management, and integration with the corporate identity lifecycle (so that when an employee leaves, their access is revoked automatically) are non-negotiable.
Beyond SSO, the platform should hold current independent certifications. The two that consistently appear in enterprise procurement requirements are SOC 2 Type II (which demonstrates ongoing operational controls over a sustained period, not just a point-in-time assessment) and ISO 27001 (which certifies the information security management system as a whole). For organisations operating in the EU, GDPR compliance and a published Data Processing Agreement are mandatory. For Australian organisations, alignment with the Australian Privacy Principles and consideration of data residency are essential.
The vendor should be able to provide their current SOC 2 report and ISO 27001 certificate on request, under NDA where appropriate. If the response involves vague language about being “in the process of certification” or relying on the certifications of underlying cloud providers (AWS or Azure being SOC 2 compliant does not make a SaaS platform built on them SOC 2 compliant), the platform is not yet enterprise-ready.
5. AI features that use your organisation’s data, not generic models
This is the feature where vendor differentiation in 2026 has shifted most significantly. Almost every change management platform now claims AI capabilities. The substantive question is what data those AI features are operating on.
Generic AI features that wrap a public large language model and prompt it with the contents of the user’s current screen are not enterprise AI. They produce generic outputs. They cannot reference the organisation’s specific change history, its previous adoption patterns, the impact profile of the affected stakeholder groups, or the load context of other in-flight initiatives. Worse, they introduce data residency and confidentiality concerns that the procurement team will scrutinise heavily.
Purpose-built AI for change management, by contrast, is grounded in the organisation’s own portfolio data, augmented with anonymised industry benchmark data, and constrained to use cases where its outputs are verifiable. It can generate executive narratives that reference real portfolio metrics, suggest sequencing options based on actual capacity data, and produce stakeholder analyses that reflect the organisation’s specific structure.
When evaluating AI features, ask three questions:
What data does the AI feature have access to, and what data is it explicitly excluded from?
Where is the inference happening, and how is the data handled in transit and at rest?
How does the vendor protect against the AI generating outputs that look authoritative but are not grounded in real organisational data?
If the answers are vague, the AI capability is most likely a wrapper, not an integrated system.
6. Executive reporting with one-click export
Senior leaders do not log into change management platforms. They read board packs, executive summaries, and one-page status reports. The platform’s value at the executive level is realised through its ability to produce these artefacts on demand, with high-quality data and minimal manual work.
Enterprise platforms provide pre-built executive reporting templates that pull live data from the portfolio, can be exported to PDF and PowerPoint with formatting intact, and can be configured to match the organisation’s branding and reporting cadence. Critically, the export should be one click, not a manual rebuild.
For a deeper treatment of the executive reporting problem and the questions executives actually need answered, the companion article on the ultimate guide to change management reports sets out a practical framework.
The diagnostic when evaluating: ask the vendor to produce a board-ready report from their tool, using real data, in front of you. If they cannot, or if the output requires manual cleanup in PowerPoint to be presentable, the platform will not save the time it claims to.
7. HRIS and ITSM integration
Enterprise change management software does not exist in isolation. The data needed to identify affected stakeholders, route notifications, and track adoption typically lives in the HRIS (Workday, SAP SuccessFactors, BambooHR) and the ITSM (ServiceNow, Jira Service Management). If the change platform cannot integrate with these systems, the change team becomes a permanent intermediary copying data back and forth.
A genuine integration is bidirectional, configurable, and supported. The vendor publishes the integration capabilities, supports common authentication patterns (OAuth 2.0, API tokens with scoped permissions), provides webhooks for event-driven workflows, and offers either pre-built connectors or a documented API for custom integration work.
The questions to ask: what HRIS integrations are pre-built and supported in production? What ITSM integrations? Is the API rate-limited in ways that would constrain enterprise use? Are integration assets owned by the customer or by the vendor (which matters at contract renewal)?
A platform without serious integration capability will become an island. The data quality will degrade, the manual reconciliation overhead will accumulate, and within a year, the change function will be working around the tool rather than through it.
Questions to ask every vendor before you sign
Vendor sales cycles are designed to highlight the platform’s strongest features. Procurement diligence has to surface the weak ones. The following questions are deliberately uncomfortable, and the quality of the responses tells you more than the polished demo.
Show me a live customer environment with at least twenty active initiatives. Can I see the portfolio view?
What is your average implementation timeline for an enterprise customer? What proportion of customers go live on or before that timeline?
Walk me through a recent enterprise customer churn. Why did they leave, and what would have prevented it?
What is your current SOC 2 Type II report period? Can your security team meet with mine before contract?
Provide three customer references at organisations of similar scale and complexity to ours, including at least one we can call without you on the line.
What does your product roadmap look like for the next twelve months, and how do enterprise customers influence it?
If we need to extract all our data from your platform, how would we do it? In what format, and how long would it take?
What is your incident response process? Show me your last status page outage report.
The answers to these questions tell you whether the vendor has been operating at enterprise scale or whether they are about to learn what that means using your organisation as the case study.
Red flags that should disqualify a vendor for enterprise use
Some signals during evaluation are reliable disqualifiers. Each of these has cost organisations significant amounts of remediation work after the contract was signed:
The product cannot demonstrate a working portfolio view across multiple initiatives in a live environment
The vendor cannot produce a current SOC 2 Type II report on request, under NDA
The data export capability is described in marketing terms but not demonstrated, or produces unstructured output
The reference customers are all SMBs, with no enterprise-scale deployments to point to
The implementation timeline is “weeks” with no enterprise-scale customisation or integration work scoped
The contract terms include automatic data ownership transfer to the vendor, or limit the customer’s ability to extract their own data
The AI capability is presented as a major differentiator but the underlying model and data flow are not disclosed
The integration story is “we have an API” without documented, supported integrations to specific HRIS or ITSM platforms
The pricing model penalises usage growth steeply enough that adopting the tool widely creates significant cost risk
If two or more of these are present, the platform is not ready for enterprise procurement. Polite withdrawal during evaluation is significantly less expensive than discovering the gaps during deployment.
The enterprise compliance checklist
For procurement and risk teams, the following structured checklist captures the controls that should be verified before contract signature. Each item should be evidenced through documentation, not just verbal confirmation.
Information security
[ ] Current SOC 2 Type II report covering a minimum 6-month observation period
[ ] Current ISO 27001 certificate with scope statement covering the platform
[ ] Documented incident response plan and 12-month incident history
[ ] Penetration testing programme with most recent test report available under NDA
[ ] Data encryption in transit (TLS 1.2+) and at rest (AES-256 minimum)
Identity and access
[ ] SAML 2.0 and/or OpenID Connect SSO support
[ ] SCIM 2.0 user provisioning and deprovisioning
[ ] Configurable role-based access control with audit logging
[ ] Three or more reference customers at comparable scale
[ ] Documented business continuity plan covering vendor failure scenarios
[ ] Source code escrow arrangement available for mission-critical use cases
This checklist is designed to be handed to procurement and security teams as a structured assessment artefact, not just a vendor conversation guide.
How Change Compass meets enterprise change management software requirements
Change Compass was built specifically for the enterprise change management software requirements set out in this guide.
The platform’s portfolio view aggregates change activity across all active initiatives and presents it at the business unit, role, and stakeholder group level, with no manual consolidation required. Role-based access control is configurable to enterprise governance models, with delegated administration and full audit logging. The audit trail meets the requirements of regulated industries, with immutable logging and structured export.
On security and compliance, Change Compass holds SOC 2 Type II and ISO 27001 certifications, supports SAML SSO and SCIM provisioning, and offers data residency options aligned to Australian, US, and EU requirements. The platform’s AI capabilities are purpose-built for change management, grounded in customer portfolio data and anonymised industry benchmarks, with documented data handling and no exposure to public model training.
Executive reporting is one-click export to PDF and PowerPoint with branded formatting. Pre-built integrations cover Workday, SuccessFactors, ServiceNow, and Jira, with a documented API for custom work. The platform is currently used by more than 50 enterprise customers, including FINRA, Northwestern Mutual, and Insurance Australia Group.
For organisations evaluating enterprise change management software in 2026, book an enterprise demo to see the platform working with portfolio data at scale.
Making the final decision
Enterprise change management software procurement is rarely about picking the platform with the most features. It is about picking the platform that will still be useful in two years, when the organisation has scaled its change function, signed up to additional regulatory regimes, and integrated change management more deeply into its operating cadence.
The decision rests on three questions. First, has the platform actually been built for enterprise scale, or is it a single-project tool with enterprise pricing? Second, will it pass the procurement and security diligence that a mature enterprise applies to any SaaS purchase? Third, will the change function be working through it or around it in eighteen months?
The vendors that survive that scrutiny are not always the ones with the slickest marketing. If you are building a shortlist, our overview of organisational change management software sets out how The Change Compass approaches these requirements. They are the ones whose product, security posture, and customer base demonstrate that they understand the operational reality of enterprise change management. That is the shortlist worth investing diligence in.
For a comprehensive overview of AI in change management
Enterprise change management software is most powerful when it includes AI capabilities grounded in your organisation’s change data. To understand how AI integrates with platform selection and fits into the broader strategy of AI adoption in change management, see our complete guide: AI in change management: the complete guide (2026).
Frequently asked questions
What is enterprise change management software?
Enterprise change management software is a platform purpose-built to manage organisational change at scale, across a portfolio of concurrent initiatives, in environments with significant compliance, security, and integration requirements. It differs from SMB change management tools by providing aggregated portfolio views, role-based access control, audit trails for regulatory compliance, enterprise SSO, AI features grounded in organisational data, and pre-built integrations with HRIS and ITSM systems.
How is enterprise change management software different from project management software?
Project management software focuses on task delivery: scope, timeline, dependencies, and resourcing for individual projects. Enterprise change management software focuses on the people side of change across the entire portfolio: stakeholder impact, adoption, capacity, sequencing across initiatives, and the cumulative load on the workforce. The two categories are complementary, not interchangeable, and most enterprise organisations need both.
What features should enterprise change management software include?
At minimum: multi-initiative portfolio view, role-based access control, immutable audit trail, enterprise SSO and current security certifications (SOC 2 Type II and ISO 27001), AI features grounded in organisational data rather than generic models, executive reporting with one-click export, and pre-built integrations with major HRIS and ITSM platforms. Tools missing any of these are not yet enterprise-ready, regardless of marketing positioning.
How long does enterprise change management software take to implement?
Typical enterprise implementations run between 8 and 16 weeks, depending on the integration scope, data migration requirements, and the maturity of the organisation’s existing change management practices. Vendors quoting “weeks” without scoping integration work or organisational change adoption are usually describing a software activation, not an enterprise implementation. The implementation is also a change initiative in its own right and should be planned accordingly.
How do you choose between enterprise change management software vendors?
Run a structured evaluation that goes beyond the demo. Insist on a live working session with real data, request reference customers at comparable scale, complete the security and compliance diligence (SOC 2, ISO 27001, audit trail, data export), test the integration capability against your specific HRIS and ITSM environment, and pressure-test the AI capability with questions about data flow and grounding. The vendor that engages substantively with all of these is the vendor that has built for enterprise.
References
Prosci: 12th Edition Best Practices in Change Management
Most change managers have tried using AI for something in the past twelve months. Drafting a stakeholder communication. Generating a change impact summary. Running a change plan through ChatGPT. And most have found that the output was adequate, occasionally impressive, but rarely transformative.
That experience has left the profession in an ambiguous position: aware that AI matters, unclear on what it should actually do, and uncertain whether the tools available today are fit for serious change work or are just productivity shortcuts dressed up as something more important.
This guide cuts through that ambiguity. It explains what AI in change management actually means, where it genuinely adds value, where it does not, and what it takes to move from ad hoc AI experimentation to a structured capability that improves outcomes. It maps the full landscape of AI applications in the field, from basic generative tools through to purpose-built change intelligence platforms, so you can make an informed decision about where to invest and in what sequence.
The two ways AI shows up in change management
Before evaluating any AI application, it helps to be precise about what we are talking about. AI appears in change management in two structurally different forms, and conflating them is the source of most of the confusion and disappointment organisations experience.
Generative AI for task acceleration
The first form is generative AI: large language model tools like ChatGPT, Microsoft Copilot, and Google Gemini applied to the drafting and synthesis tasks change managers do every day. This includes generating first drafts of stakeholder communications, producing change impact summaries from meeting notes, synthesising training content, drafting executive briefings, and producing change plans from a brief.
These tools are capable at this work when the inputs are specific, the task is well-defined, and someone experienced reviews and edits the output. They reduce the blank-page friction that slows down delivery teams and can meaningfully accelerate the documentation-heavy early stages of a change programme.
They are not, by themselves, a change management capability. Output quality depends entirely on the quality of the inputs, and those inputs are only as good as the person providing them.
Purpose-built AI embedded in change platforms
The second form is purpose-built AI: algorithms and analytical models embedded in change management platforms designed specifically for the data and decision types that change managers face at portfolio level. This includes saturation forecasting (predicting when aggregate change load will breach absorption capacity), adoption likelihood scoring (identifying which stakeholder groups are at risk of non-adoption), fatigue indexing (tracking cumulative exposure per group across all concurrent initiatives), and narrative generation grounded in your organisation’s actual change data.
This form of AI is structurally different from a general-purpose language model. It is grounded in your organisation’s change data, which is what makes it capable of producing recommendations that are specific rather than generic.
Understanding this distinction is the starting point for making sound decisions about AI adoption in change management. For a detailed analysis of where each type delivers and where it falls short, our article on what AI can and can’t do in change management works through the specifics across each use case.
What AI genuinely delivers for change managers
Setting aside the hype, there are three categories where AI creates real and measurable value for change practitioners today.
Drafting speed and cognitive offload
The most straightforward and proven benefit is acceleration of drafting work. Research from Asana’s State of AI at Work 2025 found that knowledge worker AI usage doubled from 36% to 70% between 2023 and 2025, with workers delegating approximately 27% of their workload to AI-assisted tools. For change managers, the highest-value delegation targets are the time-consuming mid-complexity tasks: stakeholder communication first drafts, change plan outlines, training needs summaries, and status report synthesis.
The key word is “drafting.” These outputs require domain review and context-specific editing before they are usable. But the productivity gain from a 70% complete, structurally sound first draft is real, especially on high-volume programmes with multiple concurrent workstreams and limited resourcing.
The discipline required is not adopting AI. It is building a review process that catches what AI gets wrong, which is always something.
Cross-initiative pattern recognition at portfolio scale
The second benefit is harder to achieve with generic tools but significant where it is available: the ability to detect patterns across multiple initiatives simultaneously. No human change manager can hold the full picture of a 30-initiative portfolio in their head, cross-referenced by impacted stakeholder group, timing, and impact type. Purpose-built AI can.
This matters because the failure modes in large portfolios are systemic, not project-level. A scheduling conflict between two initiatives landing on the same business unit in the same fortnight is invisible from inside either initiative. Behavioural contradictions, where two changes ask the same group to adopt incompatible working patterns, are nearly impossible to spot without aggregated data.
AI-powered conflict detection, as described in detail in our article on change conflict detection, surfaces these patterns before they reach the delivery phase, when they are still sequenceable rather than crisis-manageable.
Adoption forecasting and early warning
The third capability is predictive: using historical engagement, survey, and impact data to generate early-warning signals on adoption risk. Adoption forecasts at the initiative level are useful for sequencing decisions and sponsor attention. At the portfolio level, they become a governance instrument, identifying which clusters of change activity are likely to generate systemic resistance before the rollout is committed.
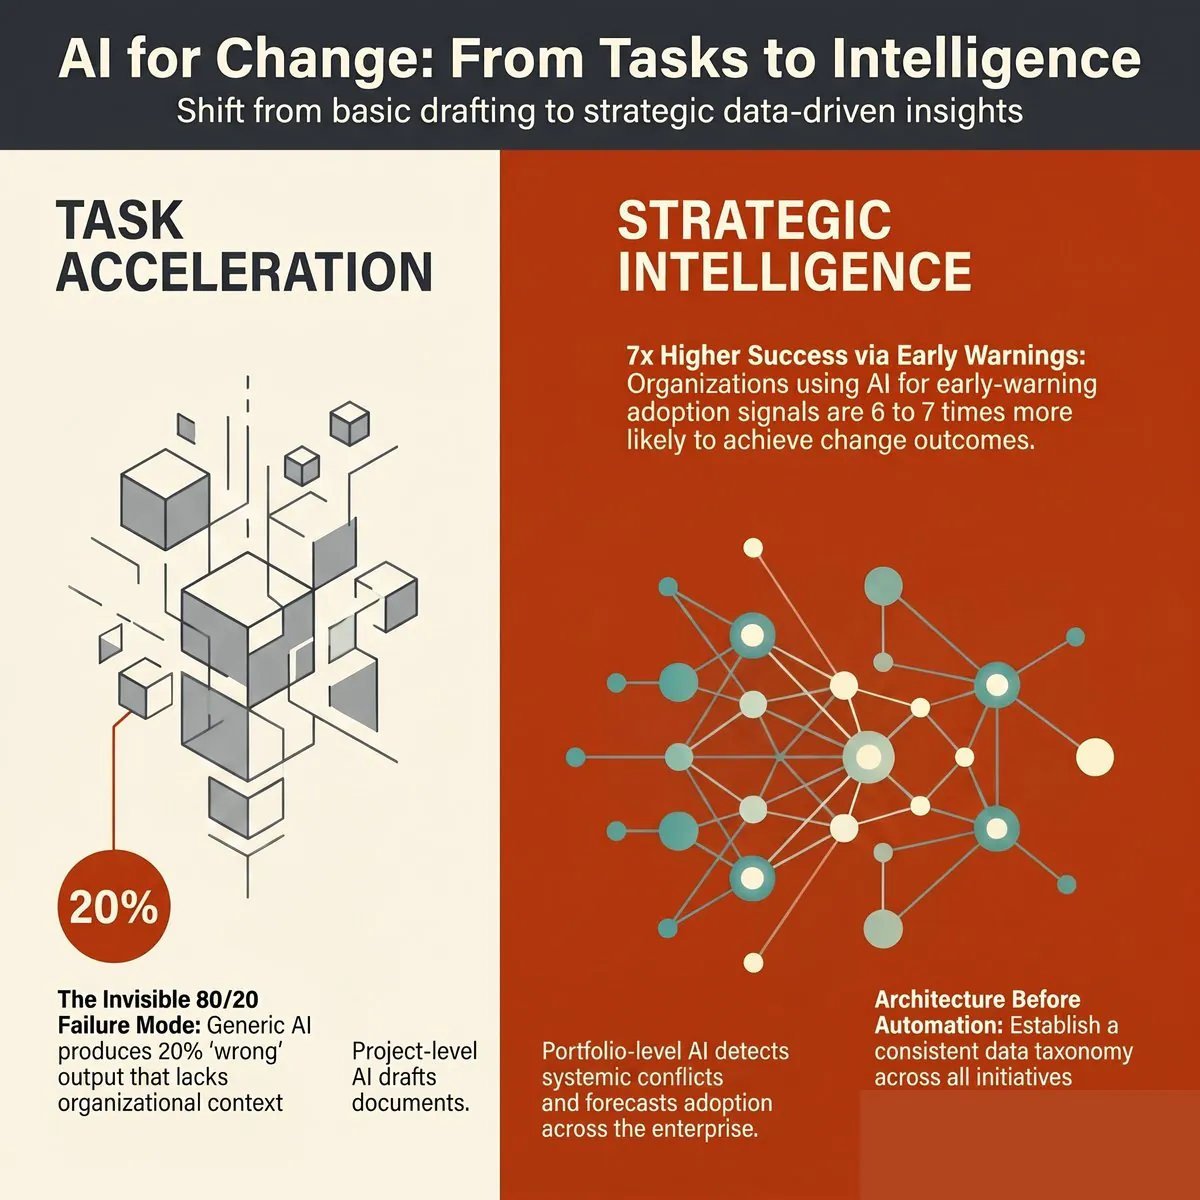
Prosci’s 12th Edition Best Practices in Change Management, drawing on data from over 10,800 change practitioners, identifies early-warning capability as one of the most significant differentiators between high-performing and low-performing change functions. Organisations that can identify adoption risk before deployment are 6 to 7 times more likely to achieve their intended change outcomes than those responding reactively.
Where AI misleads change managers (and why)
The same capabilities that make AI appealing also make it dangerous when used without the right foundations.
The 80/20 problem
Generic AI tools trained on change management best practice produce output that is typically 80% sound and 20% wrong for the specific organisation. The problem is that the wrong 20% does not announce itself. The credible 80% creates a halo effect that carries the whole output through governance.
Common manifestations include: change plans that assume sponsorship structures the organisation does not have, sequencing that does not account for the organisation’s change history, training approaches that do not match the workforce’s capability profile, and communication channels that bypass the organisation’s actual influence networks. None of these failures are obvious to anyone without deep contextual knowledge, which is precisely the knowledge that generic AI lacks.
This is distinct from hallucination, which is visible and correctable. The 80/20 failure mode is invisible at the point of output and becomes apparent only when the change reaches the impacted population. By then, the cost of correction is significantly higher than it would have been at the planning stage.
The project data trap
A related problem is the confusion between project data and change data. Most organisations have extensive project data: scope documents, risk registers, milestone trackers, budget reports. Almost none of this data describes what the change looks like from the perspective of the impacted employee.
AI grounded only in project data produces recommendations about projects. It cannot describe how 47 employees in the Melbourne operations team will experience a systems migration stacked on top of a restructure and a performance review cycle change, because that information does not exist in any project management tool.
The structural distinction between project data and change data is the most important issue to resolve before investing in any AI tool for change management. It determines whether your AI investment will produce portfolio-level intelligence or just faster versions of the same project-level documents you already had.
The two-tier model: Project-level and portfolio-level AI
The clearest framework for understanding where AI adds value in change management is the two-tier model.
Project-level AI operates within a single initiative. It accelerates task execution: generating change plans, impact assessments, stakeholder matrices, communications, and status reports from project-specific inputs. The Change Compass’s Change Automator is a purpose-built example of this, using your organisation’s structured change data as context to produce artefacts that are organisation-specific rather than generic.
Portfolio-level AI operates across all active initiatives simultaneously. It aggregates stakeholder impact, calculates saturation scores, detects scheduling and behavioural conflicts, forecasts adoption likelihood by stakeholder group, and generates executive narratives grounded in real portfolio data. This is the layer that generic AI cannot reach, because it requires a cross-initiative data architecture that no project management tool or general language model maintains.
The two tiers are complementary, not competitive. Project-level AI reduces the time change managers spend on documentation. Portfolio-level AI improves the quality of strategic decisions made by transformation leaders and executives. Together, they constitute a change management AI automation model that shifts the operating rhythm of a mature change function from reactive and document-heavy to predictive and intelligence-driven.
The most common mistake in AI adoption for change management is using only the project-level tier. This is understandable because project-level tools are more immediately tangible, but it misses the most significant value: the strategic intelligence that only a cross-portfolio view can generate.
The case for purpose-built platforms over generic AI
The logical implication of the two-tier model is that AI in change management becomes most valuable when it is grounded in structured, organisation-specific change data. This is not achievable through prompt engineering alone. It requires a data architecture designed specifically for change.
A Change Intelligence Platform is purpose-built for this requirement. It creates and maintains the system of record for change data across all initiatives, with a consistent taxonomy, structured impact fields, and aggregation capabilities that make portfolio-level AI feasible. The AI in a change intelligence platform is not a general-purpose language model with a change management persona. It is grounded in your organisation’s actual change data.
Why the data question is decisive
A 2025 IBM CEO Study, drawing on responses from 2,000 CEOs globally, found that only 25% of AI initiatives had delivered their expected ROI, and just 16% had successfully scaled. The most commonly cited obstacle was data readiness: 72% of CEOs identified proprietary data as the key to GenAI value, and 68% named integrated enterprise-wide data architecture as critical to success.
In change management terms, the bottleneck is identical. Generic AI cannot deliver portfolio-level value because the data it needs, organised change impact data aggregated across initiatives with a consistent taxonomy, does not exist in a general-purpose tool. Building that data layer is the prerequisite for the AI to do anything strategically useful.
What this means for AI adoption
The progression from “we are experimenting with ChatGPT” to “AI is improving our change outcomes” is not primarily a technology question. It is a data architecture question. Organisations that skip the data foundation step and invest directly in AI tooling find that the tools produce output that is faster but not better. The quality ceiling is set by the data, not the algorithm.
This is why early AI experimentation in change management so often disappoints: practitioners are running sophisticated tools on inadequate data, and no amount of prompt refinement resolves a structural data gap.
How to evaluate AI tools for change management
Given the two-tier model and the data architecture requirements, evaluating AI tools for change management requires a different lens than most technology evaluations. The relevant questions are not about the AI’s features in isolation but about whether the AI can access the data it needs to produce useful output.
The key evaluation criteria are:
Data grounding: Does the AI use your organisation’s actual change data as context, or does it produce generic output from training data alone?
Portfolio scope: Does the tool operate across all initiatives simultaneously, or only within individual projects?
Taxonomy consistency: Does the platform enforce a consistent classification of impact types, stakeholder groups, and change phases across all initiatives? Without this, aggregation is unreliable.
Output specificity: Can the AI produce recommendations that reference specific stakeholder groups, business units, and initiatives from your portfolio, or does it produce change management advice that could apply to any organisation anywhere?
Integration: Does the platform connect to your HRIS, project management tools, and survey platforms to enrich the change data layer with real organisational signals?
Our detailed enterprise change management software buyer’s guide covers these criteria in depth, including the compliance, security, and integration requirements that enterprise procurement and IT teams will need to address.
The most important red flag when evaluating AI tools for change management is confident specificity without data grounding. If a tool produces highly specific recommendations about your organisation’s change programme without access to your organisation’s data, it is either applying generic best practice with a superficial wrapper of specificity or generating plausible-sounding output that has not been validated against your actual context. Both produce the 80/20 problem at scale.
How Change Compass implements AI in change management
Change Compass implements the two-tier model through two connected capabilities.
At the project level, the Change Automator generates change management artefacts from your organisation’s structured change data. Change plans, stakeholder matrices, communications plans, training needs analyses, and status reports are produced using the organisation’s taxonomy, change history, and stakeholder data as context. The output is organisation-specific, which means the editing required before it is usable is significantly less than for generic AI output.
At the portfolio level, Change Compass aggregates impact data across all active initiatives to generate saturation heatmaps, per-group fatigue indices, adoption likelihood scores, and portfolio-wide conflict alerts. The AI layer operates on top of this structured data, enabling capabilities that are not achievable with a standalone language model: forecasting saturation risk before a new initiative is launched, detecting when two initiatives are creating behavioural contradictions for the same stakeholder group, and generating executive narrative that is grounded in real portfolio data.
The data flywheel between the two tiers compounds over time. Every project-level artefact a change manager creates in the platform enriches the portfolio-level data that the AI uses to generate insights and forecasts. The more consistently teams use the platform, the more specific and accurate the portfolio intelligence becomes.
Where to start: a practical adoption roadmap
For change teams at the beginning of their AI journey, a sequenced approach is significantly more reliable than attempting to adopt both tiers simultaneously or investing in tooling before the data foundation exists.
Standardise your change data model. Before AI can add portfolio-level value, you need consistent data across initiatives. Agree on a taxonomy for impact types, a classification system for stakeholder groups, and a common format for impact severity and timing. This can begin in a spreadsheet, but the goal is to move toward a platform that enforces consistency at data entry rather than relying on manual conventions.
Adopt project-level AI for acceleration. Introduce generative AI at the project level for task acceleration: communications drafting, change plan generation, and status synthesis. Establish a clear editing discipline, recognising that AI output requires domain review before it is usable. Track the time saved per task to build the internal case for further investment.
Aggregate into a portfolio view. Once you have consistent data across initiatives, aggregate it into a portfolio view. Even a static quarterly view of impacted stakeholder groups by initiative and timing provides significant value for sequencing decisions. This is the foundation on which portfolio-level AI can later operate.
Deploy portfolio-level AI for strategic decisions. With consistent data and a portfolio view established, purpose-built portfolio AI becomes feasible. Start with saturation forecasting and conflict detection, as these produce the clearest and most immediately actionable signals for senior leaders.
This progression takes most change functions 12 to 24 months to complete, depending on the starting maturity of their data practices. The investment is front-loaded in steps 1 and 3, but the strategic value compounds significantly in step 4 and beyond.
Making AI work in practice
AI in change management is not primarily a technology adoption challenge. The change managers and functions that get the most from AI are those that have already invested in the data practices that give AI something useful to work with: structured impact data, consistent stakeholder taxonomy, and cross-initiative visibility maintained in a single system of record.
The organisations that will be genuinely differentiated by AI over the next three years are not those that adopted the most tools earliest. They are those that built the data foundation that makes AI output specific, accurate, and grounded in real organisational context.
That foundation is worth building whether or not AI is the primary motivation. The visibility and strategic intelligence it creates are valuable in their own right. AI acceleration is an additional return on the same investment, and a significant one as the tools mature.
Frequently asked questions
What is AI in change management? AI in change management refers to the application of artificial intelligence, including generative AI tools and purpose-built analytics platforms, to improve the speed, quality, and strategic value of change management work. It encompasses task-level applications such as drafting communications and generating change plans, and portfolio-level applications including saturation forecasting, adoption risk scoring, and conflict detection across concurrent initiatives.
Can AI replace a change manager? No. AI tools accelerate documentation and surface portfolio-level patterns, but they cannot substitute for the stakeholder relationships, political navigation, and adaptive judgement that define effective change management. Research from Workday found that while 75% of workers are comfortable working alongside AI agents, only 30% are comfortable being managed by one. The human role in change management shifts from document production to sense-making, relationship management, and strategic counsel, which AI cannot replace.
What data does AI need to be useful in change management? AI in change management needs structured, organisation-specific change data: standardised impact classifications, stakeholder group definitions, change history, and timing data across all concurrent initiatives. Without this data, AI tools produce generic output that may be technically sound but contextually wrong for the specific organisation, producing the 80/20 problem described above.
What is the difference between a change management AI tool and a Change Intelligence Platform? A change management AI tool typically applies generative AI to individual change tasks within a single project. A Change Intelligence Platform is a purpose-built system that maintains a cross-initiative data architecture, enabling portfolio-level AI applications including saturation forecasting, conflict detection, and adoption risk scoring. The platform provides the data layer that makes AI recommendations organisation-specific rather than generic.
How long does it take to see real value from AI in change management? Project-level benefits such as drafting acceleration and time savings on documentation are typically visible within weeks of adoption. Portfolio-level benefits require consistent data collection across initiatives, which takes most organisations 12 to 24 months to establish. The strategic payoff, including predictive adoption forecasting and portfolio conflict detection, compounds significantly after the data foundation is in place.
There is an uncomfortable irony at the heart of most change management practices. Change managers are trained to help organisations plan for the human side of transition, measure adoption, track readiness, and manage stakeholder resistance. They can tell you precisely which business units are most exposed to a given change, which employee groups are furthest from readiness, and which initiatives are competing for the same people’s attention at the same time.
What most of them cannot tell you is what their function is worth in dollars.
Change management ROI (the measurable financial return that structured change management delivers relative to its cost) is the business case gap that change leaders have struggled to close for decades. Not because the value is not there, but because the data is rarely collected in a way that makes it legible to finance or the executive team. The business case gets written once, at the start of a programme, and then quietly shelved while the real work begins. By the time a senior leader asks “what did we actually get from the change team?”, the answer has to be reconstructed from memory, output logs, and adoption survey scores that nobody can connect to a dollar figure.
This article makes the case that the problem is not a lack of value. It is a lack of measurement infrastructure. And it provides a practical framework for closing that gap, one that practitioners can apply to their current programmes without waiting for a new mandate or a new budget.
Why change management is one of the few business functions that struggles to quantify its own value
Finance teams measure return on every capital investment. Marketing tracks cost per acquisition and customer lifetime value. IT reports on system uptime, incident rates, and cost per transaction. HR has moved decisively toward workforce analytics in the last decade, with turnover costs, time-to-productivity, and engagement scores now standard inputs into boardroom conversations.
Change management, by contrast, has relied primarily on activity metrics: training completion rates, communications sent, stakeholder engagement sessions held, survey scores at go-live. These are outputs, not outcomes. They measure what the change team did, not what the organisation gained as a result.
The business case problem
The typical change management business case is written before the work begins. It makes the case for investment by projecting the cost of failure: failed adoption, delayed benefit realisation, productivity loss during transition, attrition. These projections are often compelling. They are also speculative, because they are written in advance of the data.
The problem is structural. Most change managers do not control the financial data that would allow them to validate those projections later. Benefit realisation sits with the project sponsor. Productivity data sits with HR or operations. Adoption rates get reported to the project board but rarely get connected back to the financial case. By the time the programme closes, the change team has produced a substantial body of work, and has no mechanism to tie it to the outcomes the executive team cares about.
Why the data disappears
There are three reasons the ROI data gets lost:
Benefit tracking is assigned to the wrong team. Projects own the financial case. Change teams own the people case. When these are managed separately, the connection between adoption and benefit realisation is never made explicit.
The measurement points are front-loaded. Organisations invest in readiness assessment and go-live surveys, but rarely in systematic 60, 90, or 180-day post-implementation tracking. The data that would demonstrate sustained adoption, and connect it to financial outcomes, simply is not collected.
The business case is treated as a document, not a process. Once the investment is approved, the business case is filed. Nobody updates it as the programme delivers. The opportunity to demonstrate value in real time is missed.
What change management ROI actually means
Change management ROI, properly defined, is the net financial benefit delivered by structured change management investment across a programme or portfolio of change initiatives, expressed as a percentage of the cost of that investment.
The formula is conceptually straightforward:
Change management ROI = (Financial benefit delivered by change management / Cost of change management investment) x 100
The challenge is populating the numerator. Unlike a marketing campaign where you can track revenue from a specific channel, the financial benefit of change management is distributed across three layers, each of which requires a different measurement approach.
The three layers of change management ROI
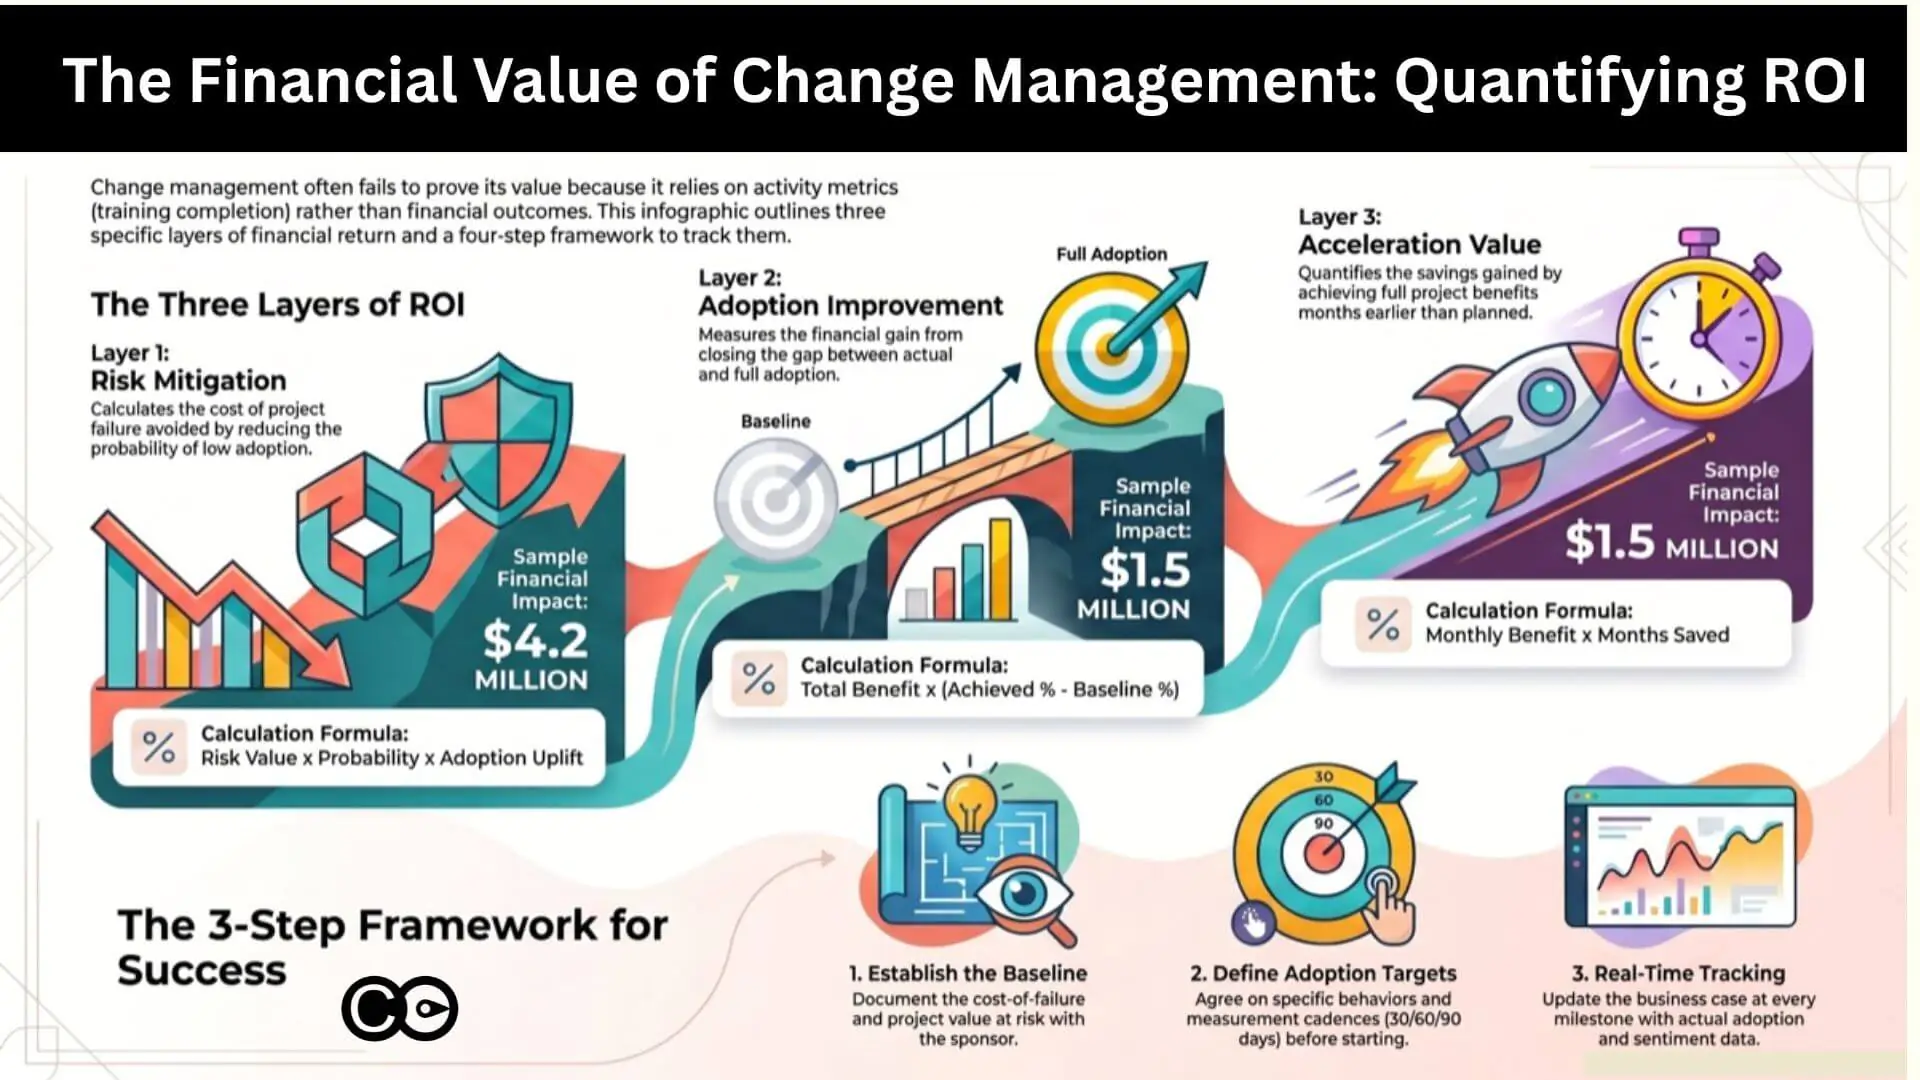
Layer 1: risk mitigation and the cost of failure avoided
The first and most immediately legible ROI layer is risk mitigation: the financial cost that structured change management prevents, relative to what would have happened without it.
The research here is clear. According to Prosci’s 12th Edition Best Practices in Change Management, organisations with excellent change management are six times more likely to meet project objectives than those with poor change management. Willis Towers Watson’s Business Case for Change Management research found that organisations managing change well are 2.5 times more likely to outperform their peers financially and achieve 3.5 times more revenue growth than those that do not.
The risk mitigation value is calculated as:
Risk mitigation value = Project value at risk x Probability of failure without change management x Adoption uplift attributable to change management
For a $20 million ERP implementation with a historically observed 30% risk of low adoption without structured change management, and where change management is estimated to reduce that risk by 70%, the risk mitigation value is: $20M x 0.30 x 0.70 = $4.2 million.
This is a conservative approach. It does not require you to prove that change management delivered the outcome. It only requires you to quantify what was at risk and apply a defensible estimate of the change management contribution. Most project sponsors will accept this framing, because it mirrors how they think about insurance: you buy it to reduce the cost of failure, and you measure its value by what did not happen.
Layer 2: adoption rate improvement and benefit realisation
The second ROI layer is adoption rate improvement. Every change programme has a gap between theoretical benefit (what the change would deliver at 100% adoption) and realised benefit (what it actually delivers at actual adoption rates). Change management’s direct contribution is to close that gap.
This connection between adoption and financial outcomes is often treated as obvious in principle and ignored in practice. McKinsey’s analysis of large transformation programmes found that 42% of projected value is typically lost in the implementation and adoption phases, not because the technology failed, but because people did not use it consistently or at all.
The adoption value calculation is:
Adoption value = Programme benefit at full adoption x (Achieved adoption rate – Baseline adoption rate without structured change management)
If a new sales system is projected to deliver $5 million in productivity gains at 100% adoption, and your change management programme moves adoption from an estimated 55% baseline to 85% achieved, the adoption value is: $5M x (0.85 – 0.55) = $1.5 million.
The baseline adoption rate is the hardest variable to establish. The best approach is to use historical data from comparable programmes in your organisation where change management was minimal or absent. If that data does not exist, Prosci’s research provides sector benchmarks. Alternatively, model it as a sensitivity range (optimistic, base, conservative) and present the range to executives rather than a single point estimate.
Layer 3: benefit realisation acceleration and time-to-value
The third ROI layer is benefit realisation acceleration. Programmes with effective change management do not just achieve higher adoption. They achieve it faster. Every month that a programme runs at partial adoption is a month of benefit that is not being realised.
The acceleration value calculation is:
Acceleration value = Monthly programme benefit x Number of months of acceleration
If a programme is expected to deliver $500,000 per month in operational savings at full adoption, and effective change management accelerates time-to-full-adoption by three months, the acceleration value is: $500K x 3 = $1.5 million.
This calculation is particularly compelling for executives who think in terms of payback periods and net present value. A programme expected to break even at month 18 that breaks even at month 15 has materially better financial performance. Change management’s contribution to that acceleration is both quantifiable and credible, because it is directly connected to the adoption data collected throughout delivery.
The change management ROI calculation framework
The three layers above give you the components. The four-step framework below gives you the structure for assembling them into a business case that executives can interrogate and validate.
Step 1: Establish the cost-of-failure baseline
Before you can claim ROI, you need a denominator: what is this programme worth if things go wrong? Work with the project sponsor to document the total programme investment, the projected benefit at full adoption, the historical failure rate for comparable programmes in your organisation, and the known risk factors such as saturation, leadership misalignment, and competing initiatives.
This baseline is what makes your risk mitigation calculation credible. It also forces an honest conversation at the start of the programme about what is actually at stake.
Step 2: Define the adoption target and measurement approach
Agree in writing with the project sponsor and executive sponsor on what “full adoption” means for this programme (behaviours, not just system logins), how adoption will be measured, what the measurement cadence will be (go-live, 30 days, 90 days, 6 months), and who owns the adoption tracking.
This step is where most business cases fail. The measurement approach is left vague, and when adoption data is not collected systematically, there is nothing to put into the ROI calculation later.
Step 3: Track and update the business case in real time
As the programme delivers, update the business case with actual data: adoption rates at each measurement point, any acceleration or delay relative to the benefit realisation schedule, incidents or productivity dips that the risk mitigation value was designed to prevent, and stakeholder sentiment data that indicates future adoption trajectory.
The business case is a living document, not a filing artefact. If your change team cannot update the financial projections with real adoption data at each governance meeting, the business case has no credibility at programme close.
Step 4: Calculate and report total change management ROI at milestones
At programme close, or at significant milestones for longer programmes, aggregate the three layers:
Total change management value = Risk mitigation value + Adoption value + Acceleration value
Net ROI % = (Total value – Cost of change management) / Cost of change management x 100
Using the worked examples above: $4.2M + $1.5M + $1.5M = $7.2 million in change management value against $800,000 in change management investment. That is an ROI of 800%.
These numbers will vary significantly by programme. The point of the framework is not to produce an impressive-looking figure. It is to produce a number that is defensible, documented, and connected to data collected throughout the programme rather than reconstructed after the fact.
Five common mistakes when building the change management business case
Even practitioners who understand the three-layer model make predictable errors that undermine the credibility of their business case. These are the most common:
Writing the business case for investment approval, then never updating it. This is the single biggest failure mode. The business case becomes a sales document rather than a measurement tool. Any ROI calculation at programme close is regarded as self-serving, because there is no audit trail of data to support it.
Using adoption metrics that do not connect to outcomes. Training completion rates and email open rates are easy to collect but hard to connect to financial value. Define adoption in terms of the behaviour change that leads to outcomes, not proxy metrics that measure activity.
Failing to establish a counterfactual. A claim that “the programme delivered $5 million in value” is not the same as “change management delivered $5 million in value.” You need a credible baseline for what would have happened without structured change management. Without it, executives will rightly attribute the value to the technology or the project team.
Treating benefit realisation as someone else’s job. Change managers often hand off to the business at go-live and stop tracking. The adoption data that would close the ROI loop gets abandoned precisely when it becomes most valuable: in the 90 to 180 days post-implementation when sustained adoption either consolidates or erodes.
Building the business case in isolation. The strongest change management ROI cases are co-developed with finance, the project sponsor, and the executive sponsor. A number endorsed by the CFO carries substantially more weight than a number produced by the change team alone, even if the underlying methodology is identical.
How Change Compass measures and reports change management ROI
One reason change management ROI has historically been so difficult to demonstrate is the fragmentation of the data. Adoption surveys live in one system. Benefit realisation tracking lives in another. Stakeholder sentiment data, if it exists at all, lives in a spreadsheet that gets emailed around and then lost.
Change Compass addresses this by collecting the data throughout the programme rather than requiring you to reconstruct it at the end. The platform aggregates adoption tracking, stakeholder impact analysis, saturation measurement, and readiness scores across the entire portfolio, and surfaces them in reporting that connects the human side of change to programme outcomes in a format executives can act on.
For one enterprise client, this approach identified over $10 million in operational risk being carried silently across five concurrent initiatives, none of which had visibility into what the others were demanding from the same employee groups. Surfacing that risk early, and enabling the portfolio team to sequence and resource more intelligently, is precisely the kind of risk mitigation value that Layer 1 of the ROI framework is designed to capture.
Rather than assembling the change management ROI calculation retrospectively, Change Compass provides the data architecture to make it a running report throughout the programme. Adoption rates, readiness indicators, and saturation scores update in real time. When the executive team asks what the change function has delivered, the answer is already in the system.
For practitioners who want to understand how to structure that data for executive consumption, the Northwestern Mutual case study on elevating change data to executive level illustrates how a large financial services organisation made this shift from retrospective reporting to real-time portfolio intelligence. And for the mechanics of presenting that output in a format executives will actually read, the guide on creating executive-ready change management reports covers the practical steps in detail.
Making the business case a continuous practice
The change management business case is not a document you write at the start of a programme to secure investment. It is a measurement practice you maintain throughout the programme to demonstrate value, course-correct when adoption is lagging, and hold the organisation accountable for the commitments it made when it approved the investment.
This is a different operating model for many change practitioners. It requires agreement with the project sponsor on what will be measured and how. It requires access to the benefit realisation data that typically sits with finance or the business owner. And it requires a discipline of updating the business case at each governance milestone, not just at the end.
The organisations that do this consistently are the ones where change management has genuine executive sponsorship, not because the change team advocated for their own function, but because the data made the case. An adoption rate that moves from 55% to 85% over 90 days, tracked in a dashboard that the executive sponsor reviews every fortnight, is its own argument.
Start with one programme. Agree the measurement approach with the project sponsor before the work begins. Collect the adoption data at every defined milestone. Build an executive change management dashboard that shows the benefit case updating in real time. At programme close, calculate the return on investment using the three-layer framework and present it with the data that supports every number.
Done once, this gives you a template. Done consistently across a portfolio, it gives you the argument that change management is not a cost centre but a return-generating investment, with the evidence to prove it.
Frequently asked questions
What is change management ROI? Change management ROI is the measurable financial return delivered by structured change management investment, expressed as a percentage of the cost of that investment. It is calculated across three value layers: risk mitigation (the financial cost of failed adoption avoided), adoption rate improvement (higher adoption rates connected to greater benefit realisation), and benefit realisation acceleration (faster time-to-value). Each layer requires a different measurement approach and its own calculation.
How do you calculate change management ROI? Use a four-step framework: first, establish the cost-of-failure baseline by quantifying what is financially at risk if adoption is low; second, define the adoption target and agree the measurement approach with the project sponsor before delivery begins; third, track and update the business case in real time with actual adoption data at each governance milestone; fourth, aggregate the three ROI layers at programme close to produce a total value figure and a net ROI percentage.
How do you build a change management business case? An effective change management business case starts with a clear articulation of what is financially at risk if the change delivers low adoption. It then quantifies the likely impact of structured change management on three dimensions: risk reduction, adoption rate improvement, and benefit realisation acceleration. Critically, the business case must be co-developed with the project sponsor and updated throughout the programme with real adoption data, not written once and filed.
What is the typical return on investment for change management? Research by Prosci and Willis Towers Watson consistently finds that organisations with effective change management are two to six times more likely to meet project objectives than those without it. The financial ROI varies significantly by programme size and sector, but a disciplined three-layer calculation framework typically demonstrates returns well above 100% for structured change management investment on large transformation programmes where the value at risk is high.
How do you justify change management investment to executives? The most effective justification frames change management as risk reduction rather than a people process. Executives respond to financial risk arguments: if this programme delivers at 55% adoption instead of 90%, what is the cost of that gap? What has happened on comparable programmes in this organisation? A co-developed business case, endorsed by the project sponsor and finance, that quantifies risk mitigation, adoption improvement, and benefit acceleration in dollar terms is substantially more persuasive than activity metrics or anecdotal claims about the value of people-side support.
A Transformation Director recently described her tool selection process to me with a sentence that has stuck. “Most vendors we evaluated showed us a Gantt chart, a heatmap and a resourcing chart, and called it portfolio management. None of them could easily tell me which of our 30+ initiatives were competing for the same audience bandwidth, and none of them could explain why our adoption scores were sliding even though delivery was on track.”
This is the gap most buyers walk into. The change management software market has grown crowded over the last three years, and almost every vendor now promises a “single view of change”. For a PMO Director with a board paper due in two weeks, the demos look reassuringly similar. They are not. The difference between a visualisation tool and a real change portfolio management platform is the difference between a basic, generic dashboard and an intelligence layer that informs the decisions your executive team makes about sequencing, capacity and risk.
This guide is written for PMO/Transformation Directors and enterprise change leads who are evaluating a change portfolio management tool in 2026. It covers what the category actually requires, why your change data is your system of record, what AI features matter (and which to walk away from), and a seven-criteria framework to use in your shortlist conversations.
What change portfolio management actually is (and what most tools are selling instead)
Let’s start with a definition. Change portfolio management is the structured, systematic discipline of managing change across the enterprise portfolio. It includes initiative-level analysis, cross-portfolio risk and opportunity identification, capacity assessment, conflict detection and visual data storytelling that informs business decision making at executive level. It is not a chart. It is a practice supported by a system, built on a defined set of change portfolio management best practices.
Most tools you will see in vendor demos are selling a slice of this. They will show you three views and stop:
A Gantt or timeline chart of initiatives plotted across the next 12 to 18 months
A heatmap of impacts by business unit or stakeholder group, usually colour-coded by month
A resourcing chart showing change practitioner allocation across the portfolio
Those three views are useful as visual artefacts. They are not portfolio management. Portfolio management is what you do with them. The vendor that shows you a heatmap but cannot help you interrogate it, model alternative scenarios, or detect the structural risks hiding inside it has given you a clipboard, not a platform. A useful test in a demo: ask “Show me where two initiatives are competing for the same stakeholder group in the same fortnight, and what the projected adoption impact is if we don’t re-sequence.”
The work a PMO is being asked to do has changed. McKinsey’s research on transformation has consistently shown that the bulk of value erosion happens in implementation, not strategy, with 42 per cent of value lost in the implementation and scaling phases. The PMO is the function closest to that loss. To prevent it, you need to do analysis, not just observation.
The portfolio analysis layer most tools skip
The work that turns visualisation into intelligence sits in five activities:
Risk and opportunity identification across the portfolio (where are we exposed, where are we under-using capacity)
Cross-initiative dependency mapping (which initiatives share the same audience, the same systems, or the same critical resources)
Saturation and capacity modelling (what is the true change load on each business unit at each point in time, and where does that breach safe thresholds)
Scenario analysis (if we delay initiative X, what does the load profile look like, and which audiences benefit)
Executive narrative development (how do we tell this story in one slide that drives the right decision)
A change portfolio management tool earns the name when it can support all five. Anything that stops at heatmaps and Gantt charts has stopped at observation.
Why your change data is your system of record
Here is the part most PMO conversations skip. Every other corporate function has a system of record. HR has its HRIS. Finance has its general ledger. Operations has its ERP. Risk has its GRC platform. Change is the only enterprise function still routinely run out of spreadsheets, slide decks and project management tools repurposed for portfolio reporting.
This matters more than it sounds. The system of record is not the tool. It is the authoritative source of data on which decisions are made. When the CFO needs to know the cash position, they don’t ask three teams to email their numbers and reconcile them in Excel. They look at the ledger. When the CHRO needs to know headcount, they look at the HRIS. The PMO is the function that should be the system of record for change data, and most PMOs aren’t, because they don’t have a tool that can hold the data in a structured, queryable, executive-ready form.
Why is this the foundation? Because the data informs everything that comes after it. The approach you recommend to the business, the sequencing decisions you make, the capacity warnings you raise, the readiness conclusions you draw. All of these are only as credible as the data underneath them. If your data lives in fragmented spreadsheets owned by individual change managers, your recommendations are anecdotal. If your data lives in a structured portfolio platform with consistent impact frameworks, audience taxonomies and historical patterns, your recommendations are evidence-based. The platform is upstream of the conversation.
This is also why a change portfolio tool is fundamentally different from a project management tool. Monday, Smartsheet and similar platforms are excellent at task tracking and team coordination. They are not designed to hold change data as a system of record. The fields they track (task, owner, status, due date) are not the fields a change leader needs to make portfolio decisions (impacted audience, change type, adoption risk, saturation contribution, dependency map). Trying to bolt change portfolio management onto a project management tool is like trying to run payroll out of Trello. It will technically work for a while, and it will fail at scale.
For a fuller treatment of why the change function deserves its own intelligence layer rather than a project tool with extra columns, the change intelligence platform pillar article goes deeper into the architecture.
Why standard charts cannot tell your story
The second area where tools quietly fail is data visualisation. The PMO’s job is not to display data. It is to influence executive decisions using data. Those are different jobs, and they need different visualisations.
Most vendors offer a fixed set of charts: a Gantt timeline, an impact heatmap, a resourcing bar chart, possibly a stoplight summary. These are fine for an analyst staring at a screen for ten minutes. They are not what a CEO needs to see in a 5-minute portfolio update.
The complexity of an enterprise change portfolio is genuinely high. You are simultaneously tracking initiatives with different start dates, different audiences (sometimes overlapping, sometimes nested), different change types, different risk profiles, different dependencies and different stages of maturity. A standard chart library can show you any one of those dimensions. None of them can show you the story you need to tell, which is usually two or three of them intersected.
What this means in practice: the data visualisation in a real portfolio tool needs to be flexible. You need to be able to filter, slice, overlay, drill down and reshape the view to match the question being asked. The CFO has a different question to the COO. The board wants a different cut to the divisional MD. The sequencing committee needs to see something different to the audit committee. If your tool gives you the same three charts for all of them, you are doing manual translation work every week that a properly designed platform would do in real time.
A practical test: in your shortlist demos, ask the vendor to build a chart that shows you the top five stakeholder groups by impact load over the next quarter, then layer in the projected change saturation score for each, then highlight which initiatives are driving the highest contribution. If the answer is “we’d need to build a custom report”, you’ve found the ceiling. If they can do it live in the platform, you’ve found a real visualisation engine.
The principle is straightforward: complex change demands flexible visualisation. The story changes, the audience changes, the question changes. The chart must change with it, and one glance must do the work.
AI features: what to look for, what to avoid
If you are evaluating change portfolio tools in 2026 and AI is not on your criteria list, your evaluation is out of date. The PMO use cases for AI fall into two buckets, and both matter:
Reducing manual effort. A change portfolio generates an enormous volume of administrative work: drafting impact statements, summarising initiative updates, normalising data from different change managers, generating stakeholder communications, building first-cut readiness assessments. A capable AI layer should automate large parts of this without removing the change manager from the loop.
Generating insight. This is the higher-value bucket and the one most providers are weaker on. The AI should be able to look across your portfolio and tell you things you wouldn’t have spotted by hand: emerging saturation hotspots, audience groups whose risk profile has shifted, initiatives whose adoption trajectory is diverging from the plan, dependencies that have moved into the critical path.
Both buckets require one thing the vendor demos often skip past: your data. This is the point many PMOs miss when they’re comparing tools against ChatGPT or Copilot. General AI tools cannot do portfolio-level work for you because they have no portfolio data. They can draft a generic impact statement. They cannot tell you that your Q3 SAP rollout is the third initiative landing on Operations in eight weeks and that adoption is at risk because Operations is already at 87 per cent of safe load. The data is what makes the AI useful.
There is a sharper version of this point worth making to your executive team. General-purpose AI tools used without your organisation’s change data will give you cookie-cutter recommendations. The bigger risk is not that the recommendations are generic. It is that they are confidently wrong, in a way that sounds plausible enough to act on. A general model with no context about your portfolio will recommend an approach that’s wrong for your sector, your maturity, your stakeholder base or your sequencing reality. The cost is not the bad recommendation. The cost is the time spent going down a wrong path because the recommendation sounded sensible. We treat this risk in more depth in the companion piece on AI change management automation, which explains the architecture difference between general AI and a change-data-informed AI layer.
What this means for your buyer’s evaluation:
The AI features must be trained on or fed by your portfolio’s structured change data, not bolted on as a generic LLM wrapper
The vendor should be able to demonstrate insight generation, not just text generation (drafting a paragraph is table stakes; spotting a saturation risk is differentiation)
There must be a clear and consistent path for human-in-the-loop review on any AI-generated recommendation that flows to executives
The AI must explain its reasoning (what data did it use, what assumptions did it make), so the change leader using it can defend the recommendation in the room
The vendor that says “yes, we have AI” without being able to demonstrate the data plumbing is, with respect, behind. AI without your data is generic by definition.
The seven criteria for evaluating a change portfolio management tool
If you take one artefact from this article into a shortlist conversation, take this. These are the seven evaluation criteria we recommend PMO Directors use, in priority order. Each is followed by a question to ask in the demo.
#
Criterion
Question to ask in the demo
1
Portfolio analysis depth
“Show me how you identify cross-initiative risk and opportunity, not just where you display it.”
2
Data as system of record
“What is the data model? Can it hold consistent impact, audience and saturation data across all initiatives, regardless of who entered it?”
3
Flexible data visualisation
“Build me a chart now, live, showing X dimension intersected with Y dimension for the top Z audiences.”
4
AI features informed by portfolio data
“Demonstrate one insight the AI surfaced that a human wouldn’t have spotted.”
5
Executive-ready outputs
“Show me the slide or dashboard you would put in front of my CEO. Can it be filtered by their question in real time?”
6
Saturation and capacity modelling
“How do you measure saturation? Is it a real model with thresholds, or a colour applied to a heatmap?”
7
Conflict and dependency detection
“Show me where two initiatives are competing for the same audience in the same window. Did the platform flag it, or did I have to find it?”
The order matters. A platform can have beautiful visualisations and weak data. A platform with weak data will mislead you. Start at criterion two if you’re tight on time. If the data model doesn’t hold up, nothing built on top will.
A few of these are worth a closer look.
Saturation and capacity
Change saturation is the single biggest cause of preventable adoption failure. Prosci’s research and our own client data consistently show that organisations that exceed their safe change load see a measurable drop in adoption rates, often well before any single initiative shows red on its individual report. The portfolio view is the only place this risk becomes visible.
A real saturation model has thresholds (per audience, per role, sometimes per geography), tracks contribution by initiative, and forecasts forward. A fake saturation feature is a heatmap with three colours. Make sure you can tell the difference. For more on the model, see our practical methodology for measuring change saturation.
Conflict and dependency detection
The structural problem with most enterprise change portfolios is not that the initiatives are individually badly run. It is that they are individually well run, on parallel tracks, by teams that never see each other’s stakeholder lists. Conflict detection is the platform capability that makes the hidden visible. Two initiatives competing for the same business unit in the same fortnight is a problem you cannot solve if you cannot see it. The right tool surfaces this automatically, not on request.
Executive reporting
The most overlooked criterion. Your tool is doing one of two things at executive level: making you look credible, or making you look like the spreadsheet team. There is no middle. The platforms that win at this layer let you generate executive views in real time, filter them live in the meeting, and answer questions on the spot. The ones that lose make you go away, build a slide and come back next week.
For a worked example of what executive-grade reporting looks like at a Fortune 500 financial services firm, see our case studies on elevating change data to the executive table.
The vendor landscape: what’s actually out there
The change portfolio management category includes four kinds of tools that PMOs commonly evaluate. None are equivalent.
1. Project and work management platforms (Monday, Smartsheet, Asana, Jira, Microsoft Project). Strong at task tracking, team coordination and basic Gantt visualisation. Weak at change-specific data structures (impacted audience, change type, saturation contribution) and almost universally weak at portfolio-level analytics. Useful as your delivery tool. Not a change portfolio platform. The common failure mode is the PMO that tries to retrofit Monday with custom columns and reports, ends up with a high-maintenance spreadsheet, and concludes “tools don’t work for change”. The tool wasn’t built for change.
2. HR analytics and employee experience platforms (Workday Adaptive, Visier, Glint, Culture Amp). Strong at employee sentiment, engagement data and HR analytics. Weak at initiative tracking and portfolio composition. Useful as a complementary data source feeding readiness insights. Not a portfolio platform on their own.
3. General-purpose AI tools (ChatGPT Enterprise, Copilot, Claude, Gemini). Strong at text generation, drafting and conversational analysis. Weak at portfolio data management because they don’t have your data. Useful as a productivity layer for individual change managers. Not a portfolio platform.
4. Purpose-built change portfolio platforms (The Change Compass and a small number of others). Designed from the data model upwards for change portfolio work: change-native fields, structured audience taxonomies, saturation modelling, cross-initiative analytics, AI insight layer informed by portfolio data, executive-grade visualisation. This is the category to evaluate against your seven criteria.
This taxonomy matters because the wrong category will look adequate in the first 90 days. The cracks show at scale, when the portfolio grows past 20 to 30 active initiatives, when the executive team starts asking forward-looking questions, and when adoption issues start surfacing that the tool cannot diagnose.
A short list of things that should slow your evaluation down, not speed it up:
The demo shows the same three charts (Gantt, heatmap, resourcing) and the vendor calls it portfolio management
The vendor cannot answer how their AI uses your data (the answer “we use OpenAI’s API” is not an architecture)
The data model is not visible or not explained, or every customer apparently configures it from scratch
Saturation is described but not measured (no thresholds, no model, just colour)
Executive reporting is “we’ll build you a custom dashboard” rather than a real-time configurable view
Conflict and dependency detection requires a custom report or human analysis to surface
The vendor’s reference customers are all individual change managers, not PMO Directors or transformation leaders
Pricing is not anchored to data volume or portfolio size, which usually means it will become anchored to them later
None of these is fatal on its own. A pattern of three or more should make you go back to the brief.
What the right tool actually does for you
The point of all of this is not the tool. It is the outcomes the right tool unlocks. A real change portfolio management platform should move the needle on three things:
Systemic change capability. Not the capability of individual change managers, who are usually competent. The capability of the function as a whole to do portfolio-level work consistently. A platform with a real data model lifts the floor of the function. Less time spent reconciling spreadsheets, more time spent on analysis, advisory and influence.
Adoption and readiness. The downstream measure. Better data leads to better sequencing decisions, better load management, better stakeholder conversations and better readiness preparation. Better readiness preparation leads to better adoption. The mechanism is upstream. The result is adoption rates that move because the underlying conditions move.
Executive influence. The metric most PMO Directors quietly care about. Your change data, when held in a system of record and visualised flexibly, becomes a data set the executive team treats as authoritative. The conversation moves from “the change team is asking us to slow down” to “the portfolio data shows we are at 92 per cent capacity in Operations next quarter, here is the sequencing recommendation”. This is the shift Northwestern Mutual described in their work with us: change data elevated to the same level of visibility and priority as financial and operational data.
The Change Compass is the platform we’ve built for this category. We exist because PMO Directors at firms like Northwestern Mutual, IAG and NiSource told us the tooling they had wasn’t enough. We aren’t the only option you should evaluate. We are the option you should benchmark the rest against. If you’d like to see what a purpose-built change portfolio platform looks like applied to your portfolio, our team runs PMO-focused demos that walk through the seven criteria above using real data structures. Book one, or pressure-test your shortlist against the criteria with your own internal team. Either way, the framework is what matters.
Where to start
If you take one action from this article, make it this: before you sit through another vendor demo, write down the three portfolio questions your executive team is asking that your current tooling cannot answer cleanly. Maybe it’s “are we going to overload Operations next quarter”. Maybe it’s “where are two initiatives quietly competing for the same audience”. Maybe it’s “what’s our forward 12-month saturation curve and where does it breach”. Bring those three questions to every demo. Ask each vendor to answer them live, with their tool, using a portfolio data set, not a slide deck. The right tool will answer at least two of them in the demo and show flexibility in catering for audience needs.
The category is changing fast and the gap between the visualisation tools and the real portfolio platforms is widening, not narrowing. Choose the platform that treats your change data as a system of record, makes it flexible to visualise, applies AI on top of it rather than instead of it, and gives you outputs your executive team actually uses. That’s the buy that pays back. Anything less is a clipboard. If your executive team still needs convincing that portfolio data belongs on their agenda, our guide to building change portfolio literacy in senior leaders covers how to bring them along.
What is a change portfolio management tool? A change portfolio management tool is a software platform built specifically to hold, analyse and visualise change data across an enterprise portfolio of initiatives. It is distinct from a project management tool (which tracks tasks and timelines) and from a general BI or analytics tool (which lacks change-specific data structures). It supports portfolio-level activities such as risk identification, capacity and saturation modelling, conflict and dependency detection, and executive reporting.
How is change portfolio management different from project portfolio management? Project portfolio management focuses on delivery: what initiatives are running, who owns them, what milestones are due, what budget is committed. Change portfolio management focuses on the people-side outcomes: which audiences are impacted, by what change types, at what load, with what adoption risk. The two are complementary, but the data structures and the analytical questions are different. A PPM tool tells you whether projects are on track. A change portfolio tool tells you whether your organisation is on track to absorb them.
Do general AI tools like ChatGPT or Copilot replace the need for a change portfolio platform? No. General AI tools are useful for individual productivity tasks (drafting communications, summarising notes, generating first-cut content). They are not portfolio platforms because they don’t hold your change data as a system of record. Recommendations from general AI tools without your portfolio data tend to be generic at best and confidently wrong at worst, because they have no context for your sector, your maturity, your stakeholder base or your sequencing. The two tool categories are complementary, not substitutes.
What is the most important criterion for choosing a change portfolio tool? The data model. A platform with a strong data model can be improved everywhere else; a platform with a weak data model can never be saved by features bolted on top. Ask the vendor to explain how the platform holds impact data, audience taxonomies, saturation contribution and dependencies in a consistent, queryable structure. If they cannot explain it clearly, that’s your answer.
How long should a tool evaluation take? For an enterprise PMO, expect six to twelve weeks from shortlist to decision. The two highest-leverage activities in that window are: (a) running a pilot against your real portfolio data, not a demo data set, and (b) interviewing two or three reference customers at PMO Director level, not change manager level. Skipping either of those will cost you more later than they cost you now.
We use cookies to improve your experience and understand site use. Marketing cookies stay off until you accept, and in the EU, UK and Switzerland analytics does too. Cookie Policy.
Strictly necessary
Required for the site to work: security, load balancing, and remembering your choices. These cannot be switched off.
Always active
Analytics
Google Analytics and similar, so we can see which pages are useful and where visitors get stuck. Aggregated, never sold.
Marketing
Used to measure campaigns and show relevant content on other platforms such as LinkedIn.