Updated 26 January 2025
A lot of change practitioners are extremely comfortable with saying that change management is about attitudes, behaviours, and feelings and therefore we cannot measure them. After all, a big chunk of change folks are more interested in people than numbers. This metaphor that change management is ‘soft’ extends into areas such as leadership and employee engagement whereby it may not be easy to measure and track things. However, is it really that because something is harder to measure and less black and white that there is less merit in measuring these?
“If you can’t measure it you can’t improve it” Peter Drucker”
In today’s fast-paced business environment, measuring change is no longer about static reports or manual tracking. With advancements in AI and automation, organisations can now leverage real-time data analytics, predictive tools, and automated insights to manage change effectively. This guide explores how these technologies are reshaping the way we measure and manage change.
The ‘why’ behind a lot of industry changes in our day and age come from the fact that data is now dominating our world. Data is a central part of everything that is changing in our world. Since we are now more reliant on the internet for information, the data that can be collected through our digital interactions around our lives are now driving change.
Data and measurement is all around us. In fact our world would not exist without them. Without data and measurement our phones would not work, our home security features would not work, TV stations would not function, the internet would not be on, lifts would not work and even traffic lights would not work.
At the workplace, most corporate work functions and departments rely on data to run and manage the business. HR, Finance, Operations, Manufacturing, Risk, Procurement, IT, etc. The list goes on. In each of these departments data is an essential part of the day to day running of the function, without which the function cannot be run effectively. They would not know if the performance is hitting targets.
Now with AI, companies are focused on data at an even greater level more than ever. Without data, AI cannot work nor add value to organisations. The backbone of AI is the ability to access vast amounts of data so that this can be used to automate and help us with our lives.
So if our world is surrounded by data, why are we not measuring it in managing change? To answer this question let’s look at what we are or are not measuring.
Starting at a project level, these are some of the common ways in which change is often measured:
1. Change readiness surveys
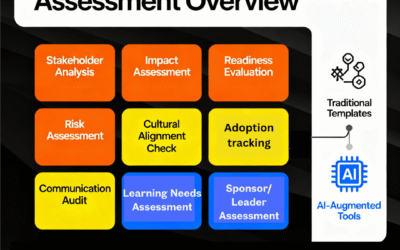
Change readiness surveys are usually online surveys sent by a project owner to understand how stakeholder groups are feeling about the change at different points in time throughout the project. It can be in the form of a Likert scale or free text. Most results are summarized into a quantitative scale of the degree in which the group is ready for change. A simple SurveyMonkey or Microsoft Form could be set up to measure stakeholder readiness for change.
It used to be that change readiness surveys were quite long and wordy. Nowadays, a lot of change practitioners prefer to have shorter ‘pulse’ surveys as a way to regularly check on the stakeholder sentiments for readiness. However, shorter surveys could mean a lack of depth in the feedback you are receiving and limited data to use to pivot as necessary to address any concerns. So, you may find out if your stakeholders are ready for change, but not why. Ensure you balance ease and speed with insight and outcome.
The purpose of using change readiness surveys is to assess the stakeholders’ readiness for change. The results from the survey will definitely inform the levels of readiness. However, the survey itself may not be sufficient to conduct the assessment. Simply asking what stakeholders feel may not be a holistic way of assessing their readiness. To read more about conducting change readiness assessment strategically check out our article Beyond the Survey: A Strategic Lens on Change Readiness Assessment.
2. Training evaluation surveys
These evaluations are normally based on participant satisfaction across various categories such as content, instructor effectiveness, usefulness, etc. In a face-to-face training format, these surveys are normally paper-based so as to increase the completion rate. For online or virtual training, ratings may be completed by the user at the conclusion or after the session.
Considering that most organisations use virtual training formats, it is good practice to incorporate training evaluation at the conclusion of the session before the participants leave (after which it is almost impossible to get the satisfactory level of participant responses).
With the range of digital/AI-enabled tools on offer now, you can design training sessions in a way that requires much less and effort and gives you better results (to read more check out this link from Forbes). Some of these features include:
– gamifying training content to make it more engaging, interesting and fun
– easily creating micro-courses with little instructional design expertise
– incorporate a range of media such as videos and pictures with little effort
– using avatars as instructors to host the content
– easily create quizzes and assessments (check out Change Automator feature to conduct assessments)
3. Communications metrics
One way in which communications may be measured is the ‘hit rate’ or the number of users/audience that views the article/material/page. This may be easily tracked using Google Analytics which not only tracks the number of views per page but also viewership by the time of day/week as well as audience demographic information as such gender and geographical locations.
There is also a range of digital tools on offer to track the effectiveness of communication efforts. With Microsoft applications such as Yammer and Teams, there is already rich analytics capabilities on offer. These include user/group activity, device type usage, etc. Speak to your IT counterpart to access Microsoft Viva Engage which help you measure your community’s reach and engagement. You can find out more about the people, conversations, and questions & answers that make up your targeted communities.
There are also ways to A/B Test your communications message, whereby you have 2 different messages and test this with a smaller group fo audience to see which ones resonate or lead to more action. You can also create 2 different versions of the same intranet page and test messaging this way. When you have concluded the test you can then select the ‘winning’ version to the broader set of audience. Speak to your corporate communications colleague to get their help to implement this.
4. Employee sentiments/culture surveys
There are some organizations that measure employee sentiments or culture over the year and often there are questions that are linked to change. These surveys tend to be short and based on a Likert scale with fewer open-ended questions for qualitative feedback. Since these surveys are often sent across the entire organization they are a ‘catch-all’ yardstick and may not be specific to particular initiatives.
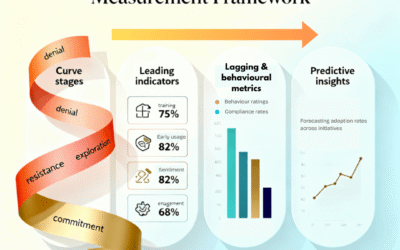
There is now a range of AI tools to do text and sentiment analysis if your survey contains text items. AI-powered tools now enable organisations to measure change through advanced metrics such as predictive capacity analysis to forecast resource strain, sentiment analysis to gauge stakeholder emotions in real time, and automated risk assessments that identify potential bottlenecks before they occur All the major technology providers such as Microsoft, Amazon and IBM already provide these tools (some are even free).
These are some of the ways you can use AI tools right now:
– detect a range of emotions such as anxiety, anger, and disgust and based on response statistics through sentiment analysis
– cluster topics based on key response themes
– identify any data anomalies that you may want to exclude
– identify and label tone of voice of the responses, and classification such as positive, neutral, negative
– analyse trends over time
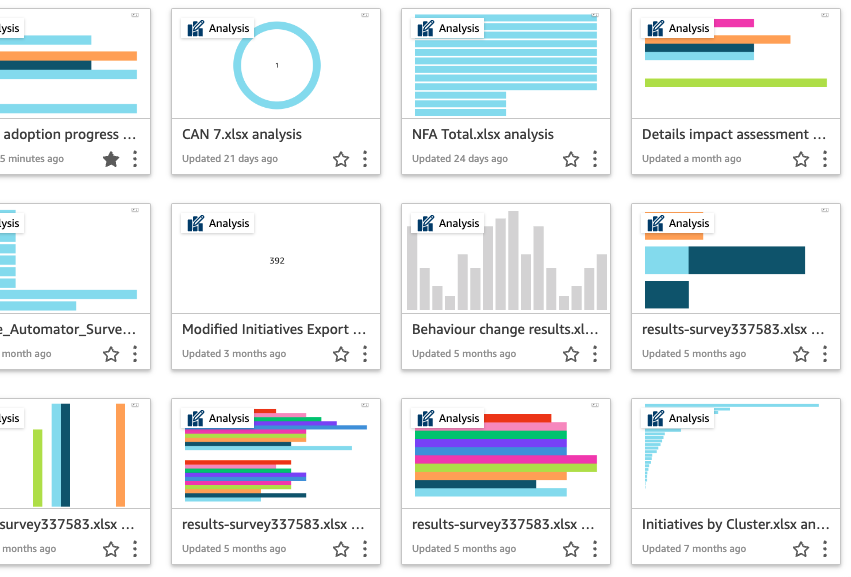
Data analysis and reporting can also be easily leveraged with the range of digital tools on offer. Data analysis tools using AI can automated generate charts and dashboards for you with little effort. Change Automator contains rich survey features that do exactly this, including:
– Easily selecting chart type with one click
– Leverage from AI-suggested data insights
– Generate predictive trends based on existing data
– Easily share charts and dashboards using different ways, including using a URL link
5. Change heatmaps
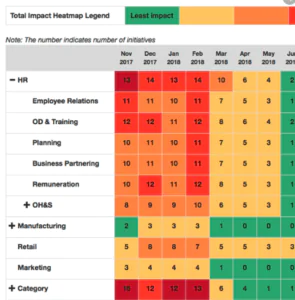
Some organizations devise change heatmaps on excel spreadsheets to try and map out the extent to which different business units are impacted by change. This artifact speaks to the amount of change and often leads to discussions concerning the capacity that the business has to ‘handle/digest’ change. The problem with most heatmaps is that they are usually categorised and rated by the creator of the artifact (or a limited number of people making judgments), and therefore subject to bias. Data that is based on 1 person’s opinions also tend not to have as much weight in a decision-making forum.
In fact, we highly recommend that you don’t use change heat maps as the only way to track change volume. Instead, there is a range of other visuals such as bar charts, and timeline charts that are just as easy to interpret and are more insightful from a decision-making perspective.
Heatmaps are also by design categorical and not particularly precise. It may be useful at a high level for understanding hot spots, but not one to use to make specific decisions concerning business capacity levels and corresponding challenges.
The following is an example of a Change heatmap that uses the standard red, amber green traffic light coding scheme. This may play into the psychological bias of your audience interpreting red as bad and only focus on ‘alleviating’ the red.
6. Change initiative benefit tracking
In addition to typical change management measures, there are various initiatives-specific measures that focus on the actual outcome and benefit of the change with the goal of determining to what extent the change has taken place. Some examples of this include:
-
System usage rates
-
Cost reduction
-
Revenue increase
-
Transaction speed
-
Process efficiency
-
Speed of decision-making
-
Customer satisfaction rate
-
Employee productivity rate
-
Incidents of process violation
Example: Project based change management dashboard from Change Automator

Non-initiative based change management measures
There are two other measures that are used within an organizational vs. initiative-specific context, change leadership assessment and change maturity assessment. In the next section, we will discuss these two areas.
Change leadership assessment
David Miller from Changefirst wrote about 3 types of change leaders.:
1. The sponsor whose role is to drive the initiative to success from the beginning to the end. This involves possessing competencies in rallying and motivating people, building a strong network of sponsors, and communicating clearly to various stakeholder groups.
2. The influencer whose role is to leverage their network and influence to market and garner the traction required to make the initiative successful. Four types of influencers as identified by Changefirst includes:
a) Advocates who are great at promoting and advocating the benefits of the change
b) Connectors who are able to link and leverage people across a part of the organization to support the change
c) Controllers who have control over access to information and people and these could include administrators and operations staff
d) Experts who are viewed by others in the organization as being technically credible
3. The change agent is someone who is tasked with supporting the overall change in various ways, including any promotional activities, gaging different parts of the organization on the change and be able to influence, up, down and sideways across the organization to drive a successful change outcome. Some call this the ‘change champion’. They can be your key to influencing across the organisation.
Whilst there isn’t one industry standard tool for assessing change leadership competencies and capabilities. There are various change leadership assessment tools offered by Changefirst as well as other various smaller consulting firms. Some of the ways in which you can assess change leadership may include categories such as Goal Attainment, Flexibility, Decision Making, and Relationship Building.
Some of the key competencies critical in change leadership have been called out by Pagon & Banutal (2008), and include:
-
Goal attainment
-
Assessing organizational culture and climate
-
Change implementation
-
Motivating and influencing others
-
Adaptability
-
Stakeholder management
-
Collaboration
-
Build organizational capacity and capability for change
-
Maneuvering around organizational politics
There is a range of change leadership assessment offerings from various consulting firms. Whichever one you choose, ensure that it is not overly simplistic and not ‘tested’ and therefore not reliable. Assessments will only be useful if they have gone through the rigour of being tested, with the results showing that they are reliable can be trusted. Anyone can ‘invent’ a simple survey with various leadership categories, but this does not mean they are actually valid. Afterall, if you are asking your leaders to spend time to fill in an assessment survey, you want to be confident that the outcome of the assessment will provide sufficient insight.
Change maturity assessment
Organisations are increasingly realising that managing change initiative by initiative is no longer going to cut it as it does not enable organizational learning and growth. Initiatives come and go and those who rely on contractor change managers often find that their ability to manage change as an organization does not mature much across initiatives, especially across time.
Change maturity assessment is focused on building change capability across the organization across different dimensions, whether it be project change management, operational change or change leadership. The goal of conducting a change maturity assessment is to identify areas in which there may be a capability gap and therefore enable structured planning to close this gap. The meaning of ‘capability’ does not just refer to people skills, but also to process and system capabilities.
Change maturity assessment results may prompt focus and action to improve change management capabilities if used in the right channels to influence the leadership and the business.
There are 2 major change maturity assessment models available in the market. The first is by Prosci and the second is by the Change Management Institute (CMI). Read up more about CMI’s Organisational Change Maturity Model here. To read more about change maturity assessment read out article A New Guide for Improving Change Management Maturity, where we outline how to improve change maturity throughout different business units across the organization.
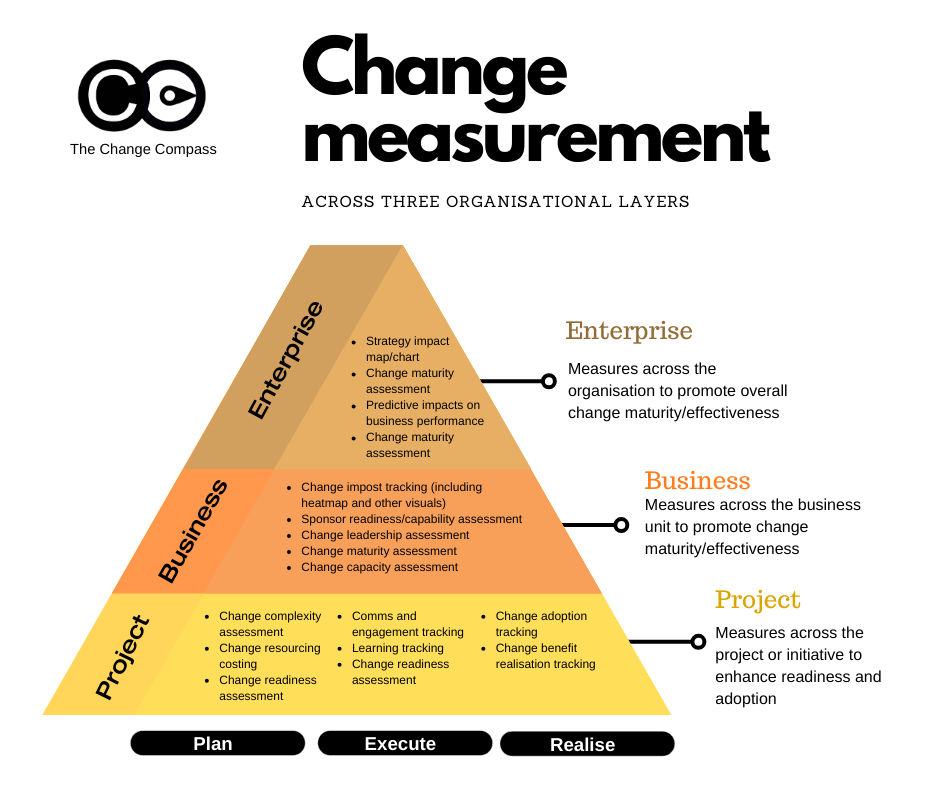
A comprehensive model of Change Management Measures
In this diagram various change management measures are represented along two axes, one being the different phases of the initiative lifecycle, and the other being different organizational levels of project, business and enterprise in which change management measures fall into.
In the broad initiative phases of Plan, Execute and Realise there are various change measurements and assessments that may be applicable. At the Business and Enterprise levels, these measurements and assessments are not so much split according to initiative phases. Instead, they may be conducted periodically, for example change capacity and impost tracking may be done on a monthly basis, with change maturity assessment conducted at an annual basis.
Project level measures
1. ‘Plan’ phase
In this phase of the project, the team is discovering and scoping what the project involves and what the change is. As a result, the details are not known clearly at the commencement of the phase. Later in the phase the scope becomes much clearer and the team starts to plan what activities are required to implement the change.
-
The change complexity assessment evaluates how complex the project is. It looks at how many people could be impacted, what the size of the impact could be, how many business units are impacted, whether multiple systems and processes are impacted, etc.
-
Change resourcing costing. At the planning phase of the project cost required for the change management stream of the work is required. This includes such as any contractors, communication campaigns, learning cost, travel, and administration cost, just to name a few.
-
Change readiness assessment is usually conducted prior to the change and during the change. Usually, the same set of questions is asked of various stakeholder groups to assess their readiness for change.
2. ‘Execute’ phase
The execute phase is one of the most critical parts of the project. Activities are in full flight and the project is busy iterating and re-iterating changes to ensure successful execution to achieve project goals.
-
Communication and engagement tracking. Effective engagement of stakeholders in the change is absolutely critical. Stakeholder interviews, surveys, communication readership rates are all ways in which engagement may be tracked.
-
Learning tracking. Measuring learning is critical since it tracks to what extent the new competencies and skills have been acquired through learning interventions. Typical measurements include course tests or quizzes in addition to course evaluations. On the job performance may also be used to track learning outcomes and to what extent learning has been applied in the work setting.
-
Change readiness assessment continues to be critical to track during the execution phase of the project
3. ‘Realise’ phase
In this phase of the project the change has ‘gone live’ and most project activities have been completed. It is anticipated in this phase that the ‘change’ occurs and that the benefits can then be tracked and measured.
-
Change benefit tracking measures and tracks the extent to which the targeted benefits and outcomes have been achieved. Some of these measures may be ‘hard’ quantitative measures whilst others may be ‘soft’ measures that are more behavioural.
Business level measures
Business level measures are those that measure to what extent the business has the right ability, capacity, and readiness for the change.
-
Change heatmaps can help to visualize which part of the business is most impacted by 1 project or multiple projects. The power of the change heatmap is in visualizing which part of the business is the most impacted, and to compare the relative impacts across businesses. As the number of change initiatives increase so would the complexity of the change. When facing this situation organisations need to graduate from relying on excel spreadsheets to using more sophisticated data visualization tools to aid data-based decision making. To read more about change heatmaps and why this is not the only way to understand business change impact, go to The Death of the Change Heatmap.
-
Sponsor readiness/capability assessment can be a critical tool to help identify any capability gaps in the sponsor so that effort may be taken to support the sponsor. A strong and effective sponsor can make or break a change initiative. Early engagement and support of the sponsor are critical. Both Prosci, as well as Changefirst, have sponsor competency assessment offerings.
-
Change champion capability assessment. Change champion or change agent are critical ‘nodes’ in which to drive and support change within the organizational network. A lot of change champions are appointed only for one particular initiative. Having a business-focus change champion network means that their capability can be developed over time, and they can support multiple initiatives and not just one. Assessing and supporting change champion capability would also directly translate to better change outcomes.
-
Change leadership and change maturity assessment – refer to the previous section
-
Change capacity assessment.
In an environment where there is significant change happening concurrently, careful planning and sequencing of change in balance with existing capacity are critical. There are several aspects of change capacity that should be called out in the measurement process:
1. Different parts of the business can have different capacity for change. Those parts of the business with better change capability, and perhaps with better change leadership, are often able to receive and digest more changes than other businesses that do not possess the same level of capability.
2. Some businesses are much more time-sensitive and therefore their change capacity needs to be measured with more granularity. For example, call centre staff capacity is often measured in terms of minutes. Therefore, to effectively plan for their change capacity, the impacts of change needs to be quantified and articulated in a precise, time-bound context so that effective resourcing can be planned in advance.
3. The change tolerance or change saturation level for business needs careful measurement in combination with operational feedback to determine. For example, it could be that last month a part of the business experienced significant change impact across several initiatives happening at the same time. The operational indicators were that there was some impact on customer satisfaction, productivity, and there were negative sentiments reported by staff that there was too much change to handle. This could mean that the change tolerance level may have been exceeded. With the right measurement of change impact levels for that part of the business, next time this level of change is seen, previous lessons may be utilized to plan for this volume of change. Utilise measurement and data visualization tools such as the Change Compass to track change capacity.
AI-driven systems such as Change Compass can now detect change saturation hotspots across teams or departments by analysing workload data in real time. These systems also provide actionable recommendations on how to sequence or prioritise initiatives to minimise disruption while maximising performance outcomes.
Enterprise level change measures
At an enterprise level, many of the business unit level measures are still applicable. However, the focus is comparing across different business units to sense-make what each part of the business is going through and if the overall picture is aligned with the intentions and the strategic direction of the organization. For example, typical questions include:
-
Is it surprising that one part of the business is undergoing significant change whilst another is not?
-
Is there a reason that one business unit is focused on a few very large changes whilst for other business units there is a larger set of changes each with smaller impacts?
-
Is the overall pace of change optimum according to strategic intent? Does it need to speed up or slow down?
-
What is the process to govern, report and make decisions on enterprise level change, prioritization, sequencing and benefit realization?
-
Is there one business unit that is able to manage change more effectively, faster with greater outcomes? How can other business units leverage any internal best practices?
As mentioned in the Change Management Measures diagram, some enterprise level change measures include:
-
Change capacity assessment – Does one business unit’s change capacity limits mean that we are not able to execute on a critical strategy within the allocated time? How do we create more capacity? Ways in which to create more capacity could include more resources such as staff, or initiative funding, more time is given, or more talent to lead initiatives
-
Change maturity assessment – At an enterprise level, the concern is with the overall change maturity of the organization. How do we implement enterprise level interventions to build change maturity through programs, networks, and exchanges, such as:
-
Enterprise change capability programs
-
Enterprise change analytics and measurement tools
-
Enterprise change methodology
-
Enterprise network of change champions
-
-
Strategy impact map – Change management need not be focused only on project execution or business unit capability. It can also demonstrate value at an enterprise level by focusing on strategy execution (which by definition is change). The way in which different strategies exert impact on various business units may be visualized to help stakeholder understand which initiatives within which strategic intent impact which business units. To illustrate this please refer to the below diagram which is an example of a strategy impact map. In this diagram, each of the organisation’s strategy is displayed with different initiatives branching out of each strategy. The width of each initiative correlates with the level of impact that the initiative has on the business over a pre-determined period of time. Therefore, the width of each strategy also indicates the overall relative impact on the business.
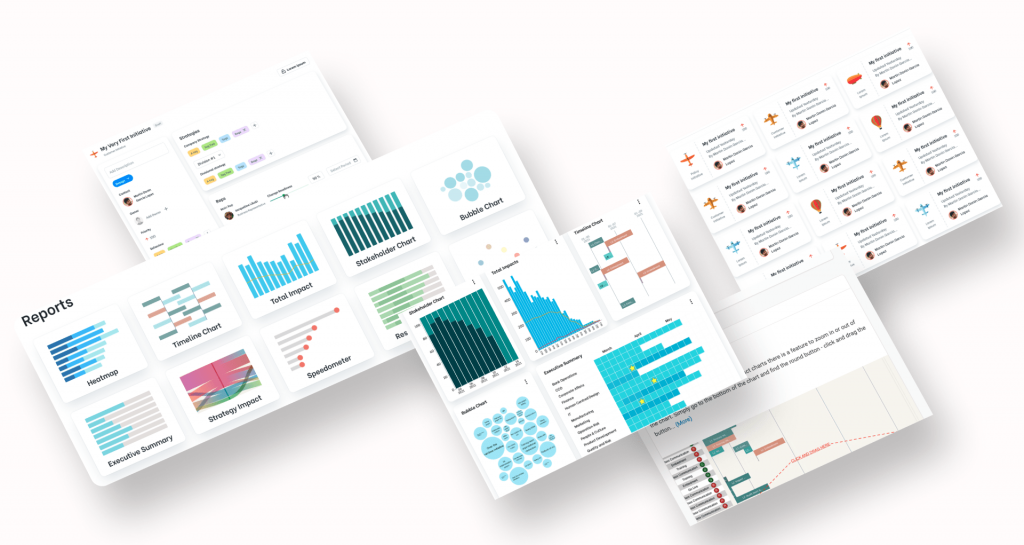
Example: Change management dashboard from The Change Compass

This data visualization artifact can be valuable for business leaders and strategic planning functions as it depicts visually how the implementation of various strategies is impacting business units. This helps planners to better understand strategy implementation impacts, potential risks and opportunities, and balancing change pace with strategy goals at various points in time.
-
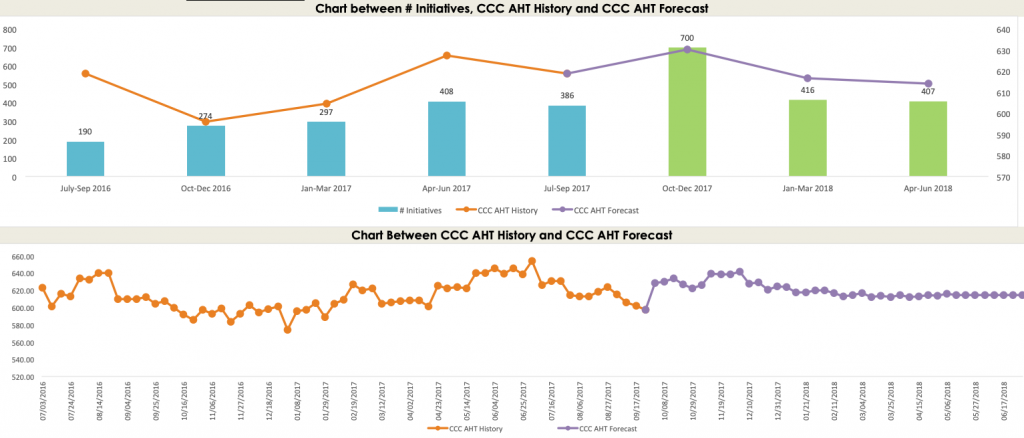
Predictive indicators on business performance – We started this article talking about how data is all around us and we also need to better manage change using data. With quantitative data on change impact, it is possible to ascertain any correlations with operational business indicators such as customer satisfaction, service availability, etc. For those business indicators where there is a significant correlation, it is possible to hence use predictive reporting to forecast performance indicator trends, given planned change impacts.
In the below graph you can see an example of this whereby using historical data it is possible to establish correlations and therefore forecast future impact on business indicators. This example is focused on the customer contact centre (CCC) and key business indicator of average handling time (AHT) is utilized as an illustration.
This type of predictive performance forecasting is extremely valuable for organisations undergoing significant change and would like to understand how change may impact their business performance. By demonstrating the impact on business indicators, this puts the importance of managing change at the front and centre of the decision-making table. At The Change Compass, we are developing this type of measurement and reporting function. This is the frontier for change management – to be established as a key business-driving function (versus a standard back-office function).
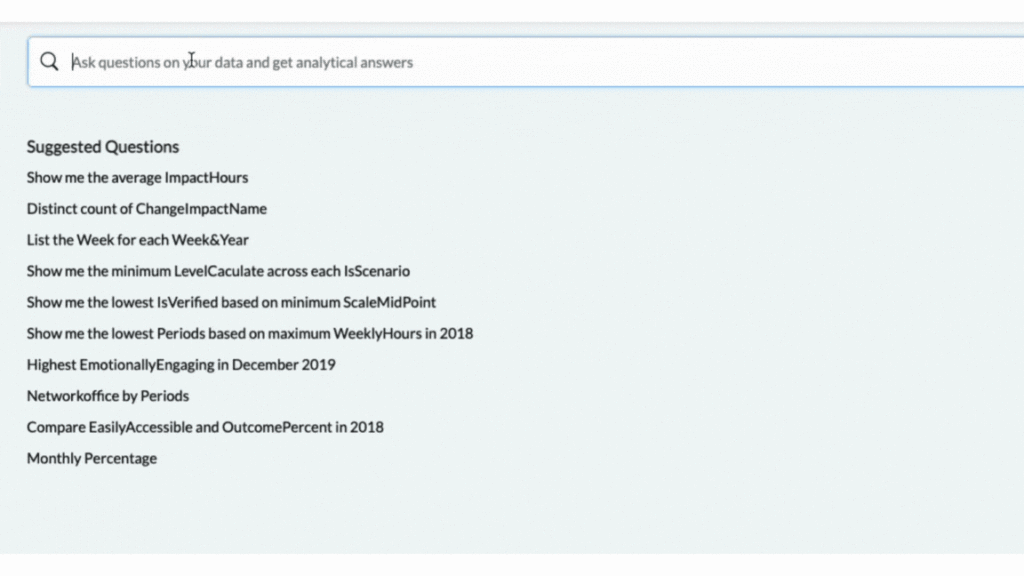
With AI-powered platforms, stakeholders can now ask natural language questions like ‘What is the current adoption rate of Initiative X?’ or ‘Which teams are at risk of exceeding their capacity?’ Platforms such as Change Compass provide instant answers backed by real-time data analysis, saving time and enhancing decision-making accuracy.
Example: Using natural language query with The Change Compass
Change can be measured and this article has outlined various operational and strategic ways in which change measurement can demonstrate significant value. Most corporate functions cannot exist without data and analytics. For example, Human Resources relies on people and pay data. Marketing cannot function without measurement of channel and campaign effectiveness. For Information Technology, pretty much everything is measured from system usage, to cost, to efficiency. It is time we start utilizing data to better visualize change to better plan and make business decisions.
Have a chat with us if you are looking for ways to streamline how you capture, visualise data for decisions, and leverage AI to easily generate insights. This includes the ability to easily do forecasting, ask data questions using natural language and get instant answers.
And If you’re ready to start implementing your change metrics check out the Part 2 of The Ultimate Guide to Measuring Change.
References:
Miller, David (2011) Successful Change. How to implement change through people. Changefirst Ltd.
Pagon & Banutal (2008) Leadership Competencies for Successful Change Management. Study Report. University of Maribor.


