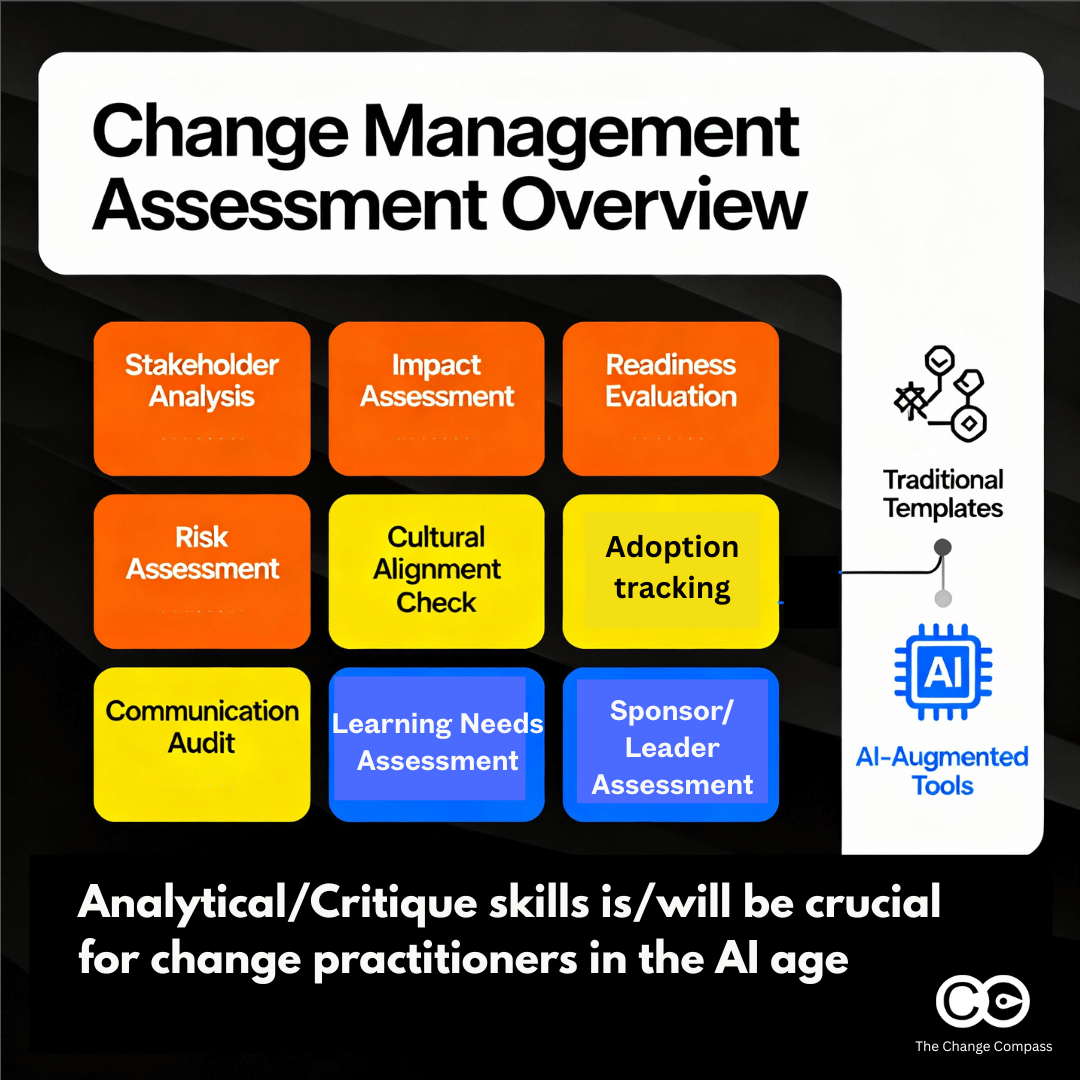


A change management assessment is a structured diagnostic that tells you what is changing, who is affected, whether they are ready, and whether the change is sticking, so that leaders can decide where to act.
Most organisations run assessments and then do nothing differently. A readiness survey lands in a steering committee pack, the average score is amber, and the programme proceeds on the original plan. The assessment has been completed; the decision it was meant to inform has not been made. For senior change, HR and transformation leaders, that is the real failure point, and it is the focus of this guide. It covers the assessments that matter (impact, readiness, stakeholder, cultural, learning needs, adoption, compliance and risk, and change saturation), what each one should be used to decide, and how to read the data together rather than one report at a time. You will finish with a practical way to choose the right assessments, set decision rules before data arrives, and present findings that executives act on. The argument is simple: assessments without data are opinions, and data without a decision attached is just a report.
What change management assessments are and which ones you need
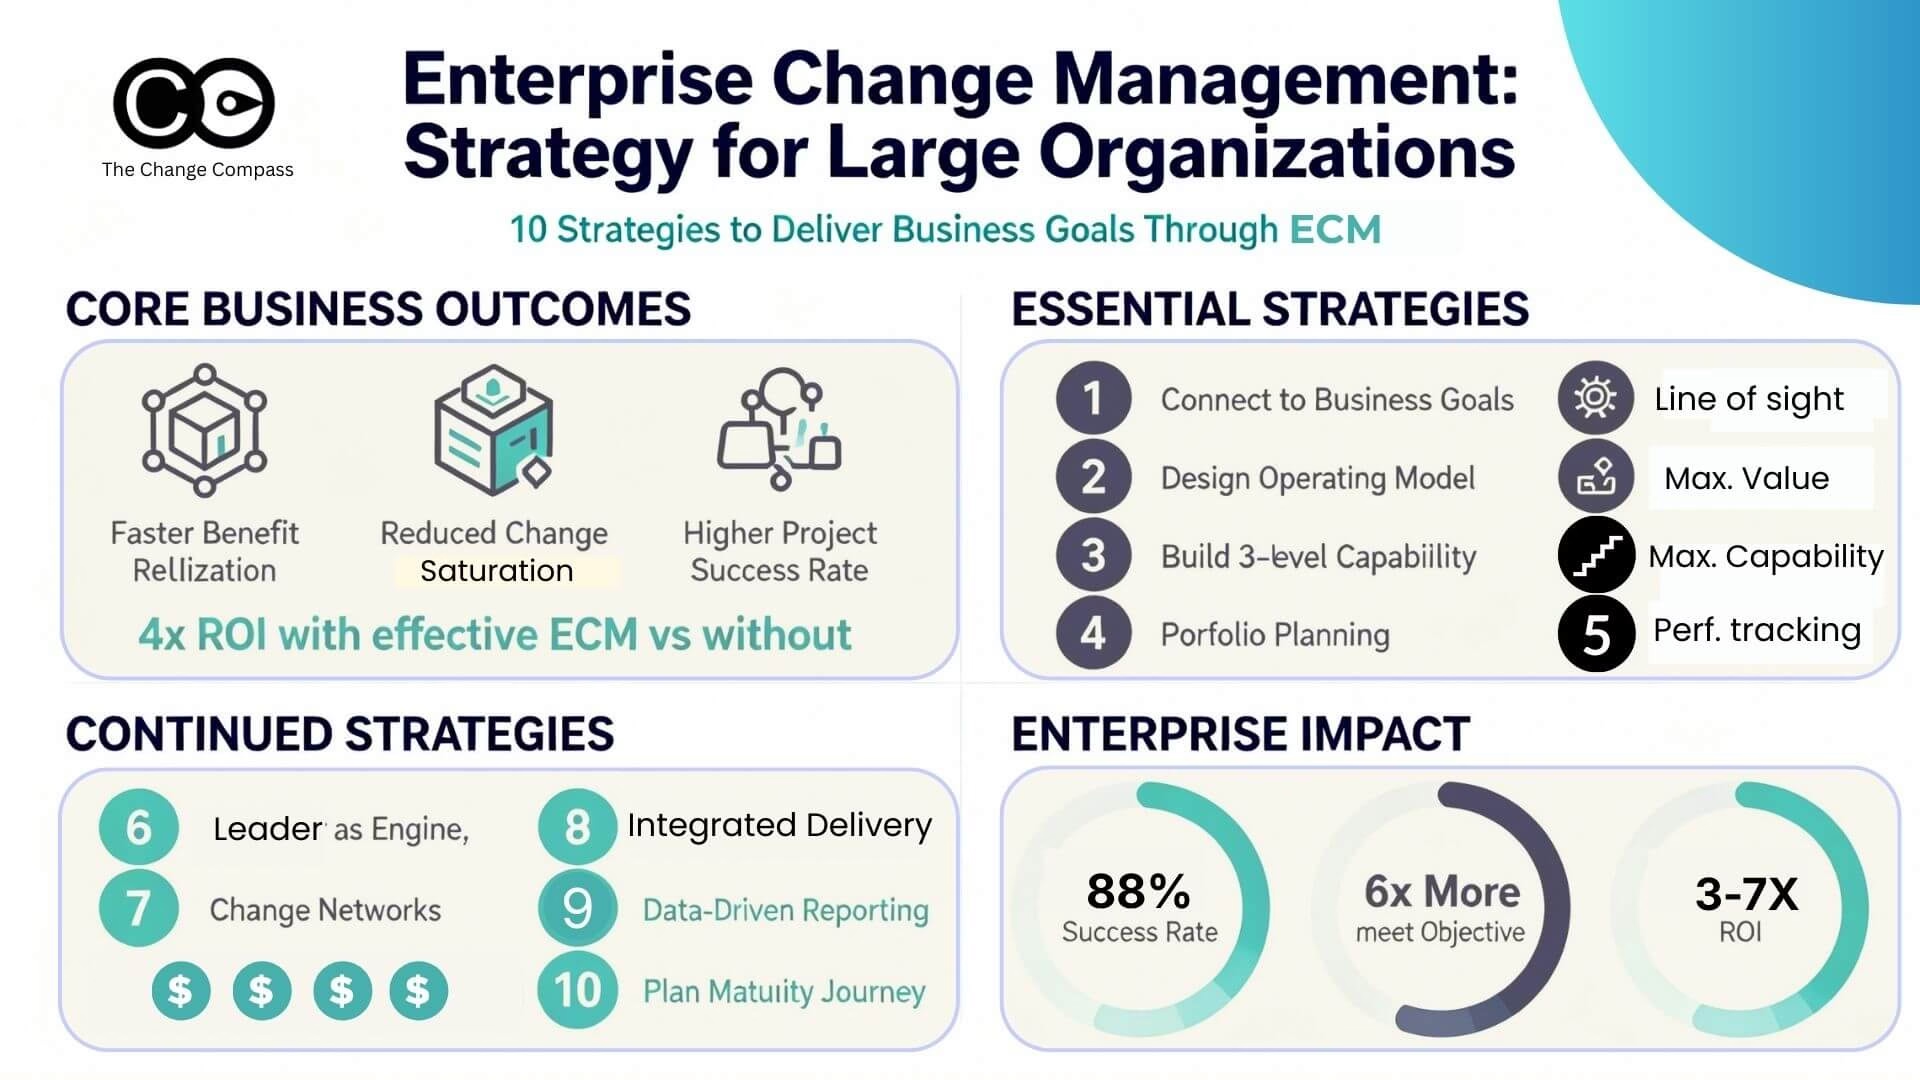
Change management assessments fall into three core types and several supporting ones: impact assessment (what changes, for whom, by how much), readiness assessment (whether people and the organisation can absorb it) and adoption assessment (whether new ways of working are being used after go-live). Supporting assessments cover culture, stakeholders, learning needs, compliance and risk, and saturation. The evidence that this discipline pays off is consistent: Prosci’s Best Practices research found that 88% of projects with excellent change management met or exceeded objectives, against 13% of those with poor change management.
Most practitioners use several assessment types across a single initiative, layering them to build a picture of readiness, impact, risk and opportunity. The most common mistake is relying on one type and assuming it tells the whole story. A readiness survey shows whether people feel ready but not which skills they lack. A cultural assessment surfaces values but does not map who will resist. A stakeholder analysis shows who matters but not what each person is worried about. A learning needs assessment identifies training gaps but does not connect them to adoption barriers. Only layered assessments, read together, describe the real landscape.
The table below links each assessment to the question it answers and the decision it should drive. If you cannot name the decision, you probably do not need the assessment yet.
| Assessment | Question it answers | Decision it should drive | Typical timing |
|---|---|---|---|
| Impact | What changes, for whom, and how much? | Scope, sequencing, training and change effort by group | Design, then refresh at each release |
| Readiness | Are the organisation and people prepared? | Go, delay or add preparation before launch | Pre-project and pre-go-live |
| Stakeholder | Who can enable or block this, and why? | Engagement plan and sponsor asks | Initiation, then quarterly |
| Cultural | What norms will help or hinder? | Where to work with culture, and where to counter it | Design phase |
| Learning needs | Which knowledge, skill and confidence gaps exist? | Training design, timing and emphasis | Pre-build and pre-go-live |
| Compliance and risk | Do controls hold during transition? | Mitigations, parallel runs, extra sign-offs | Design and cutover |
| Saturation and capacity | Can this group absorb another change now? | Re-sequence or defer initiatives | Portfolio planning, ongoing |
| Adoption | Is the change actually being used correctly? | Reinforce, redesign or escalate | 30, 60, 90 days post-release |
The three core assessments: Impact, readiness and stakeholder
Impact, readiness and stakeholder assessments together answer the three questions every steering committee asks first: how big is this, are we ready, and who do we need on side? They should be completed in that order because each depends on the one before it. Impact sets the scope, readiness tests the gap against that scope, and stakeholder analysis decides who is engaged to close it. The people dimension is where the evidence is clearest: in Prosci’s 12th Edition study, 79% of respondents with extremely effective sponsors met their objectives, compared with 27% of those with extremely ineffective sponsors.
Impact assessment: What is really changing
An impact assessment identifies every function, process, system, role and team affected by a change, and measures how large each impact is: a minor tweak, or a fundamental reshaping of work and behaviour. It is the starting point because everything downstream depends on it. Without clarity on impact you cannot scope training, segment stakeholders or build a realistic change budget, and many programmes discover halfway through that they misjudged the scale.
A thorough impact assessment examines:
- Process changes (which activities will be different)
- System changes (which technology or tools will change)
- Organisational changes (reporting lines, structures and roles)
- Role changes (what responsibilities each person will hold)
- Skill requirement changes (which new competencies are needed)
- Culture changes (which new behaviours or mindsets are required)
- Operational changes (which performance metrics will shift)
Experienced practitioners go beyond the list to the ripple effects. A new system needs training, but it may also change workflow sequencing (so dependent teams need to understand the shift), approval permissions (so decision rights need clarifying) and performance metrics (so success criteria need resetting). Mapping those cascades early prevents surprises during implementation. For a full method, see our practitioner guide to conducting a change impact assessment.
Sample impact assessment (illustrative)
| Function | Staff | Impact level | Process changes | System changes | Skill requirements | Behaviour shifts |
|---|---|---|---|---|---|---|
| Loan Operations | 95 | High | 85% of workflow affected | Complete system replacement | 12 new technical competencies | Approval-based to data-driven decisions |
| Credit Risk | 32 | Medium | Approval steps remain, timing shifts | Integration with new system | 5 new risk analysis capabilities | Faster decision cycles |
| Customer Service | 120 | Low | Interface improves, core duties unchanged | New CRM interface | 3 new system features | Proactive customer communication |
| Finance and Reporting | 15 | Medium | New metrics and reporting | New reporting module | 4 new reporting skills | Real-time vs monthly reporting |
| Compliance | 8 | Medium | New verification steps | Audit trail enhancements | 2 new compliance processes | Continuous monitoring vs spot checks |
| IT Support | 12 | High | Support model changes fundamentally | New ticketing system | 8 new technical support skills | Reactive to proactive support |
Readiness assessment: Preparation before launch
A readiness assessment measures whether the organisation and the affected people are prepared for a change, and it comes in two forms that experienced practitioners use together. Prosci recommends running one at the start of a project so the findings can shape the change strategy rather than describe it afterwards.
Organisational readiness happens before the project formally starts. It tests whether the structural and cultural foundations exist: A committed sponsor, change governance, allocated resources, a clear objective and aligned leadership. It answers whether you should attempt this now or fix foundations first.
Adoption readiness happens just before go-live. It tests whether people are prepared: Training completed, role changes understood, managers ready to support, support structures in place and confidence high. It answers whether to launch or add final preparation.
Readiness typically examines seven dimensions:
- Awareness: Do people understand what is changing and why?
- Desire: Do they believe the change is necessary and beneficial?
- Knowledge: Do they have the information and skills needed?
- Ability: Do systems, processes and infrastructure allow them to act?
- Support: Is leadership visibly committed and removing barriers?
- Culture and communication: Is there trust, openness and honest dialogue?
- Commitment: Will people sustain the change over time?
The data separates readiness that exists from readiness that is assumed. Many organisations treat training completion as readiness, but the two correlate rather than coincide: people can finish training and remain unconfident or unconvinced. Surveys alone also have limits. They show that a gap exists but rarely why, which is why we recommend going beyond the survey to strategic insight and following our readiness assessment method. If you are designing the survey itself, write one that is valid first.
Sample readiness scorecard (illustrative): Organisational readiness for a customer data platform
| Dimension | Score | Status | Comment |
|---|---|---|---|
| Sponsorship commitment | 8/10 | Strong | CEO personally championing; budget allocated |
| Leadership alignment | 6/10 | Caution | Finance and Operations aligned; Technology concerned about timeline |
| Change infrastructure | 5/10 | At risk | No dedicated change function; relying on project team |
| Resource availability | 7/10 | Good | Core team allocated; limited surge capacity |
| Clarity of vision | 8/10 | Strong | Compelling business case; clear success metrics |
| Cultural readiness | 5/10 | At risk | Risk-averse; past project failures causing hesitation |
| Stakeholder buy-in | 6/10 | Caution | Early adopters engaged; middle management unconvinced |
Stakeholder assessment: Influence, interest and engagement
A stakeholder assessment identifies everyone affected by a change and classifies them by influence and interest, which determines who needs sponsorship, who needs information and who is likely to resist or advocate. The classic matrix gives four quadrants:
- High influence, high interest: Manage closely; these are the key players.
- High influence, low interest: Keep satisfied; they can block progress if dissatisfied.
- Low influence, high interest: Keep informed; they advocate but do not decide.
- Low influence, low interest: Monitor; they are not critical but should not be ignored.
Sophisticated analysis goes further and profiles individual motivations: what each person cares about, what they stand to gain or lose, and which language will land. The value compounds when you layer it. Combined with a cultural assessment, stakeholder influence mapping predicts where resistance will come from and who has the power to amplify or neutralise it. Combined with learning needs, it shows what support each group requires. Different groups also need different plans, as we show in why not all stakeholder groups need the same change plan.
Supporting assessments: Culture, learning needs, compliance and saturation
Supporting assessments explain why the core results look the way they do and flag risks the core three miss. Culture explains resistance, learning needs explain capability gaps, compliance and risk protect the control environment, and saturation shows whether the audience has room to take on the change at all. The people side deserves particular weight right now: Gallup’s 2026 State of the Global Workplace reports global employee engagement at 20% in 2025, its lowest level since 2020, with manager engagement at 22%, and estimates the cost of disengagement at roughly US$10 trillion in lost productivity. Managers carry most change on the ground, so their engagement is a variable to assess, not assume.
Cultural assessment
A cultural assessment evaluates the values, beliefs and unwritten rules that shape how people respond to change. Dimensions that affect outcomes include:
- Risk orientation: Risk-averse or entrepreneurial, which determines whether people embrace or resist change.
- Trust in leadership: Whether employees believe leaders have good intentions and sound judgement.
- Pace of decision-making: Deliberate or fast-moving, which shapes whether timelines feel realistic.
- Accountability clarity: Comfort with clear ownership versus preference for ambiguity.
- Learning orientation: Whether experimentation is encouraged or mistakes are punished.
- Collaboration norms: Whether people work across silos naturally or protect functions.
Surveys, interviews and focus groups gather the data. The insight is often counterintuitive: a strong, unified culture can impede change if it is change-resistant, while a more fluid culture often adopts faster. Experienced practitioners do not judge culture as good or bad. They assess it realistically and build mitigation that works with it rather than against it.
Learning needs assessment
A learning needs assessment identifies the knowledge, skills and behaviours people need in the new state and the gaps that exist today. A complete one examines knowledge gaps, skill gaps, behaviour gaps, confidence gaps and role-specific needs. The insight comes from patterns: which teams have the largest gaps, which roles feel least certain, whether gaps cluster around particular systems or topics, and whether they are concentrated or spread. Those patterns shape training strategy, timing and emphasis.
The assessment also connects directly to adoption barriers. Groups with large capability gaps will struggle to adopt, topics that generate high uncertainty need more support, and roles that feel unprepared become adoption blockers. Spotting these links early lets you target interventions rather than run uniform training.
Compliance and risk assessment
A compliance and risk assessment evaluates whether transformation activity maintains regulatory compliance, control adherence and operational risk management. It examines control effectiveness during and after transition, regulatory compliance, data security, process integrity and any new operational risks. The finding is often stark: system transitions can leave windows where controls are weaker, new processes can have unintended compliance implications and data migration can create security exposure. Identifying these early allows mitigation planning rather than remediation.
Sample compliance and risk output (illustrative): Control environment during an ERP transition
| Control | Pre-migration status | Migration risk | Post-migration status | Mitigation |
|---|---|---|---|---|
| Segregation of duties (purchasing) | Operating | High | Design verified | Dual sign-off during transition |
| Inventory cycle counts | Operating | Medium | Design verified | Weekly counts during transition |
| Financial reconciliation | Operating | High | Design verified | 30-day parallel run |
| Approval authorities | Operating | Medium | Reconfigured | Training on new authority matrix |
| Audit trail | Not available | Medium | Enhanced | Data retention policy reviewed |
Change saturation and capacity assessment
A saturation assessment measures how much change a group is absorbing relative to its capacity, which tells you whether to proceed, re-sequence or defer. It is the portfolio-level counterpart to impact assessment: impact tells you the size of one change for one group, saturation adds up everything landing on that group in the same window. Without it, a well-run readiness assessment can still be overturned by three other initiatives going live the same fortnight. The method for building one is covered in our guides to building a change capacity model and measuring change saturation.
Adoption assessment: Measuring behaviour after go-live
An adoption assessment measures whether people are using new systems, processes and ways of working correctly and consistently after release. It is the most neglected assessment type and the only one that measures outcomes rather than predicting them. The case for doing it is strong: in Prosci’s 12th Edition data, 76% of respondents who measured compliance and performance met or exceeded their project objectives, compared with 24% of those who did not.
Adoption assessment goes beyond logins and training completion. It examines:
- System usage: Which features are used and which ignored.
- Workflow adherence: Whether people follow new processes or revert.
- Proficiency progression: Whether skill keeps growing or plateaus.
- Workarounds: Where people bypass the new system or process.
- Behavioural change: Whether desired behaviours are becoming embedded.
- Compliance: Whether required controls and governance are followed.
The patterns reveal what is working. High adoption in some areas and resistance in others suggests the change fits some contexts and conflicts with others. Rapid adoption followed by a plateau suggests enthusiasm that is hard to sustain. Widespread workarounds suggest design gaps or conflicts with real operational needs.
Sample behavioural change tracking (illustrative)
| Behaviour | Adoption rate | Trend |
|---|---|---|
| Submitting expenses via the system | 72% | Increasing |
| Using digital receipts instead of paper | 48% | Increasing, slowly |
| Submitting on time rather than overdue | 61% | Slight decline |
| Approving expenses in the system | 85% | Strong |
This is where data and human interpretation diverge most sharply. The data shows what is happening; interpretation decides why. Low adoption could be a change management failure (people do not understand or want the change), an adoption support failure (they want to but lack resources or capability), a design failure (the system does not work in their context) or a business case failure (the change does not deliver the promised benefit). Each cause needs a different response, and data alone cannot tell them apart. For metric choices and dashboards, see our guide on how to measure change adoption.
From assessment data to decisions
The step that separates practitioners from template-followers is analysis: finding patterns across assessments and turning them into a decision someone owns. Leaders’ intuition is often wrong about their own workforce, which is the case for measuring in the first place. McKinsey’s survey of 3,613 employees and 238 C-suite leaders found that employees are about three times more likely than leaders estimate to be using generative AI for a third or more of their work. Assumptions about readiness and adoption deserve the same suspicion.
Ask harder questions of the data
Template approaches gather data, tick boxes and move to a predetermined next step. Analytical approaches ask:
- What patterns appear across assessments? Low awareness with high desire needs communication; low desire with high awareness needs benefits clarity.
- Where do assessments conflict? A risk-averse culture paired with an impact assessment that requires risk-taking behaviour is a critical tension needing a specific mitigation.
- Which findings are unexpected? Surprises often reveal what templates miss.
- Is this a root cause or a symptom? Surface resistance can stem from awareness gaps, capability gaps, cultural misalignment or stakeholder concerns, each with a different fix.
- How do findings cascade? Low readiness in one function can cause adoption failures in dependent ones.
This work needs comfort with ambiguity. Assessment data rarely tells one clean story, so synthesise across sources, form hypotheses about what is happening, and design interventions that test them.
Set decision rules before the data arrives
Agree, before collecting data, a threshold, an owner and a default response for each assessment. This is what turns findings into decisions, and it removes the argument about whether an amber score matters. Examples:
| Finding | Decision | Owner |
|---|---|---|
| Awareness below threshold in any impacted group | Increase communication intensity for that group before go-live | Change lead |
| Readiness below threshold in a high-impact group | Delay go-live for that group or add targeted preparation | Programme sponsor |
| Middle managers unconvinced | Brief and equip managers before wider rollout | Business leader |
| Workarounds rising after release | Review process or system design | Process owner |
| Group saturated in the go-live window | Re-sequence the competing initiative | Portfolio governance |
Present results as decisions required, not scores received. A one-page readout with the finding, the evidence, the decision and the owner is more likely to be acted on than a deck of charts. Always report by stakeholder group rather than as an overall average: a 65% readiness average can hide a critical group at 30%.
Build rigour into the approach
Six principles improve quality regardless of assessment type:
- Use multiple data sources. Surveys show what people think, interviews show what they believe, and project history shows what actually happens.
- Segment your data. Breaking results by function, location, seniority and role shows where challenges concentrate.
- Look for patterns and contradictions. Consistent findings are solid ground; conflicts are tensions to investigate.
- Question unexpected findings. Dig deeper before dismissing results that contradict assumptions.
- Connect findings to strategy. Low awareness changes the communication plan; cultural misalignment calls for specific culture work; concentrated resistance needs targeted engagement.
- Reassess throughout. Conditions change between phases, and reassessment at milestones shows whether mitigations are working.
Keep it practical
Comprehensive guidance can sound overwhelming, so start small. Choose the assessments that address your biggest uncertainty rather than running all of them. Test specific hypotheses (for example, “do you understand how your role will change?”) instead of asking generic readiness questions. Use standard templates for consistent, comparable data, then drill into unexpected patterns with interviews and focus groups. Most importantly, invest time in interpretation: data collection is the easy part, and the valuable work is asking what the results mean for your strategy.
Where AI and digital tools fit in assessment
Assessment practice has moved through three phases, and the third is where the opportunity and the risk sit. AI can collect and pattern-match at scale, but it cannot yet reliably explain why a pattern exists, so the strongest approach pairs digital tools with experienced human judgement.
- Phase 1, template-based assessment: Standard questionnaires and checkbox completion. This brought consistency, but templates assume one size fits all and rarely surface the unexpected.
- Phase 2, data-driven assessment: Multiple sources (surveys, interviews, historical project data, performance metrics, sentiment) reveal patterns templates miss. The limit is human capacity to synthesise across them.
- Phase 3, digital and AI-augmented assessment: Platforms collect data at a scale and speed people cannot, and machine learning surfaces anomalies and correlations.
The caution is interpretation. AI can tell you adoption is lower in one division than another. It cannot reliably tell you whether the cause is a change-resistant culture, a conflict with that division’s business model, absent local leadership or poor system integration. Prosci’s research on AI implementation points the same way: 63% of AI implementation challenges stem from human factors rather than technical limitations, based on 1,107 professionals. The same is true of assessment tooling. Technology handles collection and pattern recognition; practitioners supply context, causation and strategy.
Digital tools also change how often you can assess. Where a point-in-time survey gives you one snapshot, a platform such as Change Compass can combine impact, saturation and adoption data in one place, so assessments update as initiatives move and decision rules can be checked continuously rather than quarterly. That replaces the spreadsheet-and-slide-deck cycle that makes most assessments stale before the steering committee sees them.
What to do with your next assessment
The organisations that excel at transformation treat assessment as analysis with an owner attached, not as a compliance exercise. Before your next assessment, do three things: name the decision it should inform, set the threshold and the owner for that decision, and decide when you will reassess. Pair technology that gathers data at scale with practitioners who interpret it, and layer assessment types rather than relying on one. Run impact first, readiness and stakeholder analysis second, adoption last, and keep the supporting assessments for the specific uncertainties that matter. If the assessment does not change a decision, change the assessment.
Frequently asked questions about change management assessments
What is the difference between a readiness assessment and an adoption assessment?
A readiness assessment looks forward: it tests whether the organisation (before the project starts) or the affected people (just before go-live) are prepared to absorb the change. An adoption assessment looks backward: after release, it measures whether people are using the new system or process correctly and consistently. Readiness predicts the risk; adoption confirms whether the risk materialised.
Why do transformations fail even after passing a readiness assessment?
Readiness surveys capture perceived readiness, not demonstrated capability or commitment. People can report feeling ready while lacking the skills, and leaders can sound committed while competing priorities pull their time away. The more common cause is that findings are recorded but nobody owns the decision they should trigger, so the gap is still open at go-live.
How do I connect assessment findings to change strategy?
Agree a decision rule before you collect data: for each assessment, a threshold, an owner and a default response. Low awareness triggers more communication, a risk-averse culture paired with risk-taking behaviours triggers explicit leadership and reinforcement work, and workarounds in adoption data trigger a process or system design review. Report findings as decisions required, not as scores.
Which change management assessment matters most?
No single assessment tells the whole story, but the impact assessment comes first because it defines who is affected and by how much, and every other assessment depends on that scope. Readiness is the best predictor of adoption, and adoption is the only assessment that measures actual outcomes. Start with the assessment that addresses your biggest uncertainty.
How often should change assessments be repeated?
Repeat them at each major milestone rather than on a fixed calendar: after design, before go-live, and at 30, 60 and 90 days after release. Conditions shift as a programme moves between phases, so early findings go stale. Reassessment also shows whether your interventions worked.
References
- Prosci. The Correlation Between Change Management and Project Success
- Prosci. Best Practices in Change Management (12th Edition)
- Prosci. Metrics for Measuring Change Management
- Prosci. How to Use a Readiness Assessment for Change Management
- Prosci. Why AI Transformation Fails
- Gallup. State of the Global Workplace 2026
- McKinsey & Company. Superagency in the workplace: Empowering people to unlock AI’s full potential at work