In this Change Practitioner Q&A series we talk to change managers to ask them how they approach their work. This time we are talking to Fiona Johnson.
Change Compass: Hi Fiona, describe yourself in 3 sentences.
Fiona: I’m a ‘seasoned” change practitioner who has survived many types of workplaces relatively unscathed ! Honestly, I could write a book about it. I always try and see the positive aspects of any workplace and do my best to enhance and support the cultural norms AND keep a sense of humour. I like to collaborate with professional and supportive team members and coach and mentor team members.
Change Compass: What has been the most challenging situation for you as a change practitioner? Tell us what happened and how you fared through it.
Fiona: I’ve had a lot of challenges, but I think the key is getting leaders to lead the change and supporting them.
I had an instance where I had to “sell” the benefits of change management to a very resistant Financial Controller. At the start of the project ( basically an operating model change) , he was totally focussed on the numbers and not the people and lacked the insight that change is always about people.
I had a team made up of business representatives and I set up regular fortnightly meetings to get his attention on issues we needed resolving and keep him up to date. I made the meetings short and sharp and each team members gave an update on the work they were doing to give them visibility. He realised the value of change management once the project delivered as that was when the gaps became evident. I think we were able to prepare him for the implementation but once the project wrapped up it was evident there was a lot of embedment activities not planned for and I think this would have caused more pain.
Although change initiatives are clearer now about the roles and responsibilities of the Sponsor and Business Owner, there is a still a reluctance amongst senior leaders to lead from the front in case it’s a failure and reflects negatively on them. I think this is an education piece and leaders need to trust change managers.
Change Compass: What are the most critical and most useful things to focus on when you first start on a project, and why.
Fiona: These tend to be the questions I focus on … • What are the business drivers? Why? Because this helps form the narrative and links to strategy and then to the frontline – “What’s in it for me?” • Who is the Sponsor and how actively engaged are they? They need to be involved and advocating throughout the project. • How much funding is set aside for Change Management ? I’ve implemented change on a shoestring but its better if there is funding for communication and training as this indicates consideration for the recipients. • What’s the organisations history of managing change – is there a “good” change example and what made it stand out, conversely what was a poor experience and what factors contributed to it ? • What is the culture like ? Take note of employees’ surveys as they provide markers on morale and pain points. • Finally identify a network of strong champions and advocates to help the change and provide them with the tools to do this.
Change Compass: As change practitioners we don’t often get to stick around to see the fruits of our labour, but from your experience what are the top factors in driving full change adoption?
Fiona: For me …. • Understanding the future state and identifying existing organisation metrics that can monitor and measure, or if there are gaps, ensuring these are filled before the change. • Handover to a committed business owner to manage and maintain momentum and who understands their role and responsibilities. • Building governance structures to review and report on the changes to the Executives or using existing forums. • Reporting and tracking are key but also other types of controls such as operating procedures and training. • Involving other areas such as QA, Compliance, HR and Finance in the discussions relating to embedment
Change Compass: You’re known to be great at explaining complex changes to stakeholders. What’s your secret?
Fiona: I have the grandmother test … would your grandmother understand this? Also, use basic communication rules such a targeting your audiences – there’s a difference between communicating to white collar and blue collar. Other tips include … • Use storytelling and personas your audience can relate to • Use your advocates and sponsors to spread the message. • Keep it simple and use a variety of mediums
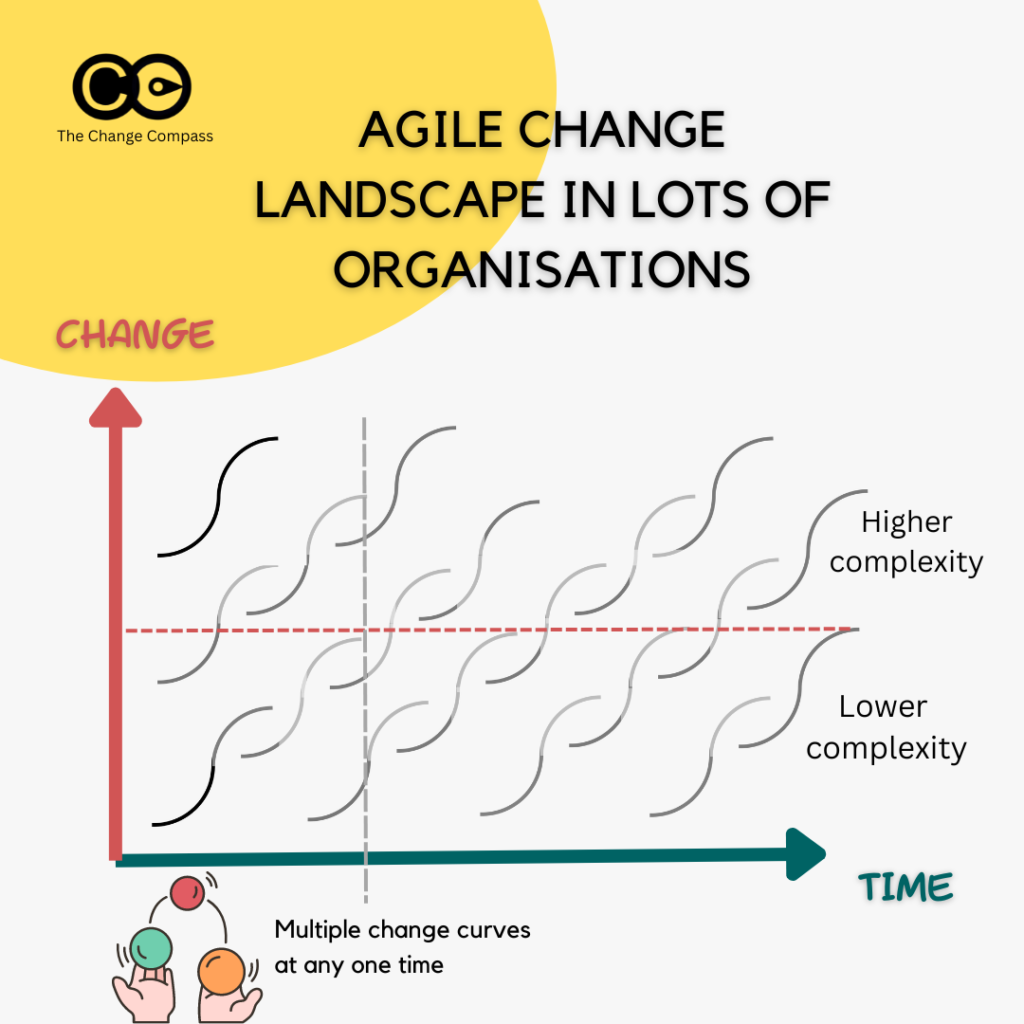
There is no change curve. A single change curve doesn’t exist in most organisations. The concept of a single change curve means you’re always looking at it from the myopic lens of a single project or a single change. If we adopt a humanistic and human-centred view, what we see is that at any one time there are likely multiple change curves happening, to the same person, the same team, the same organisation.
At any one time, an impacted stakeholder maybe undergoing the 3rd iteraction of changes in one project, whilst partially adopting the new behaviours of another project, whilst just learning about the details of yet another project. And it may not even be projects or programs. It could be smaller team-led continuous improvement initiatives.
The concept of Agile methodology has revolutionized the way organizations approach software development and project management. It emphasizes flexibility, adaptability, and continuous improvement. However, the frequent introduction of multiple Agile changes within an organization can lead to multiple ‘S’ curves, which can result in several challenges related to adoption and business performance and capacity.
Multiple S curves refer to the continuous introduction of new Agile changes, each of which leads to a new adoption process and a corresponding performance improvement. This results in a series of S-shaped curves, each representing a different stage of the Agile adoption process.
The S curve is assuming that all of the changes are well implemented with good people experiences. The initial curve shows the slowness of the change adoption in the beginning, followed by a faster change adoption process, and finally capering off.
However, when the change is not well implemented due to various reasons the experience can be more like a V curve, where the experience and performance dips down into the ‘valley of despair’, followed by a ramp-up of improving experiences and change adoption.
The introduction of multiple Agile changes within an organization can lead to several challenges related to adoption and business performance and capacity. Firstly, continuous change can lead to confusion and uncertainty among employees. It can be difficult for employees to keep up with the latest changes and understand how they should adjust their work processes accordingly. This can result in decreased productivity and morale among employees.
Moreover, frequent changes can also result in increased cognitive strain and workload for employees. They may need to continuously learn new processes and techniques, leading to burnout and decreased job satisfaction.
Another challenge of having multiple Agile changes is that it can lead to decreased consistency in processes and outcomes. Each change may result in different outcomes and different ways of working, making it difficult to standardize and measure performance. This can result in a lack of accountability and a decrease in the organization’s overall efficiency.
In addition to the challenges related to adoption and performance, multiple Agile changes can also result in a decreased business capacity. The frequent changes can disrupt established workflows, making it difficult for teams to complete projects in a timely manner. This can lead to decreased project velocity and increased project risk, making it challenging for the organization to meet its goals and objectives.
So, while Agile methodology is a powerful tool for organizations, the frequent introduction of multiple Agile changes can result in several challenges related to adoption, performance, and capacity. To mitigate these challenges, organizations should take a strategic approach to Agile adoption, ensuring that changes are well-planned, communicated effectively, and implemented in a controlled manner. By doing so, organizations can ensure that the benefits of Agile methodology are realized while minimizing the risks associated with multiple changes.
To truly manage the multiple change curves, data is key. Without understanding which change curves are happening at what time it is not possible to manage change holistically. With data, you can easily drill into what is happening when, to whom, to what extent, and in what way. It is only with data that we can effectively orchestrate change across the board.
If you are going on a journey to capture change impacts across the organisation, be aware of how you are capturing the data so that you are truly addressing business issues critical to the organisation. For example:
Ensure that the data captured can be easily formatted and visualised to support a range of business decision-making contexts without too much manual work. The more manual the set up of the data is, the more time and effort it requires to answer the various data cuts that stakeholders may be needing
Balancing critical data points required versus having too many data fields and therefore too Cumberland and difficult to capture the data. The more data you are required to collect, the more complex the process is for those whom you are collecting the data from
Thanks to the nature of agile projects, the data will change constantly. The tracking of constantly changing change data is critical. However, it should also be easy and quick to update the data
Organisations under changes will invariably have changes in organisational structures, teams or roles. Ensure that your data-capturing process makes it easy to update the structure as they change.
Have a chat with us to understand more about how to leverage digital solutions to multiple change impacts across the organisation, and how to leverage AI and automation to make your lives easier in leveraging a data platform to make critical business decisions using change impact data.
So next time you talk about THE change curve, just be aware that you’re likely not adopting a people-centric view of change. You may want to look more holistically at what your impacted stakeholders are undergoing or about to undergo. Adopt a holistic mindset of what impacted stakeholders are going through as you plan out your change approach.
If you’re interested in exploring more about managing agile changes check out the following:
Designing a change adoption dashboard: what to measure, how to display it, and why it matters
A change adoption dashboard is one of the most underused tools in enterprise change management. Most organisations produce some form of change tracking, but relatively few have a dashboard that is genuinely decision-ready: one that tells programme sponsors and business leaders not just what activities have been completed, but whether the change is actually embedding in the way people work.
The difference between a change activity tracker and a change adoption dashboard is the difference between measuring what the change team has done and measuring whether the change is working. Getting that distinction right is what determines whether your dashboard becomes a governance instrument that drives action, or a reporting artefact that gets reviewed once a month and promptly ignored.
This guide sets out how to design an effective change adoption dashboard: the metrics to include at each stage of the change lifecycle, how to present them to different audiences, and how to use the dashboard to drive better decisions about where change support needs to be directed.
Why most change tracking falls short
The most common failure mode in change measurement is tracking outputs rather than outcomes. A standard change plan tracks activities: how many communications have been sent, how many training sessions have been delivered, how many stakeholder meetings have been held. These outputs matter as indicators of delivery, but they tell you almost nothing about whether the change is landing.
Prosci’s best practice research on change management metrics identifies three distinct levels at which change should be measured: organisational performance (did we achieve the intended business results?), individual performance (are employees adopting and using the new way of working?), and change management performance (did we execute the change activities well?). Most organisations only measure the third level. A change adoption dashboard needs to cover all three.
The second common failure is building a dashboard that is designed for the change team rather than for the business. If the only people reading the dashboard are the programme change manager and their direct team, it has limited governance value. An effective dashboard needs to be useful to programme sponsors, business unit leaders, and transformation governance committees, which means it needs to be readable in under five minutes and surfacing the questions and decisions that those audiences actually need to make.
The change adoption lifecycle and when to measure each stage
Change adoption is not a single moment. It is a journey from awareness through to sustained proficiency, and different metrics are relevant at different stages. Designing a dashboard without this lifecycle context leads to the most common design error: measuring adoption before people have had enough exposure to the change to actually adopt it.
The adoption lifecycle for most enterprise changes follows five stages: awareness, understanding, readiness, adoption, and proficiency.
Awareness is the entry point. Employees need to know the change is coming, what it involves at a high level, and why it is happening. Awareness metrics should be collected four to twelve weeks before go-live. Key indicators include communications reach (the percentage of the affected population who have received awareness communications), and awareness survey scores (the percentage who can correctly describe what is changing and when).
Understanding goes deeper than awareness. It measures whether employees understand what the change means specifically for their role: what they will need to do differently, when, and how they will be supported. Understanding metrics are typically collected two to six weeks before go-live. Key indicators include role-specific briefing attendance rates and understanding survey scores capturing role clarity confidence.
Readiness measures whether employees feel prepared to perform differently at go-live. This is the most critical pre-go-live measurement point and the one where intervention time is most valuable. Readiness metrics collected four to six weeks before go-live allow targeted support to be deployed where confidence is lowest. Key indicators include readiness survey scores by group and role, manager readiness assessments, and training completion rates against plan.
Adoption is the first post-go-live measure. It answers the question: are people using the new system, process, or way of working? Adoption metrics should begin being collected from the first week after go-live and tracked at regular intervals for the following three to six months. Key indicators vary by change type but typically include system usage rates (for technology changes), process adherence rates (for process changes), and manager-observed behaviour alignment (for cultural or behavioural changes).
Proficiency is the sustained adoption measure. It goes beyond whether people are using the new way of working to whether they are using it well: accurately, efficiently, and without reverting to old habits under pressure. Proficiency metrics become relevant from three months post-go-live and are typically used in benefits realisation reviews. Key indicators include quality and error rates, process cycle times compared to target, and exception rates where the old process or system is being used in parallel.
The core metrics for a change adoption dashboard
Translating the lifecycle above into a dashboard requires selecting the right metrics and presenting them in a format that is actionable. The following are the metrics that belong in an enterprise change adoption dashboard, organised by lifecycle stage.
Pre-go-live metrics
Communication reach rate: the percentage of the target population who have received and opened change communications, tracked by communication channel and stakeholder group. A reach rate below 70% in the four weeks before go-live is a significant warning sign.
Training completion rate: the percentage of employees who have completed required training as a proportion of the total enrolled population, tracked by group. Completion rates should be segmented by role type and location to identify where completions are lagging. A completion rate below 80% two weeks before go-live typically indicates a resourcing or scheduling problem that needs immediate escalation.
Readiness score by group: the average self-reported confidence score from readiness surveys, segmented by business unit, role, and geography. The dashboard should display both the current score and the trend from the previous survey cycle. Groups scoring below the predefined readiness threshold should be highlighted as requiring intervention.
Manager readiness index: a composite score measuring the degree to which line managers feel equipped to support their teams through the change. This is often the single most predictive pre-go-live indicator of post-go-live adoption success, and it is frequently under-measured.
Post-go-live adoption metrics
Adoption rate by group: the percentage of the target population actively using the new system, process, or way of working, segmented by business unit, role, and geography. For technology-enabled changes, this can be pulled directly from system usage analytics. For process changes, it requires direct observation or survey-based measurement.
Time to adoption: the time elapsed between go-live and each employee reaching a defined adoption threshold. Tracking the distribution of time to adoption by group allows the dashboard to identify which cohorts are lagging and where support needs to be concentrated.
Resistance indicators: quantified signals of active or passive resistance, including workaround usage rates (employees finding alternative ways to do tasks rather than using the new process or system), helpdesk ticket volumes related to the change, and manager-escalated concerns. A spike in resistance indicators in the first four weeks post-go-live often predicts below-target adoption at the three-month mark.
Benefits tracking progress: the percentage of expected benefits that are currently on track to be realised, measured against the programme business case. This metric links adoption data directly to the business value argument, which is what executive sponsors care most about.
Sustained proficiency metrics
Accuracy and error rate: for changes that affect operational processes or technology, the quality of outputs using the new way of working compared to target. An error rate that remains elevated three months post-go-live is a strong signal that proficiency support is needed.
Regression rate: the percentage of employees who initially adopted the new way of working but have since reverted to the old approach. Regression is often invisible without dedicated measurement, but it is one of the most common causes of benefits shortfall.
Embedding score: a composite metric capturing whether the change has become the standard way of working rather than an overlay on existing habits. Embedding is assessed through a combination of manager observation, peer review data, and process compliance audits.
Structuring the dashboard for different audiences
The most effective change adoption dashboards are not single views. They are layered presentations of the same underlying data, tailored to different audiences and different decision-making needs.
Programme governance dashboard (executive): designed for programme sponsors and steering committees. Should present adoption rate, readiness score, and benefits tracking progress as headline metrics, with a clear red/amber/green status indicator and a concise narrative on the key risks and decisions required. This view should be updatable in under two hours and presentable in under five minutes.
Business unit view (operational): designed for business unit managers and team leaders. Should present adoption and readiness data disaggregated to their specific group, with comparison to the programme-wide averages. The most valuable element for this audience is visibility of how their group is tracking relative to the rest of the organisation, which creates natural accountability.
Change management team view (delivery): designed for change practitioners managing the programme. Should present the full set of metrics across all lifecycle stages, with trend data, intervention history, and leading indicators. This is the working dashboard that drives day-to-day decisions about where to direct communication, coaching, and training activity.
For organisations managing multiple concurrent programmes, the portfolio-level view becomes critical. Change Compass provides a platform specifically designed for this challenge: aggregating adoption data across all programmes into a single portfolio view that allows change functions to see which programmes are embedding well, which are falling behind, and where cumulative adoption demand is creating saturation risk across the same stakeholder groups.
Building the data infrastructure behind the dashboard
A dashboard is only as reliable as the data feeding it. The most common reason change adoption dashboards fail in practice is not the design: it is the data infrastructure. Specific issues include inconsistent data collection across programmes (making aggregation impossible), manual data entry that is too time-consuming to maintain between reporting cycles, and survey instruments that are not standardised enough to allow trend comparisons.
Building a sustainable data infrastructure for a change adoption dashboard requires three things:
Standardised instruments across all programmes: every programme change impact assessment, readiness survey, and adoption tracking instrument must collect data in a consistent format. Even small variations in scale or question wording make trend analysis unreliable. This requires a central change function to set and enforce standards, not leave them to each programme team.
Automated data collection where possible: for technology-enabled changes, system usage data can be automatically extracted and fed into the dashboard without manual intervention. For survey-based metrics, lightweight pulse survey tools with automated scheduling significantly reduce the data collection burden.
A shared data platform: adoption data that sits in individual programme SharePoint folders or local spreadsheets cannot be aggregated or maintained over time. A shared platform with a structured data model is the difference between a dashboard that is updated once per quarter under duress and one that reflects the current state of the change portfolio at any given moment.
The Change Compass platform provides the data infrastructure and visualisation capability that makes enterprise-scale change adoption dashboards sustainable in practice. The Change Automator extends this with workflow automation that handles the routine data collection and update tasks that otherwise consume change team time.
Common design mistakes to avoid
Several predictable design errors undermine the value of change adoption dashboards in practice.
Measuring activity instead of adoption: including metrics like “number of communications sent” or “number of training modules completed” as headline figures in an executive dashboard confuses output with outcome. Activity metrics belong in the delivery team view, not in the governance dashboard.
Displaying data without a threshold or benchmark: a readiness score of 3.4 out of 5 means nothing without knowing what the target is and what the current score was last cycle. Every metric on a change adoption dashboard should have a defined threshold and a trend indicator.
Updating the dashboard too infrequently: monthly updates are almost always insufficient for a governance dashboard. The lag between data collection and reporting creates a situation where by the time a risk is flagged, the window for effective intervention has often already passed. The minimum viable cadence for most programmes is fortnightly for pre-go-live readiness metrics and weekly for the first month post-go-live.
Failing to link adoption to business value: the audience that controls change management resources and sequencing decisions is an executive audience that thinks in terms of business outcomes. A dashboard that cannot connect adoption performance to expected benefits realisation will always struggle to secure the attention and action it needs.
Making the dashboard drive action
The ultimate test of a change adoption dashboard is not how well it is designed. It is whether it changes what happens. A dashboard that produces beautifully formatted reports that are reviewed and filed without any change to programme decisions has no value.
The governance mechanism around the dashboard matters as much as the design. Every metrics review session should conclude with explicit decisions: which groups need additional support, what form that support will take, who is accountable for delivering it, and by when. The intervention log in the dashboard should record these decisions and track their completion.
Prosci research on change management KPIs consistently identifies that organisations actively measuring and acting on change data are significantly more likely to meet or exceed their project objectives. Measurement without action is just administration. The purpose of a change adoption dashboard is to make the right interventions happen at the right time.
From dashboard to decision: a practical starting point
For change functions starting from scratch, the path to a decision-ready change adoption dashboard does not require building everything at once. The practical starting point is selecting three to five metrics that are already collectible with current resources, establishing a defined threshold for each, setting a regular reporting cadence, and creating a standing agenda item in programme governance for the dashboard review.
Once that foundation is in place, additional metrics, automation, and portfolio-level aggregation can be layered in progressively. The organisations with the most effective change adoption dashboards today did not build them in a single programme cycle. They built them iteratively, driven by the decisions they needed to make and the data that could most reliably inform those decisions.
Frequently asked questions
What should be on a change adoption dashboard?
An effective change adoption dashboard should include metrics across the full adoption lifecycle: pre-go-live metrics covering communication reach, training completion, and readiness scores; post-go-live adoption metrics including adoption rate by group, time to adoption, and resistance indicators; and proficiency metrics covering accuracy rates, regression rates, and embedding scores. Each metric should have a defined threshold and a trend indicator against the previous reporting period.
How often should a change adoption dashboard be updated?
For programmes in active delivery, fortnightly is the minimum viable update cadence for pre-go-live readiness metrics. In the first four to six weeks after go-live, weekly updates are appropriate for adoption metrics, as this is the highest-risk period for early regression. Once adoption has stabilised above target, monthly updates for proficiency metrics are generally sufficient.
What is the difference between adoption rate and proficiency rate?
Adoption rate measures whether employees are using the new system, process, or way of working at all. Proficiency rate measures whether they are using it correctly and efficiently. Both are important, but they become relevant at different points in the change lifecycle. Adoption is the first post-go-live measure; proficiency becomes meaningful from three to six months post-go-live once the initial learning curve has passed.
How do you measure change adoption for a process change (not a system change)?
For process changes without a system to generate automatic usage data, adoption measurement relies on a combination of manager observation scorecards (structured assessments of whether teams are following the new process), quality and error rate data from process outputs, exception tracking (instances where the old process is being used instead of the new one), and periodic survey-based self-assessment. These methods are more resource-intensive than system analytics but are entirely viable with a clear measurement framework.
What is a good target adoption rate?
A benchmark adoption target of 70 to 90% of the target population actively using the new way of working is commonly used in enterprise change programmes, with 80% being a typical minimum threshold for declaring a change “embedded.” However, the right target depends on the nature of the change, the risk of non-adoption, and the degree to which proficiency is required for the intended benefits to be realised. Critical compliance or safety changes require higher adoption thresholds than optional process improvements.
It is the year of rabbit in the Chinese New Year of 2023. A quarter of the world’s population celebrates this. It is also the first year that a lot of countries are emerging from Covid and where there are little or no restrictions on travel and movement. People are travelling again and taking vacations. There is optimism in the air. Optimism that hopefully, the year brings better luck in health and economy for people a new year with hopefully less change and fewer disruptions.
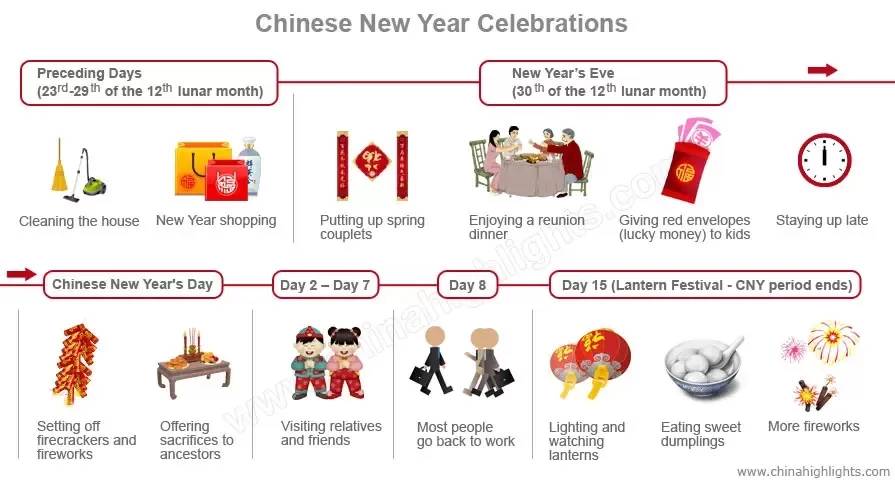
With any Chinese New Year, there is a set of traditional customs that accompany the new year. These customs have developed over the years as people gather to pray, to gather, to celebrate, and to make wishes for the new year. For example, the customs of a family getting together to clean their house, having dinner, and staying u late on New Year’s Eve were formed in the Wei and Jin dynasties (220-420 AD). From the Tang dynasty (618-907 AD) entertainment formed including as firecrackers, dragon and lion dances, and lantern shows.
These customs have been formed to welcome the new and the good and remove the bad and the old. It helps to gear the families and communities to bring positivity in facing the new year. These rituals help people focus on the milestone and use it as an opportunity to reset and renew.
In running change projects, we also need to re-gear ourselves for the new year so that we ourselves are in the right head space and outlook to drive successful change in the new year. How might we do this? Chinese new year customs offer some useful suggestions.
Tip 1 – Getting the house in order
To prepare for the new year the Chinese clean their houses and surrounding areas as a symbol of sweeping out any misfortune and traces of bad luck. This is aimed to rid the house of back luck and misfortune of the past to open up the spaces for all that is new, including good luck.
Change practitioners should also follow suit to ensure that their change initiative is set up for success. Keeping the ‘house in order’ means:
Ensuring the documentation and data are optimised, easy to access, orderly, and can meet audit requirements.
Access to files is well organised and appropriate. Roles that no longer require access may need permission updates
The change team resourcing is optimised. Is there sufficient change resources to meet project requirements for the new year? How can resourcing be optimised? If the change management stream was asked to cut costs, what would be items to consider?
Tip 2: Visiting relatives and friends – or stakeholders
Another Chinese New Year custom is to visit friends and relatives. This is a way for people to bring good wishes to each other. Often these visits involve bringing gifts such as fruit and local products.
Change practitioners should begin the new year by meeting with various stakeholder groups. Bring positive thoughts and wishes to your meetings. Re-connect with your stakeholder groups to find out how their holiday period fared. This may be one of those few opportunities during the year where you’re able to connect to your stakeholders at a personal level by understanding more about their families (whatever form the family may consist of).
When you re-connect with your stakeholder groups, think about:
What are the new or changing needs of your stakeholders in the new year?
Which stakeholders do you need to spend more or less time with as a result of your experience last year?
Where are your stakeholders along the change journey? What else could help to speed up their adoption of the change?
What communication, engagement, and learning needs have worked well or not so well with them?
Typical Chinese New Year customs
Tip 3: Setting off firecrackers and fireworks – or re-highlighting the change
In the Chinese New Year, the firecrackers and fireworks are to create a festive atmosphere to welcome the new year. It is about creating the right environment.
In a similar way, change practitioners need to think about how to open the new year with a bang to re-orient their stakeholders to focus on the change. This does not mean setting off fireworks literally. But it means being clear about what communications and engagement tactics might be needed to create the right environment for people to focus on the change in the new year.
It may not need to be a communications campaign. Some ideas of what may work in organisations to draw attention to re-orientate back to the focus on the change:
An interview with the project sponsor
Town hall session
A social lunch or drinks session
Posters and cards
Emails about the focus for the year
Show-and-tell session about the holiday period
Tip 4: New year’s shopping – or update
People buy food and gifts for Chinese New Year for friends and family to celebrate the fresh new year. This also includes wearing new clothes as a symbol of good health and prosperity for the new year.
In a similar vein, change practitioners should think about what reset or update is needed for the new year. What has been learned from the past year which can be applied in the new year? Does the change approach need to be adjusted or tweaked for the new year?
What aspects of the change needs to be updated for the new year?
These might include such as:
New survey format or tool to allow the project to easily design conditional questioning to probe deeper into potential change readiness and change adoption blockers
Change messaging or positioning that may need to be tweaked to better resonate with particular stakeholder groups. Look at the data in terms of feedback, click rates, or viewership rate of communication materials as evidence
Change measurement system may need to be tweaked. Are you able to collect the right type and level of data to make critical change decisions? How should measures be altered accordingly to better suit the demands of the new year?
Leverage AI and automation to work more productively and deliver more value. There is ChatGPT which is wildly talked about that can uses to write content for all types of purposes. The Change Compass also offers a range of automation and AI tools to make your lives easier in delivering change
These are some of the ways in which change practitioners can practice traditional Chinese New Year’s customs and rituals and apply them to their projects. Customs have been formed over hundreds of years and exist to mark milestones collectively for people. They help gear us for the new year, to be better prepared, and to be in the right mindset. Moreover, they help us to have the capacity to be optimistic. Through optimism, we can welcome the new year with intentions toward successful change.
In this Change Practitioner Q&A Series we interview change practitioners to find out more about how they approach their work.
A bit about Alvaro …
Alvaro is a change and program management professional, with experience in diverse industries, from Energy & Utilities, Education, Tech, Professional services, and Financial Services. He has worked across programs in transformation, technology, restructures, risk, regulatory, and culture.
Change Compass: Hi Alvaro, describe yourself in 3 sentences
Alvaro:
Personally, I tend to be cheerful and optimistic.
Professionally, I’m quite driven. I love to play a big part in complex pieces of work, being accountable for end-to-end delivery.
I like to “zoom in and out”. Diving into particular task detail, and also being clear of its value in the organisation, community, and society as a whole.
Change Compass: What has been the most challenging situation for you as a change practitioner? Tell us what happened and how you fared through it.
Alvaro:
The evolving nature of the change role and therefore the expectation on me as a practitioner. The definition of “change practitioner” is subjective across industries, teams, and projects; and thus, the “role” is not necessarily tied to a “title”. I’ve experienced this multiple times on projects.
Consider the overlap between the change analyst and business analyst roles, or between a change manager and a project manager. Since change management is not an isolated function, but rather is embedded across various teams, roles, activities, and artefacts (e.g., implementation plan), it’s not always easy to clarify roles and responsibilities. And this overlapping becomes more blurred when you add Agile ways of working/methodologies, product management, human-centred design, etc, which reminds me of The Change Compass articles on the role of Change Management in Agile.
These situations may be problematic if people in the team believe change management is an isolated function, or limit the practitioner to a particular methodology, potentially leading to “step on toes” situations – which I’m sure your readers are familiar with.
To overcome this, in the short term, I’ve spent time ensuring clarity of roles and responsibilities. Sometimes, this requires peer education on what change management is, which might even lead to some tough conversations. However, we should at least try to agree on common ground.
In the long-term (and I think we are heading there), industries, communities of practice, and professionals overall should move away from resourcing based on “titles” to evaluating “skills”. For example, rather than requesting a PM and a Change Lead, let’s think about the skills required for the management of such a piece vs the volume of expected effort.
Change Compass: What are the most critical and most useful things to focus on when you first start on a project, and why.
Alvaro: I would say three things:
1) Data: From PMO/CMO, find out about the product, service, and industry… but to start, obtain an employee list with information on location, business areas, and roles. This will allow you to dissect the organisation to understand the complexity of each area, and how to best plan your engagement. All you need is the basic understanding of organisational design, and pivot table skills.
2) Governance: Change professionals are usually not accountable for this, but we should definitely be a part of it. It makes a difference when roles and responsibilities (from business sponsor to the intern), communication, and approval channels are clear. This includes agreed ways of working. I don’t mean unnecessary formal documentation or undesired and draining team-building workshops. A visual representation (accessible for contributors) with one or two conversations should suffice.
3) Project documentation as a product: Clear, honest, diligent, and accessible documentation on what you are working on, feeling comfortable to disclose the work in progress. If you treat your project documentation as a great product for your stakeholders (from the beginning), you’ll save a lot of time for them and yourself (and they will love you for it).
TIP: Look at the collaboration tools at the company. Some are better than others, I strongly recommend Confluence.
Change Compass: As change practitioners, we don’t often get to stick around to see the fruits of our labour, but from your experience what are the top factors in driving full change adoption?
Alvaro:
Discuss with your team and business owners the expected adoption and embedment outcomes from the beginning, including how they will be measured.
Include a decent timeframe within the implementation plan for adoption and embedment work (before and after Go Live). Do not squeeze this within “hyper-care”.
Understand the embedment systems at the organisation (if any). This may include existing forums, regular surveys, champions, and team leader/supervisor conversations within the business. Instead of creating “new” sessions, you can agree with the business to leverage these.
Adoption & embedment documentation tends to be a “tick the box” exercise. Those supervising change within organisations need to be more outcome-oriented, rather than auditors (checking if the change manager completed “x” or “y” artefact). This will promote a focus on the quality of delivery, over a focus on the completion of documentation. For change managers, it means moving from “I’ve done the embedment plan” to “I’ve co-designed an embedment plan with the stakeholders”.
Change Compass: You’ve been known as great at managing tough stakeholders. What’s your secret?
Alvaro:
The honest yet boring side of it is that I actually enjoy conflict resolution. Years back, I used to work at a restaurant and my peers would always ask me to resolve a situation with a tough customer. It doesn’t sound like helpful advice, right? Well, I guess my take is: practice conflict resolution! You may understand it but it gets better with experience. Other things are:
• Empathy: You never talk to a “title” (e.g., Executive Manager), they are a person, with a life behind their job. • Transparency: Don’t play politics… it’s 2022 at the time of this article. Be yourself and say what and how things are. • Vulnerability: Geez! This one is so important. Admitting you (or what you represent) might be wrong (or can be better) is extremely powerful. Build trust by being human.
Change Compass: If you could alter the change management practice for the better, what would you want to see happen?
Alvaro:
I would love to see a focus on skills, not titles or fixed “change methodologies”. This also includes seeing change as embedded across roles, artifacts, and activities, not as an isolated function.
Skills for a change practitioner must include strong project management, as well as data analysis to drive decisions in engagement, overall timing, and measurement. This includes companies using integrated tools to understand change across the organisation, as well as change practitioners understanding how to leverage them.
Finally, change management institutions and communities of practice must push to better integrate change management within project management methodologies. For example, as part of Prince 2 or Safe Scrum. There’s no need for a “change role”, but many aspects are missed (or unclear).