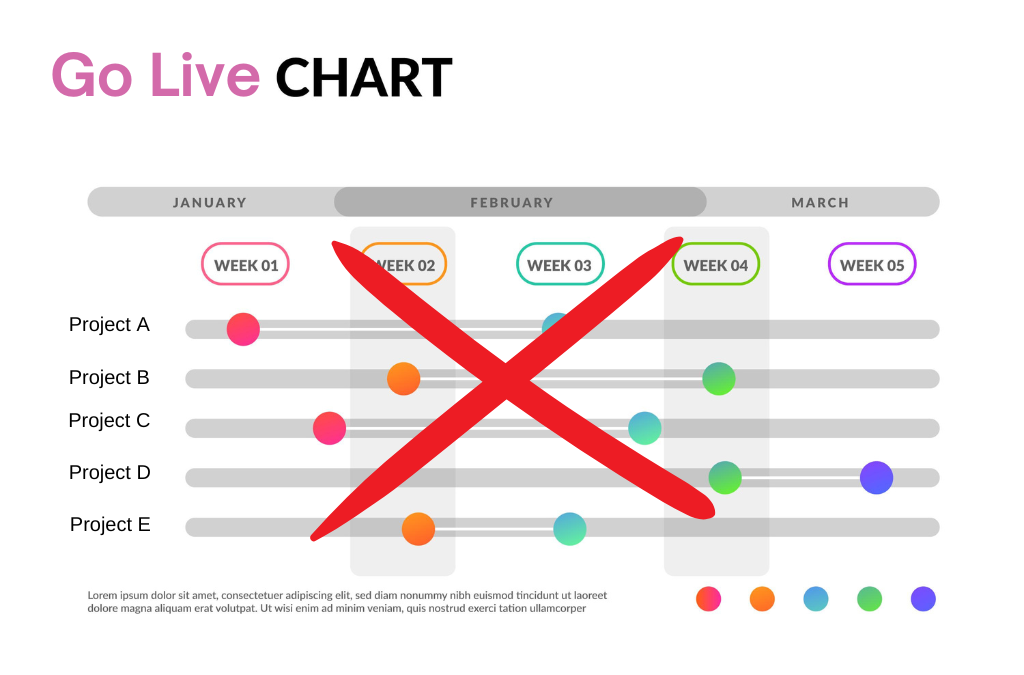
In the world of change management, Go Lives are often seen as significant milestones. For many project teams, these events represent the culmination of months or even years of hard work, signaling that a new system, process, or initiative is officially being launched. It’s common for stakeholders to view Go Lives as a key indicator of the success of a change initiative. However, while Go Lives are undeniably important, relying on them as the primary measure of change impact can be misleading and potentially harmful to the overall change effort.
Go Lives are just one piece of the puzzle. Focusing too heavily on these milestones can lead to an incomplete understanding of the change process, neglecting crucial activities that occur both before and after Go Live. Let’s outline the risks associated with using Go Lives to report on change management impacts and offers best practices for a more holistic approach.
Go Lives: A Double-Edged Sword
Go Lives are naturally a focal point for project teams. They represent a clear, tangible goal, and the success of a Go Live can boost morale, validate the efforts of the team, and provide a sense of accomplishment. From a project delivery perspective, Go Lives are critical. They signal that the project has reached a level of maturity where it is ready to be released to the broader organization. In terms of resourcing and business readiness, Go Lives ensure that everything is in place for the new system or process to function as intended.
However, the very attributes that make Go Lives attractive can also make them problematic as indicators of change impact. The simplicity and clarity of a Go Live event can lead stakeholders to overestimate its significance, from a impacted business perspective. The focus on Go Lives can overshadow the complex and often subtle changes that occur before and after the event. While a successful Go Live is necessary for change, it is not sufficient to guarantee that the change will be successful in the long term.
The Pre-Go Live Journey: Laying the Foundation for Change
A significant portion of the change management journey occurs long before the Go Live date. During this pre-Go Live phase, various engagement and readiness activities take place that are critical to shaping the overall impact of the change. These activities include town hall meetings, where leaders communicate the vision and rationale behind the change, and briefing sessions that provide detailed information about what the change will entail.
Training and learning sessions are also a crucial component of the pre-Go Live phase. These sessions help employees acquire the necessary skills and knowledge to adapt to the new system or process. Discussions, feedback loops, and iterative improvements based on stakeholder input further refine the change initiative, ensuring it is better aligned with the needs of the organization.
These pre-Go Live activities are where much of the groundwork for successful change is laid. They build awareness, generate buy-in, and prepare employees for what is to come. Without these efforts, the Go Live event would likely be met with confusion, resistance, or outright failure. Therefore, it is essential to recognize that the impact of change is already being felt during this phase, even if it is not yet fully visible.
Post-Go Live Reality: The Real Work Begins
While the Go Live event marks a significant milestone, it is by no means the end of the change journey. In fact, for many employees, Go Live is just the beginning. It is in the post-Go Live phase that the true impact of the change becomes apparent. This is when employees start using the new system or process in their daily work, and the real test of the change’s effectiveness begins.
During this phase, the focus shifts from preparation to adoption. Employees must not only apply what they have learned but also adapt to any unforeseen challenges that arise. This period can be fraught with difficulties, as initial enthusiasm can give way to frustration if the change does not meet expectations or if adequate support is not provided.
Moreover, the post-Go Live phase is when the long-term sustainability of the change is determined. Continuous reinforcement, feedback, and support are needed to ensure that the change sticks and becomes embedded in the organization’s culture. Without these ongoing efforts, the change initiative may falter, even if the Go Live event was deemed a success.
The Risk of Misleading Stakeholders
One of the most significant dangers of focusing too heavily on Go Lives is the risk of misleading stakeholders. When stakeholders are led to believe that the Go Live event is the primary indicator of change impact, they may not fully appreciate the importance of the activities that occur before and after this milestone. This narrow focus can lead to a number of issues.
Firstly, stakeholders may prioritize the Go Live date to the exclusion of other critical activities. This can result in insufficient attention being paid to pre-Go Live engagement and readiness efforts or to post-Go Live adoption and support. As a consequence, the overall change initiative may suffer, as the necessary foundations for successful change have not been properly established.
Secondly, stakeholders may develop unrealistic expectations about the impact of the change. If they believe that the Go Live event will immediately deliver all the promised benefits, they may be disappointed when these benefits take longer to materialize. This can erode confidence in the change initiative and reduce support for future changes.
Finally, a narrow focus on Go Lives can create a false sense of security. If the Go Live event is successful, stakeholders may assume that the change is fully implemented and no further action is required. This can lead to complacency and a lack of ongoing support, which are essential for ensuring the long-term success of the change.
Best Practices for Reporting Change Management Impact
To avoid the pitfalls associated with relying on Go Lives as indicators of change impact, change management practitioners should adopt a more holistic approach to reporting. This involves considering the full scope of the change journey, from the earliest engagement activities to the ongoing support provided after Go Live. Here are some best practices for reporting on change management impact:
Integrate Pre-Go Live Metrics:
Track and report on engagement activities, such as attendance at town hall meetings, participation in training sessions, and feedback from employees.
Monitor changes in employee sentiment and readiness levels throughout the pre-Go Live phase.
Report on aggregate pan-initiative change initiative impost on business units, pre-Go Live
Emphasize Post-Go Live Support:
Develop metrics to measure the effectiveness of post-Go Live support, such as the number of help desk inquiries, employee satisfaction with the new system, and the rate of adoption.
Highlight the importance of continuous feedback loops to identify and address any issues that arise after Go Live.
Communicate the need for ongoing reinforcement and support to stakeholders, emphasizing that change is an ongoing process
Report on post-Go Live adoption time impost expected across initiatives
Provide a Balanced View of Change Impact:
Ensure that stakeholders understand that Go Live is just one part of the change journey and that significant impacts occur both before and after this event.
Use a combination of quantitative and qualitative data to provide a comprehensive view of change impact.
Regularly update stakeholders on progress throughout the entire change journey, not just at the time of Go Live.
Manage Expectations:
Clearly communicate to stakeholders that the full impact of the change may not be immediately visible at the time of Go Live.
Set realistic expectations about the timeline for realizing the benefits of the change.
Prepare stakeholders for potential challenges in the post-Go Live phase and emphasize the importance of ongoing support.
While Go Lives are important milestones in the change management process, they should not be used as the sole indicator of change impact. The journey to successful change is complex, involving critical activities before, during, and after the Go Live event. By adopting a more holistic approach to reporting on change management impact, practitioners can provide stakeholders with a more accurate understanding of the change journey, manage expectations more effectively, and ensure the long-term success of the change initiative.
The key takeaway is that change management is not just about delivering a project; it’s about guiding an organization through a journey of transformation. Go Lives are just one step in this journey, and it is the responsibility of leaders to ensure that every step is given the attention it deserves.
Every change management team can describe what they did. Very few can demonstrate what difference it made. This measurement gap is not just an inconvenience; it is the single biggest reason change management struggles to secure resources, retain executive attention, and prove its value as a strategic function.
The data makes the case unequivocally. Prosci’s benchmarking research across 2,600 practitioners found that 88% of projects with excellent change management met or exceeded their objectives, compared to just 13% with poor change management. Gartner’s 2025 research found that organisations achieving healthy change adoption report two times higher year-over-year revenue growth. The correlation between effective change management and business performance is not in question. What is in question is whether your organisation can measure it.
This guide provides a practical framework for measuring change management success, from selecting the right KPIs to designing dashboards that influence executive decisions.
The measurement problem: activities versus outcomes
The most common mistake in measuring change management success is confusing activity with impact. Counting the number of communications sent, training sessions delivered, or stakeholder meetings held tells you nothing about whether anyone changed their behaviour. Yet these activity metrics dominate most change management reports.
Why activity metrics persist
Activity metrics are easy to collect, which is precisely why teams default to them. They also feel productive to report. But they create a dangerous illusion: a team that has delivered 40 training sessions and sent 200 communications can appear highly effective while the change itself is failing.
The shift to outcome measurement
Measuring change management success requires tracking what actually changed as a result of your interventions, not just what interventions you delivered. This means measuring whether people are using new systems, following new processes, demonstrating new behaviours, and whether those behavioural changes are producing the business outcomes the initiative was designed to achieve.
Prosci’s research on change management metrics reinforces this point: of organisations that measured compliance and overall performance, 76% met or exceeded project objectives. Among those that did not measure, only 24% achieved the same result.
A three-tier metrics framework for change management success
Effective measurement organises metrics into three tiers, each serving a different purpose and measured at a different point in the change lifecycle.
Tier 1: Leading indicators (pre-change and early implementation)
Leading indicators tell you whether the conditions for successful adoption are being established. They are predictive: if leading indicators are weak, adoption will almost certainly fall short.
Key leading indicators include:
Awareness levels: Percentage of affected stakeholders who can articulate what is changing and why
Sponsor engagement score: Frequency and quality of visible sponsorship behaviours (rated by direct reports, not self-assessed)
Readiness assessment results: Composite scores from structured readiness evaluations across impacted groups
Training effectiveness: Post-training knowledge assessment scores (not just completion rates)
Sentiment indicators: Employee pulse survey results on confidence, concern levels, and perceived support
Tier 2: Adoption indicators (during and post-implementation)
Adoption indicators measure whether the target population is actually using, following, or demonstrating what the change requires. This is where most measurement programmes either succeed or fail.
Key adoption indicators include:
System usage rates: Login frequency, feature utilisation, and transaction volumes in new systems
Process compliance: Percentage of transactions following the new process versus the old one
Behavioural observation data: Manager-reported or peer-reported evidence of new behaviours in practice
Error and rework rates: Declining error rates indicate proficiency is building; stable or rising rates indicate adoption gaps
Support ticket trends: Decreasing support requests over time suggest growing self-sufficiency
Impact indicators connect change adoption to the business outcomes the initiative was designed to deliver. This is where change management proves its strategic value.
Key impact indicators include:
Business outcome metrics: Revenue, cost savings, productivity gains, or customer satisfaction improvements attributable to the change
Sustained adoption rates: Usage and compliance levels 90 and 180 days post-implementation (not just at go-live)
Employee experience scores: Engagement, wellbeing, and voluntary turnover in heavily impacted groups
Speed to proficiency: Time from go-live to target performance levels
Return on change investment: Ratio of realised benefits to total change management investment
Leading versus lagging indicators: a comparison
Understanding the distinction between leading and lagging indicators is essential for designing a measurement approach that is both predictive and evaluative.
| Dimension | Leading indicators | Lagging indicators | |———–|——————-|——————-| | Timing | Measured before and during change | Measured after implementation | | Purpose | Predict likelihood of success | Confirm whether success occurred | | Action value | High, can course-correct in real time | Lower, confirms outcomes retrospectively | | Examples | Awareness scores, sponsor engagement, training effectiveness | Adoption rates, business outcomes, ROI | | Risk if ignored | You discover problems too late to fix them | You cannot prove value to stakeholders | | Data sources | Surveys, assessments, observations | System data, financial reports, performance metrics |
The most effective measurement programmes balance both: leading indicators to steer decisions during implementation, and lagging indicators to demonstrate value after the fact. For a deeper exploration of measurement methodology, see our ultimate guide to measuring change management outcomes.
Seven KPIs every change management team should track
While the specific metrics will vary by initiative, these seven KPIs provide a solid foundation for measuring change management success across most organisational changes.
1. Stakeholder awareness rate
Definition: Percentage of impacted stakeholders who can correctly describe what is changing, why, and how it affects their role. How to measure: Short pulse surveys (3-5 questions) administered at key milestones. Target: 80%+ awareness before go-live.
2. Active sponsor engagement score
Definition: A composite score measuring the frequency and visibility of sponsor behaviours, including communication, participation in change events, and removal of barriers. How to measure: Monthly assessment by the change team using a standardised rubric, validated by team feedback. Target: 7/10 or above on a standardised scale.
3. Training proficiency rate
Definition: Percentage of trained users who demonstrate competency in post-training assessments (not just attendance). How to measure: Knowledge checks, simulations, or practical demonstrations administered after training. Target: 85%+ pass rate on proficiency assessments.
4. Adoption rate
Definition: Percentage of the target population actively using the new system, process, or behaviour as designed. How to measure: System analytics, process audits, or structured observations. Target: 70%+ within 30 days of go-live, 90%+ within 90 days.
5. Time to proficiency
Definition: Average number of days from go-live until users reach target performance levels. How to measure: Track performance metrics (speed, accuracy, volume) from go-live and identify when they reach pre-defined thresholds. Target: Varies by change complexity; benchmark against organisational norms.
6. Change saturation index
Definition: Number of concurrent changes impacting each stakeholder group, weighted by degree of disruption. How to measure: Portfolio-level change impact assessment mapping all initiatives against affected groups. Target: No group exceeds 2-3 significant concurrent changes.
7. Benefit realisation rate
Definition: Percentage of projected business benefits actually realised within the defined timeframe. How to measure: Compare actual business outcomes against the benefits case approved at project initiation. Target: 80%+ of projected benefits realised within 12 months.
Common measurement traps to avoid
Even well-intentioned measurement programmes can go wrong. Watch for these patterns:
Measuring too late. Waiting until post-implementation to assess adoption means you have no opportunity to course-correct. By the time the data confirms a problem, the project team has moved on. Build measurement into every phase, starting with leading indicators well before go-live.
Activity metrics masquerading as outcomes. “We delivered 40 training sessions” is not a success metric. “85% of trained users passed the proficiency assessment” is. Always ask: does this metric tell me whether anything actually changed?
Vanity metrics. High email open rates and training attendance figures look good in reports but tell you nothing about whether behaviour changed. Focus on metrics that are uncomfortable to report when they are low, because those are the ones that matter.
Single-point-in-time measurement. Adoption at go-live is not the same as sustained adoption. Many changes show strong initial compliance that erodes within 90 days. Measure at 30, 90, and 180 days post-implementation to track sustainability.
Ignoring the portfolio view. Measuring success for each initiative independently can mask portfolio-level problems. A team that successfully adopted one change may have done so at the expense of another. Measure change management success at both the initiative and portfolio level.
How digital analytics platforms support measurement
WTW’s 2023 global study of 600 organisations found that companies taking a data-driven, proactive approach to change management drove nearly three times more revenue than those with below-average change effectiveness. The implication is clear: measurement is not just a reporting exercise; it is a competitive advantage.
Digital change management platforms such as The Change Compass enable organisations to track adoption metrics across the full change portfolio in real time, aggregate leading and lagging indicators into decision-ready dashboards, and identify measurement gaps before they become blind spots. For organisations managing multiple concurrent changes, these platforms replace manual spreadsheet tracking with continuous, portfolio-wide measurement intelligence.
To measure change management success effectively, stop counting what you did and start tracking what changed. Build a three-tier measurement framework that captures leading indicators early enough to steer decisions, adoption indicators during implementation to confirm behavioural change, and impact indicators after implementation to prove business value. The organisations that measure change management success rigorously do not just deliver better projects; they build the evidence base that secures ongoing investment in change capability.
Frequently asked questions
What are the most important KPIs for change management? The most critical KPIs are adoption rate (percentage of the target population using the new system or process as intended), sponsor engagement score, time to proficiency, and benefit realisation rate. These four metrics collectively measure whether the change was adopted, supported, efficient, and valuable to the business.
How do you measure change management ROI? Change management ROI compares the realised business benefits of a change initiative against the total investment in change management activities. Calculate it by quantifying the financial value of benefits achieved (cost savings, revenue gains, productivity improvements) and dividing by the total cost of change management resources, tools, and time. Express as a ratio or percentage.
What is the difference between leading and lagging indicators in change management? Leading indicators are predictive metrics measured before and during implementation, such as awareness levels, sponsor engagement, and training proficiency. Lagging indicators are retrospective metrics measured after implementation, such as adoption rates, sustained usage, and business outcome improvements. Both are essential for a complete measurement picture.
How soon after implementation should you measure change adoption? Measure at three intervals: 30 days post-implementation for initial adoption and early usage patterns, 90 days for sustained adoption and proficiency development, and 180 days for embedded behaviour change and benefit realisation. Single-point measurement at go-live is insufficient because it captures compliance, not true adoption.
Why do most organisations struggle to measure change management success? The most common barriers are reliance on activity metrics rather than outcome metrics, lack of pre-defined baselines against which to measure progress, absence of portfolio-level measurement capability, and insufficient integration between change management data and business performance data. Addressing these gaps requires both a measurement framework and the tooling to execute it at scale.
How do you build a change management measurement dashboard? An effective dashboard organises metrics into the three tiers (leading, adoption, impact), displays them against targets and baselines, and updates in near-real time. Include traffic-light indicators for at-risk metrics, trend lines showing trajectory over time, and portfolio-level aggregation across all active initiatives. Design it for the audience: executives want outcomes and ROI; project teams want adoption trends and risk indicators.
Suggested title: How to measure change management success: KPIs, metrics, and frameworks for 2026
Suggested meta description: Discover a 3-tier framework for measuring change management success with 7 essential KPIs. Move from activity tracking to outcome measurement.
Change Management outcome is the holy grail, and virtually all organisations are undergoing change. Now more than ever, companies are challenged with multiple layers of driving change simultaneously. What is applicable in this situation is not about a particular methodology of implementing a change program. It is all about implementing simultaneous changes, at the same time. There is no luxury of just focusing on one change at a time, the result of competitive, industry, and environmental challenges.
As change practitioners we work closely with our colleagues in Operations to get ready for, implement, and fully embed changes. So how do our colleagues in operations view and manage change initiatives?
Operations as a function is focused on managing performance and delivery to ensure that the business runs smoothly, with little disruptions, and that performance measures are achieved. Operations is focused on resource management, efficiency, and achieving the various operational indicators whether it’s customer satisfaction, turn-around time, average handling time, or cost target.
When times are hectic and a lot is going on with multiple change initiatives, the key focus for Operations is on managing people’s capacity. Key questions would be “Do we have sufficient time to cater for the various changes?”, and “Will we exceed our change saturation level?”. This is a critical question to answer since the business still needs to run and deliver services without negative change disruptions.
From an Operations planning perspective ‘change capacity‘ is often reduced to the time element, especially those impacting frontline staff.
For example:
What are the times required to reschedule the call centre consultants off the phone to attend training?
How much time is required in the team meeting agenda to outline the changes that are being rolled out?
What is the time involvement of change champions?
Though these are all critical questions clear answers will help Operations plan better to face multiple changes. However, this is not adequate. There is more to planning for multiple changes than just focusing on the time element.
Using the lego analogy to manage multiple changes
We all know LEGO as kids. To build a car we start one brick at a time and see how we go. We experiment with different colours, shapes, and sizes. We make do with the bricks we have and use our imagination to come up with what a car would look like. Sometimes we get stuck and we may need to tweak our bricks a little, or sometimes start from scratch.
It is the same as implementing change initiatives. In order to take people along the journey, we implement a series of activities and interventions so that our impacted stakeholders are aware, ready, committed, and embed the change. The design on the change journey is the process of determining what LEGO bricks to choose. There is no shortcut. It is not possible to build a building without each necessary brick to raise the building up. In implementing change, we also need to lay out each step in engaging our stakeholders.
McKinsey studies over decades have told us that one of the most critical factors to focus on in ensuring change outcome success is clear organisation-wide ownership and commitment to change across all levels. This means that when we design each change brick we need to ensure we target every level of impacted stakeholders.
For example:
Team Leaders: How often do we want Team Leaders to talk about the changes to their teams before the rollout? What content do we want them to use? Do they know how to translate the message in a way that resonates? Do we want them to tell compelling stories that talk to the what, why, and how of the change?
Managers: How are managers made accountable? What metrics are they accountable for? What mediums do we want them to use to engage their teams? What are the consequences of not achieving the outcomes?
Senior Managers: Through what mediums do we expect senior managers to engage their teams about the changes? How do we ensure that they are personally accountable for the success of the change? How are they involved to ensure they own the change?
Looking at the above you can see that for complex change there may need to be a lot of bricks in place to ensure the change outcome is successful!
Going back to the issue of facing into multiple changes, how do we play around with the bricks to ensure that multiple changes are successful? The same way that we play with LEGO bricks!
Look at the colours of the bricks. Do certain colours belong together? When we look across different initiatives, are there similar or common behaviours that can be better linked together to tell a compelling story? Do they support the same strategy? Can there be a joint campaign for these changes?
Is the overall LEGO structure going to be intact? What are the impacts of the various changes happening at the same time in terms of focus, performance and change outcome? Have we exceeded the likely ‘mental capacity’ for people to stay focused on a core set of changes at any one time? Will the pieced-together structure collapse due to having too many elements?
Look at the sizes of the LEGO structures. During implementation when we have both larger and smaller initiatives being executed at the same time, will the larger ones overshadow the smaller ones? If so what are the risks if any?
Re-jig or re-build parts of the LEGO structure as needed to see what it looks like. In a situation where we want to see what the changes look like before we action it, it makes sense to visualise what would happen if we move timelines or change implementation tactics
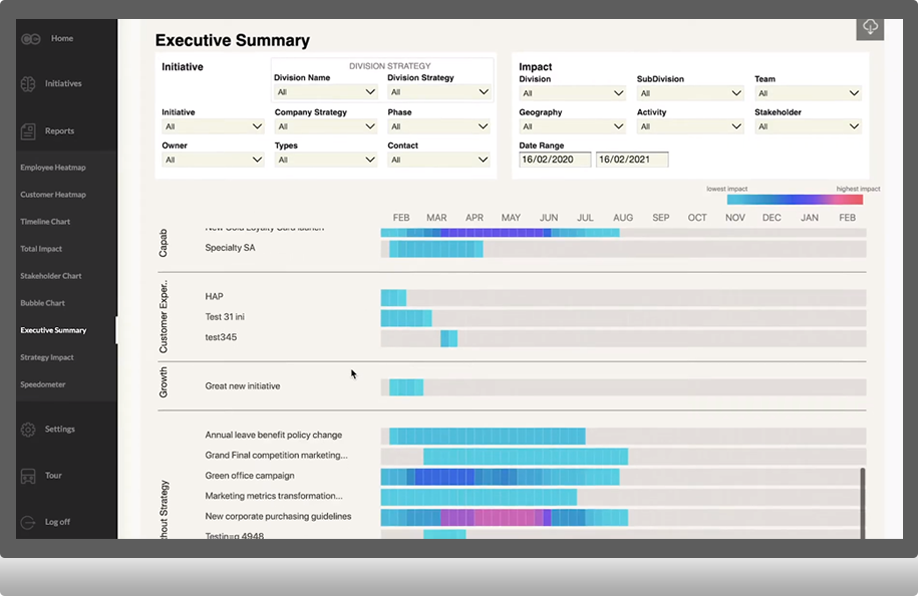
Example of data visualisation of ‘re-jigging’ change implementation timeline with The Change Compass using different scenarios.
Just like in building LEGO, for change initiatives we need to be agile and be flexible enough to play with and visualise what the change outcome could look like before pulling the trigger. We also need to be able to tweak as we go and adjust our change approaches as needed. In facing the multitude of changes that the organisation needs to be successful, we also need to be able to play with different implementation scenarios to picture how things will look like. Each brick needs to be carefully laid to reach the overall outcome.
Careful consideration also needs to be how all the bricks connect together – the analogy that the change outcomes across initiatives can be determined by how we’ve pieced together various pieces of LEGO for them to make sense, and result in the ownership and commitment of stakeholders.
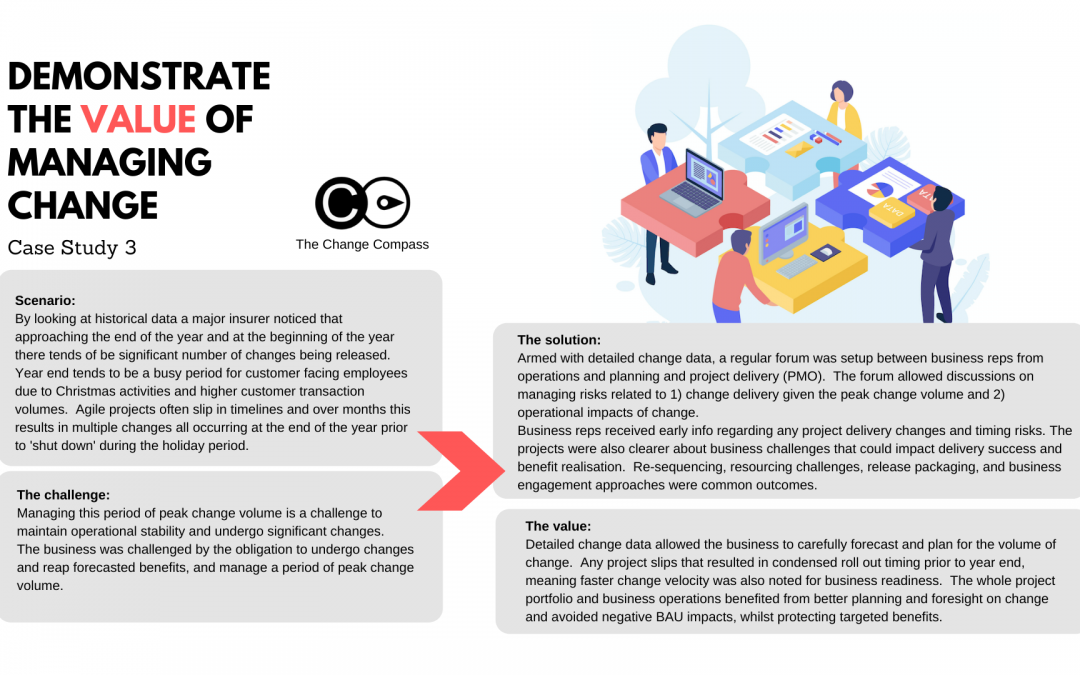
Turning change chaos into competitive advantage: How a leading insurer mastered peak change with The Change Compass
In today’s fast-paced business environment, change is the only constant – especially in highly regulated, customer-facing sectors like insurance. But what if, instead of being a source of risk, organisational change could become your greatest lever for business performance? That’s the journey one major insurer embarked on, and the results are a blueprint for transformation-driven success.
The perfect storm: Why peak change periods are so challenging
Every year, as the calendar ticks towards the December-January holiday season, this insurer encountered a familiar scenario:
Customer-facing employees were under pressure, fielding increased transactions and supporting customers through holidays.
Multiple agile projects, each designed to drive innovation and process improvement, were slipping in timelines – as often happens in complex transformation portfolios.
The result? A flood of change “went live” simultaneously just before the company-wide shutdown.
For business leaders, this created a daunting balancing act: realising the benefits of innovation, while not overwhelming frontline teams or sacrificing operational stability. Missed deadlines or last-minute rollouts could lead to service disruptions, employee burnout, lost revenue, and eroded customer trust.
The breakthrough: Data-powered collaboration
So how did this insurer escape the costly cycle of end-of-year chaos? With The Change Compass, they turned data into their superpower.
The organisation established a regular, cross-functional forum that brought together operations, planning, and project delivery (PMO). But this wasn’t just another meeting – this was a command centre built around live, detailed change data.
Key transformations in approach:
Shared Early Warning System:
Project delays, resource bottlenecks, and clustered change activity were visible weeks or months in advance, not discovered at the last minute.
Intelligent Risk Management:
The team could scenario-plan, not just react, to delivery risks and operational pinch points.
Business-Driven Dialogue:
Operations leaders voiced customer realities and BAU needs, shaping project timelines for true business readiness.
Real-world results: From fire-fighting to future-proofing
Thanks to this new level of insight and collaboration, the insurer fundamentally changed how it managed periods of peak change. Here’s what set them apart:
1. Proactive Forecasting and Portfolio Planning
The company moved from “gut feel” to data-backed change forecasts, mapping exactly when and where change would impact operations.
No more scrambling: resource plans, communications, and business readiness activities were optimised for actual risks and opportunities.
2. Collaborative Course Correction
Instead of viewing project slippage as a crisis, the PMO could re-sequence initiatives, redesign release packages, or reallocate teams before risks materialised.
The forum fostered joint problem-solving – turning silos into a unified change-fighting force.
3. Protecting Business Value
With fewer surprises and less disruption, business units delivered on promised benefits even during high-change windows.
Change velocity was matched by business readiness, preserving customer experience and employee morale – even during intense periods.
Key value metrics achieved
Savings from BAU cost spike of $1+Mil per annum from change peak periods
Protection from productivity dips of 30-45% from change disruptions
Prevention of customer churn of $1+Mil per annum from frontline operations disruptions
Additional 30-50% gain in change benefits realised through well-coordinated portfolio deployment
Why this matters: Making change your strategic weapon
The lesson is clear: Change doesn’t have to feel risky, unpredictable, or exhausting. With The Change Compass:
You gain clarity – see the full picture of what’s changing, when, and how it affects your people and customers.
You empower teams – from PMO to frontline operations, everyone acts with foresight and confidence, not crisis mode.
You realise more value – initiatives deliver lasting outcomes, not headaches or half-finished results.
This is more than a software platform – it’s a new operating model for change-centric businesses.
Going Beyond “Surviving Change” to Leading Your Market
Imagine if your organisation could:
Anticipate and neutralise risks long before they disrupt business
Execute more strategic projects, faster – without burning out staff or diluting customer experience
Align every level of the business around a shared, data-driven roadmap for change
That’s what The Change Compass unlocks. It’s already helping leading insurers and other organisations turn the “messiness” of change into disciplined, high-impact action – and giving them a real edge on competitors still stuck in fire-fighting mode.
Ready to step into change leadership using data?
If you’re tired of peak periods bringing more anxiety than opportunity, it’s time to see what’s possible when you combine collaboration, smart forums, and powerful change analytics.
Try The Change Compass and:
Put yourself in the driver’s seat for every change, no matter how complex.
Rally your teams around a data-powered playbook for business performance.
Experience smoother, smarter transformation—365 days a year.
Don’t just survive the next wave of change – lead it with data-backed confidence, outperform your industry, and empower your teams. The Change Compass is ready to help you turn every challenge into achievement.