Understanding the real distinction between traditional, project-focused change management and the practice of enterprise change management (ECM) opens the door to a structured approach to genuine organisational agility and resilience. While project-based approaches often provide short-term benefits, ECM elevates change to an ongoing strategic capability, ensuring the entire organisation moves in concert rather than as a collection of isolated initiatives.
Rethinking the project lens
Traditionally, change management has surfaced in response to specific projects or change initiatives such as rolling out new technology platforms, redesigning new processes, digital transformation or introducing new products. These efforts share familiar hallmarks:
Project teams focus their energy on preparing the change process for affected employees, ensuring communications are clear, training is tailored, and stakeholder concerns are addressed swiftly. Metrics such as training completion rates or engagement scores offer a sense of progress, and feedback loops close as soon as “go-live” is achieved.
Project-centric change targets only those directly impacted by the initiative.
Coordination and collaboration between projects may be limited or absent.
Yet, this approach can quickly run into problems as the scale and frequency of the pace of change grows. And let’s face it, which sizeable organisation isn’t going through multiple changes at the same time? What appears to be a tightly managed process locally can, at an organisational level, lead to fragmentation, duplicated effort, and staff exhaustion – sometimes described as “change fatigue”. Diverse teams may be asked to adapt to multiple new systems, processes or behaviours in rapid succession, often with little integration or prioritisation.
Making sense of change saturation
Change fatigue is not a product of resistance to ‘doing things differently’ – it’s a predictable response when staff face overlapping initiatives with inadequate support or context. Portfolio-level visibility is rare in project-centric models, so team members may juggle competing demands with limited clarity on which changes matter most.
People become disengaged when the rationale for change is unclear or inconsistent.
Fragmented delivery means lessons learnt in one project aren’t transferred to others.
Resource conflicts emerge, exacerbating the pace and stress of simultaneous transitions.
Such issues underscore why organisations are searching for a more holistic way to approach change. Rather than reactively managing each initiative, ECM creates a deliberate structure for balancing effort, building capability, and driving lasting value in support of organisational strategy.
ECM is not a “set and forget” solution, nor a suite of templates for project managers to file away. It’s a disciplined, repeatable practice, and an approach that blends governance, data, collaboration and technology so that change becomes woven into daily operations. The core aim is for organisational change to transform from a series of disruptions to a united strategic capability aligned with strategic objectives and goals at various levels of the organisation.
Anchoring change in strategy and purpose
ECM starts with a clear connection to strategy. Initiatives are not pursued simply because they fit a project schedule – they are selected, sequenced and resourced to deliver against longer-term organisational goals and values. This strategic alignment requires regular, portfolio-wide reviews and a strong sense of interdependencies.
Change activity is mapped against broader business priorities for successful change management.
Leadership and employee engagement is visible and continuous throughout cycles of change.
Decisions are made with an understanding of cumulative change impact on staff and operations.
Governance and portfolio management
One of the defining features of ECM is the elevation of governance from discrete project steering groups to enterprise-wide oversight. This means all change activity – from small tweaks to major transformations – is managed within a portfolio framework. Coordinated governance offers leaders:
Real-time visibility of all initiatives, reducing risk of overlapping or conflicting changes;
The ability to sequence work to avoid bottlenecks or overload;
Standard tools for collecting outcomes, learning, and scaling success.
This portfolio approach doesn’t stifle innovation or agility – it enables them. With the big (and ‘medium’) picture in hand, leadership can make timely adjustments, redirect resources where needed, and capitalise on synergies between concurrent change efforts.
Consistent methodology and language
To embed ECM, organisations need a consistent approach to how change is defined, planned, and delivered. This includes shared terminology, frameworks, capability building and tools. A common language ensures that teams across functions understand what’s expected and how to measure success.
Shared frameworks reduce confusion and speed up onboarding new projects.
Common metrics allow lessons learnt from one area to influence others.
Continuous capability development ensures capability is refreshed as the organisation evolves (and capability does not just refer to training).
Cultivating organisational capability
ECM demands proactive investment in building change expertise at all levels, including the enterprise level. Unlike traditional approaches centred in specialist teams, ECM diffuses capability throughout the organisation. Everyone – from the executive team to frontline employee change champions – can access the knowledge, resources, and support necessary to champion change in their own environment.
The benefit of this diffusion is that change management doesn’t become a bottleneck or a specialist bottling plant; rather, it becomes part of the organisational DNA, supporting sustainable transitions even as pressure for change intensifies.
Capability-building programs help embed change management skills into routine business operations.
Peer communities foster exchange of techniques, stories and practical tools.
Capability-building programs help embed change into routine business operations.
Integrating change with core functions
Real value arises when change management links arms with other core business functions – risk, finance, HR, operations, technology:
Risk management: Proactive identification and management of people-related and operational risks ensure less disruption and faster remediation.
Human resources: Structured alignment of talent, training and role transitions supports staff through periods of uncertainty.
Finance: Budgets reflect strategic priorities and benefit targets, allowing responsive reallocation as circumstances shift.
Operations: Rollouts are coordinated with and catered to day-to-day workflow, minimising friction and confusion.
This interconnected approach elevates change from a project concern to a constant enabler, strengthening business readiness and agility.
Data, measurement and digital enablement
ECM takes measurement seriously, moving beyond output metrics to focus on outcomes and behaviour. Reporting and analytics track adoption rates, operational impact, readiness levels, and risk hotspots across all initiatives in progress.
Dashboards provide visibility for boards, executive teams and change leaders.
Analytics highlight trends over time, support decision-making, and provide evidence for resource allocation, including data on impact, capacity, readiness and adoption
Stakeholder feedback is collected continuously and drives refinement of practices.
Digital platforms make this easier – centralising data, automating routine assessments, and allowing fast recognition of leading and lagging indicators in change efforts. However, technology is an enabler not a replacement for skilled analysis and strategic judgement.
Continuous improvement and learning loops
ECM embeds cycles of review, adjustment and learning. Change accelerates, but so too does the speed of feedback, reflection, and correction. Leaders and teams benefit from:
Structured periodic reviews such as portfolio level PI planning (program increment planning);
Real-time lessons learned loops;
Identification and scaling of success stories;
Open channels for feedback and honest discussion.
These activities foster resilience, build trust, and demystify the process of change, turning every initiative – successful or otherwise – into an opportunity for deeper organisational learning.
Overcoming obstacles in enterprise change management
Establishing ECM is a long-term commitment and not without its challenges. Common obstacles include:
Leadership inertia or lack of sustained sponsorship;
Underinvestment in resources and capability growth;
Cultural resistance – where staff view working with change data as a burden rather than an opportunity;
Conflicting priorities between business units;
Difficulty standardising reporting or aligning diverse teams.
Overcoming these barriers requires persistent engagement, investment in technology and skills, and a strong focus on communication. Leadership needs to be visible, responsive, and ready to recalibrate as conditions change.
Implementing enterprise change management: A practical roadmap
Organisations seeking to build ECM need a clear game plan. Here’s a practical roadmap synthesised from best practice:
Vision and Alignment Begin with a shared understanding of why ECM matters and the results it is supposed to deliver. Shape the vision in conversation across the business, not from the top down.
Assessment of Current State Map change activity in flight, assess capability gaps, and audit readiness. Involve a range of stakeholders in the diagnosis phase to surface risks and opportunities, including readiness assessments where applicable.
Strategic Planning and Design Create a blueprint for integrated governance, methodology, and reporting lines. Define responsibilities, success measures and timing with input from relevant business units.
Capability-Building Investment Establish ongoing programs for training, coaching, and skill development. Make capability-building an expected part of career pathways and leadership routines.
Technology Selection and Integration Choose digital tools that fit scale, and goals. Integrate with other business systems where it makes sense for seamless reporting.
Delivery and Implementation Roll out ECM frameworks in parallel with major projects and business-as-usual activities. Regularly review progress, and support teams with tailored resources.
Evaluation, Review and Improvement Set up mechanisms for real-time feedback and course correction. Celebrate success, learn from setbacks, and continually update strategies as the business evolves.
Demonstrating the value of ECM requires robust evidence that change capability translates into real organisational outcomes. Key measures include key performance indicators related to adoption rates: How quickly and thoroughly staff take up new behaviours, systems or processes.
Adoption rates: How quickly and thoroughly staff take up new behaviours, systems or processes.
Readiness indices: Staff sense of preparedness and confidence ahead of change launches.
Business impact: Direct and indirect effects of change on performance, service delivery, quality, and customer satisfaction.
Resource allocation and utilisation: Efficiency in people, budget, and technology deployment over time.
Lessons learnt and continuous improvement: Degree of learning captured and applied to future projects.
Using a dashboard approach, organisations can compare progress between regions or functions, surface best practices, and allocate resources based on what works.
Enterprise change in action
ECM comes to life best through real examples. Consider an organisation embarking on major tech transformation. Early stages are plagued with confusion over responsibilities, inconsistent reporting, and pockets of resistance. By shifting to an ECM approach, the organisation sets up a central governance board, standardises its methodology, introduces regular engagement forums, and builds ongoing feedback loops.
The pace of adoption increases as staff gain clarity.
Risks are flagged earlier, allowing for timely intervention.
Costs are controlled through better prioritisation.
Change becomes less disruptive, more predictable, and ultimately more valuable.
In another scenario, a business grapples with multi-site process rollouts. ECM allows for custom pacing, local adaptation with centralised oversight, and regular calibration of resource needs. Staff feel more engaged and less overwhelmed, while leadership gains better transparency over outcomes.
Frequently Asked Questions
Why is ECM worth the investment?
ECM isn’t a luxury – it’s an organising principle for sustainable performance. It helps prevent costly failures and delays, reduces risk, and builds shared capability that fuels growth in an increasingly volatile world.
How does ECM drive transformation success?
By connecting change activity directly to broader strategy, creating clear frameworks and governance, and embedding skills at every level, ECM supports smooth, coordinated transitions – turning vision into reality with measurable benefit.
What analytical tools and technology support ECM?
Dashboards, portfolio level charts, and centralised analytics platforms provide transparency, drive accountability, and highlight the most impactful interventions. These tools work best when paired with regular dialogue and active review. Starting with simple excel sheets may make sense, but in the longer term have significant limitations.
How do organisations diffuse change leadership beyond core teams?
Training programs, peer communities, and open communication mean staff across every function can act as change advocates, spreading best practice without relying on a small group of specialists.
Final reflections
Enterprise change management represents a profound shift away from treating change as a series of one-off events towards establishing enduring, organization-wide capabilities in organizational change management. Through strategic alignment, integrated governance, continuous development, and robust measurement, ECM helps businesses thrive amid complexity and uncertainty, significantly improving the change implementation process.
The journey toward ECM takes sustained commitment, but the benefits – a culture that welcomes new ideas, adapts faster, and builds lasting value – are worth the effort. For those determined to succeed, ECM stands not just as a methodology, but the bedrock of a truly adaptive organisation.
What this also means is that the change and transformation team or practice increases its influence and contribution to the business goals in a direct way. Senior leaders and key stakeholders will see very clearly the value and contribution of the change management team and how it drives forward the business agenda. Gone are the days where change practice is seen as a nice-to-have with little contribution to business objectives.
When navigating the complexities of organizational change, leaders often rely on analogies to communicate the journey and keep their teams motivated. One common analogy used in traditional change management is the “light at the end of the tunnel,” which portrays the change process as a long, dark journey with an illuminating endpoint. We explores why the “light at the end of the tunnel” analogy is inadequate, proposes a more accurate depiction, and provides practical tips for developing a clear vision and crafting a compelling narrative to guide your organization through change.
‘The light at the end of the tunnel’ is often used an analogy when describing the change journey. The tunnel describes the change journey, often dark with potential obstacles along the way. People may not know exactly what the end looks like and at times it may feel frustrating and challenging. Eventually, approaching the end of the journey, people start to see the light at the end of the tunnel. Excitement builds and people get more excited and relieved. The end.
The other key reason why people use this analogy is to stress how important it is to engage employees so that they are clear with what the end of the tunnel looks like. Being clear with what the end state looks like is critical for change agents to sustain momentum and energy to want to keep going along the change journey. The ability to ‘see’ the light at the end of the tunnel in your impacted stakeholders is a key indicator of eventual change success. However, this analogy falls short in capturing the dynamic and multifaceted nature of modern organizational transformations.
In reality, the path to successful change management models, guided by change management theory and supported by change management statistics, is more like a tunnel with intermittent windows of light, reflecting the multiple initiatives and milestones that punctuate the journey during the process of change. By adopting this more nuanced analogy, leaders can better communicate the realities of effective change management, maintain momentum, and foster sustained engagement across the organization.
Misleading Simplicity
The “light at the end of the tunnel” analogy suggests a linear, singular path with a single destination. It implies that the journey is uniformly dark and challenging until the very end, where a sudden and complete transformation occurs. This perspective can be misleading for several reasons:
Oversimplification: Organizational change management is rarely a single, straightforward journey. It involves multiple phases, each with its own challenges and victories, including discrete change projects. The analogy fails to account for the complexity and non-linear nature of most change processes, highlighting the need for a better change model.
Unrealistic Expectations: By implying that the journey is mostly dark and only brightens at the end, this analogy can demoralize teams. It suggests that rewards and progress are only visible at the conclusion, which can lead to fatigue and disengagement.
Neglect of Ongoing Progress: The analogy does not recognize the incremental achievements and intermittent successes that occur throughout the change process. These smaller victories are crucial for maintaining motivation and momentum.
Failing to Reflect Reality
In reality, organizational change involves multiple change management initiatives running concurrently, each aimed at improving the current state, challenges, and successes, including evolving business models necessary for business success. These initiatives create a landscape that is far from uniformly dark; instead, it is punctuated with periods of light – moments of clarity, success, and learning.
When there are multiple initiatives the key then becomes to pain the overall picture of what the end of the tunnel looks like. This is not just what the end state of one initiative looks like. It is what the culmination of all the various changes look like. Sometimes it leads to potential change fatigue with information overload and other times the change management process requires more change efforts. This may lead to employee resistance and lack of trust. It is about articulating super clearly what it means to have reached particular milestones within the various strategies undertaken (of which the various changes are aimed to support). This design process may incorporate design thinking concepts to come up with new ways in executing the change management approach.
A More Accurate Analogy: A Tunnel with Intermittent Windows of Light
Embracing the Multifaceted Nature of Change
A more fitting analogy for the change journey is a tunnel with intermittent windows of light. This analogy acknowledges the complexity and multifaceted nature of change. Here’s why it’s more appropriate:
Multiple Initiatives: Organizations often undertake several change initiatives simultaneously. Each initiative represents a different window of light, providing opportunities for progress and insight along the way.
Intermittent Successes: This analogy highlights the importance of recognizing and celebrating interim successes. These windows of light can rejuvenate the team’s spirit and provide evidence that the change is working.
Continuous Learning: Intermittent light symbolizes moments of learning and adaptation. As the organization progresses, these windows provide valuable feedback, allowing for adjustments and improvements.
Sustained Motivation: By acknowledging periodic achievements, this analogy helps sustain motivation. Teams can look forward to these windows of light, making the journey less daunting and more engaging.
Developing a Clear Picture of the End State
Importance of a Clear Vision
A clear and compelling vision is essential for guiding the organization through change and increases the probability of change success. It provides a sense of direction and purpose, helping teams understand the ultimate goal and their role in achieving the desired future state. Here are practical steps to develop and communicate a clear picture of the end state using a structured approach:
Define the Vision: Articulate a clear, concise, and inspiring vision that encapsulates the desired end state. This vision should align with the organization’s values and strategic objectives.
Involve Stakeholders: Engage key stakeholders in the vision development process. Their input and buy-in are critical for ensuring that the vision is relevant and achievable.
Visualize the Future: Create visual representations of the end state, such as diagrams, infographics, or mock-ups. These tools can help make the vision more tangible and relatable.
Break Down the Vision: Decompose the vision into specific, measurable objectives and milestones. This makes the vision more manageable and provides clear targets for the team to aim for.
Communicate Consistently: Regularly communicate the vision and progress towards it. Use multiple channels and formats to ensure that the message reaches all parts of the organization.
Crafting the Story for Your Audience
Tailoring the Narrative
Crafting a compelling story that resonates with different audiences within the organization is crucial for maintaining engagement and momentum. Here’s how to tailor the narrative effectively:
Understand Your Audience: Different groups within the organization will have different concerns, priorities, and levels of influence. Tailor the narrative to address the specific needs and interests of each audience segment.
Highlight Relevance: Explain how the change will impact each audience group. Highlight the benefits and address potential concerns to demonstrate relevance and importance.
Use Relatable Examples: Use examples and stories that resonate with each audience group. Relatable narratives can make the vision more accessible and credible.
Showcase Interim Wins: Regularly share stories of interim successes and milestones. These stories can serve as proof points that the change is progressing and having a positive impact.
Leverage Champions: Identify and empower change champions within each audience group. These individuals can help amplify the narrative and foster a sense of ownership and commitment.
The story can be, and should be, articulated at different levels of the organisation. Senior leaders have a role to play to illustrate what business will look like and how the organisation will function differently. Departmental managers also have a role to play to spell out how the work of the department will change accordingly. Team leaders also need to play a part in deciphering what the changes will look like and how the work of the team will evolve in the future. The managerial skills required in doing this and to help employee join dots is critical and cannot be neglected.
Keeping the Momentum
Maintaining momentum throughout the change process requires continuous effort and strategic communication, including effective communication strategies. Here are some tips to keep the energy and enthusiasm alive:
Celebrate Milestones: Acknowledge and celebrate interim successes and milestones. This not only boosts morale but also reinforces the perception of progress.
Provide Regular Updates: Keep the organization informed about the progress, challenges, and next steps. Transparency builds trust and keeps the team aligned.
Encourage Feedback: Create channels for feedback and actively seek input from the team. This fosters a sense of involvement and helps identify areas for improvement.
Adapt and Iterate: Be prepared to adapt the approach based on feedback and changing circumstances. Flexibility is key to navigating the complexities of change, and it is crucial to anticipate and address resistance to change throughout the process.
Recognize Effort: Regularly recognize and reward the efforts and contributions of individuals and teams. Appreciation and recognition can significantly enhance motivation and engagement, helping employees step out of their comfort zone.
The “light at the end of the tunnel” analogy, while common, fails to capture the true nature of organizational change. A more accurate depiction is a tunnel with intermittent windows of light, reflecting the multiple initiatives, interim successes, and continuous learning that characterize the change journey. By adopting this more nuanced analogy, leaders can better communicate the realities of change, maintain momentum, and foster sustained engagement across the organization.
To navigate the complexities of change effectively, it is crucial to develop a clear vision of the end state and craft a compelling narrative tailored to different audiences. Regularly celebrating milestones, providing updates, encouraging feedback, and recognizing effort are all essential strategies for maintaining motivation and ensuring the successful implementation of change initiatives. By embracing these practices, organizations can not only survive the journey through the tunnel but thrive and emerge stronger on the other side.
Disruptions are all around us. First, the various disruptions with Covid on all aspects of people’s lives around the globe. Now we have the riots across the US as well as other countries about racial inequality. With these, we have the backdrop of constant significant changes and changes in new technologies that constantly challenge how we run our lives. What next you may ask?
Disruptions to how change management initiatives are managed seem to never cease. You think you’ve been through the worst with Covid impacting the budget expenditure on projects and the implementation timeline thrown up in the air due to lack of business capacity. The racial riots are disrupting normal business operations and it is back to business continuity plans for some organizations. How might we continue to manage our various change initiatives amongst these constant disruptions?
Strategic approaches
In being able to effectively respond to constant business disruptions on initiatives, a set of routines and business processes need to take place prior to the individual disruptions. Developing a strategic plan is essential to achieve the desired results and navigate these challenges.
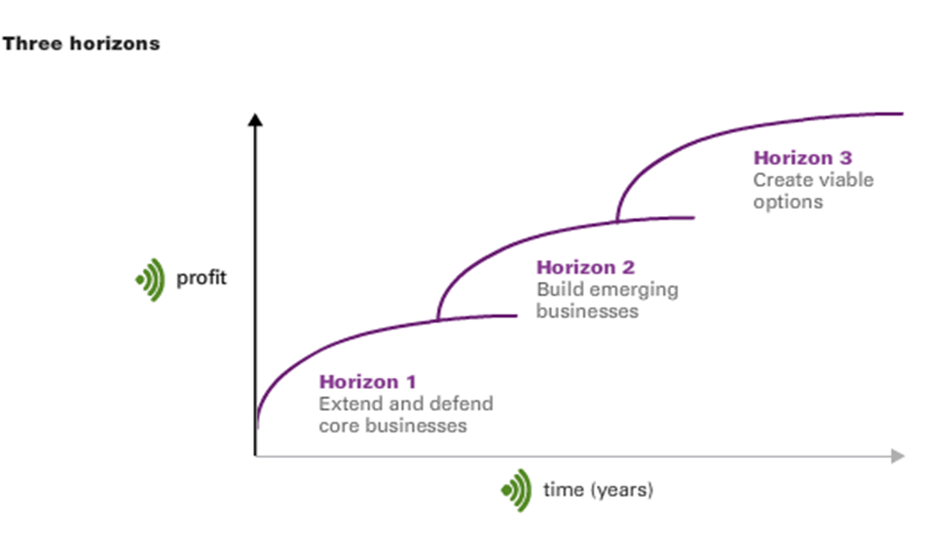
Use the three horizons of growth as a framework to focus efforts on initiatives
McKinsey’s three horizons of growth describe 3 horizons of which initiatives should be clustered. Each horizon forms a critical set of initiatives from which the organisation may continue to develop and grow. If all focus was placed on horizon 1 that are focused on the here and now shorter-term initiatives, then the organisation is not placed to deal with emerging challenges addressed under horizons 2 and 3. Vice versa if all the effort is placed on horizon 3 and not 1.
With business disruptions, the effort and expenditure placed on initiatives can be evaluated in light of which horizon they are in. For example, if the Covid disruption is so significant on the business that it’s a matter of survival, then all efforts should focus on horizon 1 initiatives that contribute to organisational survival in terms of revenue and cost management. If the disruption is significant but not debilitating then it may be wise to spend half of the effort on horizon 1 with the rest on horizons 2 and 3.
Adopt a portfolio approach to manage changes
When initiatives are treated in isolation it is very difficult to flex and adjust to changes compared to a portfolio approach to manage change initiatives. Individual initiatives have limited resource capacity and project activities will have limited impact compared to multiple initiatives.
Having a portfolio approach to manage changes means having established the following:
Data-based approach to manage change impacts with a view of change impacts across initiatives for business leaders.
Ability to visualize and plan the change impacts from a business-unit-centric and stakeholder group centric perspective
Ability to manage resourcing across initiatives so that as required resources may be flexed up or down across the overall portfolio based on prioritisation
Ability to guide and prepare each business for multiple changes across initiatives
Key stakeholder messages may be synchronised and packaged across initiatives versus an initiative by initiative approach
Improved ability to map out clearly the various skills and capabilities being implemented across initiatives to avoid duplication and improve synergies
What can change practitioners contribute in planning for disruptions?
Derive different change scenarios
Scenario planning as a technique is rarely used in a project planning context. However, it is especially critical and relevant within an agile environment. Agile project practices mean that changes keep iterating and therefore it may be hard to anticipate what the end solution or incremental change will look like. It may also be hard to anticipate how the business models and business will respond to the changes being proposed if we don’t know what the changes will look like.
To allow adequate time to plan for changes it is very helpful to derive at least 2 scenarios. In an agile environment, change practitioners need to adopt a hypothesis-based approach to deriving change approaches. Let’s take an example of a standard system implementation project. In rolling out a new system these could be 2 likely scenarios based on the hypothesis being posed.
Hypothesis: The system being implemented is easy and intuitive for users and therefore the change approach will be sufficient with awareness raising and a 1 hour training session
Scenario 1: The hypothesis is true and all users have found it easy and intuitive to use and therefore the change approach proposed is sufficient to prepare the users for this change.
Scenario 2: The hypothesis is only partially true and there are some user groups who struggled to understand all features of the system and need additional help and guidance. Additional training sessions with coaches are proposed
A different way of contrasting different scenarios will be to derive different project expenditures and funding requirements and resulting change delivery work. For example, under the system implementation project, a ‘Toyota’ approach of delivery could involve minimum training and stakeholder awareness generation. For a ‘Rolls Royce’ approach of delivery which will cost significantly more could include tailored coaching sessions for each stakeholder group, 1:1 coaching for senior leaders, a long awareness campaign, and an extensive measurement system. This helps stakeholders understand the cost of delivery and will help them to select an appropriate delivery model.
The usefulness of planning ahead to anticipate for different scenarios mean that steps may be taken to be ready for either of the scenarios and so the project team will not be caught off guard in case the hypothesis proposed is proved false.
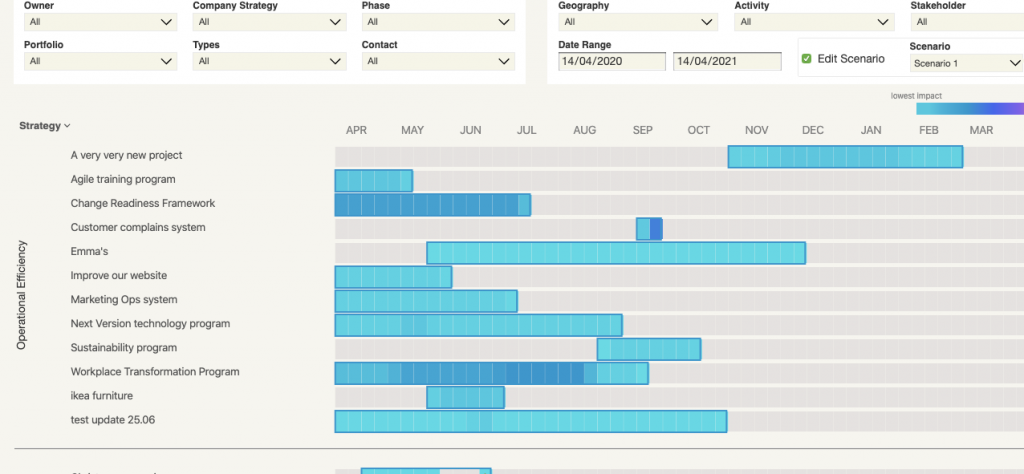
To be able to visualize different scenarios it is important to show the different impacts of the scenarios. This includes the impact of time, sequencing, and impact levels on stakeholder groups. With a different rollout approach will stakeholder groups have better bandwidth and ability to adopt the change or will the bandwidth be more limited?
Here is an example of a scenario planning visual where the user can simply drag the impact bars to different times and be able to save this as a scenario. After saving the scenario the next activity will be to analyse the scenario to make sense of the potential impacts of this scenario on the business and impacted stakeholders. Are there project dependencies that need to be taken into consideration? What is the overall change impact across initiatives as a result of the changes in this scenario? How does this impact the customer versus internal stakeholder groups?
For scenarios to be used in a practical way it is important to be able to list any ‘proof points’ that outline how we can tell that the scenario is becoming true or not. These proof points can include anything ranging from stakeholder reactions, the timing of the implementation, the complexity of the features or solution, cost, and other tangible measurements such as system response time, time taken to perform the process, etc.
Agree on decision making principle with stakeholder
Prior to any disruptions, it is important to agree with stakeholders key decision-making principles. Having clear, agreed decision-making principles means that key decisions can be made without subjecting to personal opinions or preferences. During any times of disruption Decision-making principles can be organised as ‘trade-off’ principles with a prioritised order of importance. Below are some examples:
Cost
Time
People resource bandwidth
Benefit realisation
Stakeholder readiness and acceptance
External media implications
Factor in critical path in project planning
The critical path method is a way in which a project’s key interdependencies are linked and mapped out in a linear way so as to understand the key logical points along the project. From this any potential disruptions, slippages or delays in project deliverables and how they impact the remaining deliverables can be clearly understood and planned for.
A clear understanding of the critical path within a project means that with any disruptions to activities the impacts of this on the rest of the deliverables can easily be articulated. To deal with the disruptions to the project a longer implementation may need to be negotiated with the impacted businesses, or depending on the nature of the disruption, a different project approach with different deliverables may need to be derived.
Here we discussed multiple ways in which the change practitioner can help the organisation get ready for various disruptions to change initiatives. During periods of disruptive change, it is even more critical for change practitioners to demonstrate their value to lead and maneuver around and plan for uncertainty. Agile organisations are well placed to deal with disruptions, however, an effective set of routines, practices, preparations, and capabilities are all critical to building overall organisational readiness.
In today’s fast-paced business environment, most organizations are engaged in numerous change initiatives, including organizational transformation, simultaneously. These initiatives might range from digital transformation efforts to restructuring, new product launches, or cultural shifts. For change management practitioners and leaders, the challenge is not only to ensure each initiative succeeds but also to align these efforts strategically to maximize overall business benefit. Let’s explore practical strategies for aligning multiple initiatives and measuring change adoption, providing actionable insights for change practitioners and leaders.
The Complexity of Multiple Change Initiatives
The complexity of managing multiple change initiatives lies in the potential for overlap, conflicting priorities, and resource strain. Each initiative, while aiming to deliver specific benefits, competes for attention, time, and resources. Moreover, when several initiatives target similar business outcomes, it becomes challenging to attribute success to any single effort. Most business units are only measuring a certain number of business metrics, and with a large number of initiatives there will bound to be overlaps. This makes it essential to adopt a strategic approach that ensures alignment and optimal resource utilisation.
One of the most critical aspects of managing multiple change initiatives is measuring the adoption of each change. This involves not only tracking how well each initiative is being implemented but also creating a clear and detailed plan to understand its impact on the organization. The following strategies can help you effectively measure change adoption across various initiatives:
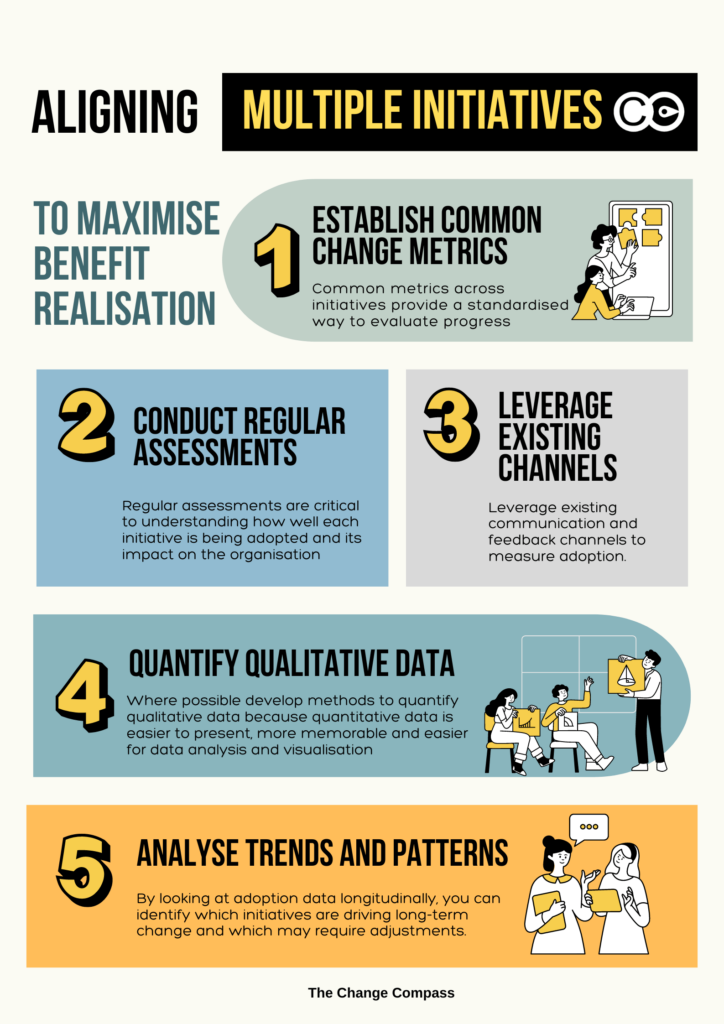
1. Establish Common Metrics
Establishing common metrics across all change initiatives is a foundational step in ensuring that change adoption is measured consistently and effectively. Common metrics provide a standardized way to evaluate progress, compare the success of different initiatives, and gain a holistic view of the organization’s overall change efforts. This approach allows for “apples-to-apples” comparisons, enabling senior leaders to make informed decisions about resource allocation, prioritization, and potential adjustments needed to maximize business benefits.
By identifying and applying a set of core metrics consistently across all change initiatives, organizations can better track the adoption process, identify areas where additional support may be needed, and ultimately ensure that changes are embedded successfully and sustainably.
Here’s a deeper look at some of the common metrics that can be established (note that we take a holistic and strategic lense in ‘adoption’, and not limiting adoption to the end of the project):
Employee Awareness and Understanding of the Change
Employee awareness and understanding are the first critical steps in the change adoption process. Without a clear understanding of what the change entails, why it is happening, and how it will impact their work, employees may experience discomfort and are unlikely to fully embrace the change. Measuring awareness and understanding helps ensure that communication efforts are effective and that employees have the necessary information to begin adopting the change.
Awareness Surveys: Regular surveys can be conducted to assess employees’ awareness of the change initiative. Questions can focus on whether employees are aware of the change, if they understand the reasons behind it, and if they can articulate the expected outcomes.
Knowledge Assessments: Beyond awareness, knowledge assessments can help gauge how well employees understand the details of the change. This could involve quizzes, interactive sessions, or discussions that test their understanding of new processes, tools, or organizational structures.
Communication Effectiveness: Track the effectiveness of communication campaigns through metrics such as email open rates, attendance at town halls or webinars, and engagement with internal communication platforms. High levels of engagement can indicate that employees are receiving and processing the information about the change.
Employee Engagement and Buy-in
Employee engagement and buy-in are essential for successful change adoption. If employees are not engaged or do not buy into the change, they are less likely to put in the effort needed to adopt new behaviours, processes, or tools, which decreases the chances of success. Measuring engagement and buy-in provides insight into how committed employees are to making the change successful.
Engagement Scores: Use engagement surveys to measure overall employee engagement levels before and after the change initiative. These scores can help you understand the impact of the change on employee morale and identify any groups that may need additional support.
Feedback Channels: Monitor and analyse feedback from employees through formal and informal channels. This includes responses to surveys, comments in focus groups, and feedback collected through suggestion boxes or digital platforms. The sentiment expressed in this feedback can be a strong indicator of buy-in.
Participation Rates: Track participation in change-related activities such as training sessions, workshops, and change champion programs. High participation rates typically indicate strong engagement and willingness to adopt the change.
Utilisation of New Systems, Processes, or Tools
The utilisation of new systems, processes, or tools introduced by a change initiative is a direct measure of adoption. If employees are not using the new tools or following the new processes, the change initiative cannot deliver its intended benefits. Measuring utilisation helps ensure that the changes are being practically applied in day-to-day operations.
System Usage Analytics: For technology-driven changes, track the usage of new systems through analytics. Metrics such as login frequency, time spent on the system, and the completion of key tasks can provide a clear picture of adoption.
Process Adherence: Implement tracking mechanisms to monitor adherence to new processes. This could involve audits, self-reporting, or the use of process management tools that track whether employees are following the new workflows.
Tool Adoption Rates: Measure the adoption rates of any new tools introduced as part of the change. This could include tracking the number of users, the frequency of use, and the breadth of functionality being utilised.
Proficiency in Applying the Change
Proficiency in applying the change is a crucial metric because it not only indicates whether employees are using the new systems, processes, or tools, but also how effectively they are using them. This metric helps ensure that employees have the necessary skills and competencies to fully leverage the change and achieve the desired outcomes.
Skill Assessments: Conduct skill assessments to measure employees’ proficiency in using new tools, systems, or processes. This could involve practical exams, simulations, or peer reviews where employees demonstrate their competency.
Performance Metrics: Monitor performance metrics related to the new processes or tools. For example, if a change initiative involves a new sales system, track metrics like sales conversion rates, the accuracy of data entry, or the speed of customer service resolution.
Certification Programs: Implement certification or accreditation programs where employees must demonstrate a certain level of proficiency to earn certification. Tracking the completion rates of these programs can indicate overall proficiency levels.
Realization of Expected Business Benefits
The ultimate goal of any change initiative is to realize clear goals and the expected business benefits, whether they be financial, operational, or strategic. Measuring the realization of these benefits provides a clear indication of the success of the change initiative and its impact on the organization.
Benefit Tracking: Establish specific, measurable business benefits for each change initiative, such as cost savings, revenue growth, improved customer satisfaction, or increased productivity. Each initiative should have clear objectives to track these metrics regularly and assess whether the change is delivering the expected outcomes.
ROI Analysis: Conduct return on investment (ROI) analysis for each initiative, comparing the costs of implementation against the benefits realized. This helps quantify the financial impact of the change and determine its overall value to the organization.
Outcome-Based Metrics: Focus on outcome-based metrics and key performance indicators (KPIs) that align with the organization’s strategic goals. For example, if a change initiative aims to improve customer experience, track customer satisfaction scores, retention rates, and repeat business.
Note that these may not be activities that change practitioners are leading within a project setting, however they should play a key part in contributing to the design and tracking of the adoption which then leads to the ultimate benefits.
Implementing Common Metrics in Practice
Implementing common metrics across multiple change initiatives requires a coordinated effort and a strong governance framework. Here are some practical steps to ensure that these metrics are applied effectively:
Alignment with Strategic Goals: Ensure that the selected metrics align with the organization’s broader strategic goals. This alignment helps prioritize initiatives and ensures that all change efforts contribute to the organization’s overall objectives.
Centralized Data Management: Establish a centralized data management system to collect, store, and analyze metrics across all initiatives. This system should allow for easy comparison and aggregation of data, providing a comprehensive view of change adoption.
Consistent Methodology: Develop a consistent methodology for measuring and reporting metrics. This includes standardized survey questions, data collection tools, and reporting formats to ensure that metrics are comparable across different initiatives.
Continuous Monitoring and Reporting: Regularly monitor and report on the metrics to track progress and identify any areas of concern. Strong leadership is essential in using dashboards and scorecards to provide real-time visibility into change adoption across the organization.
Feedback and Adjustment: Use the insights gained from these metrics to provide feedback to initiative leaders and make necessary adjustments. Continuous improvement is key to ensuring that change initiatives remain on track and deliver the expected benefits.
Implementing metric tracking can be a very manual and labour intensive process. However, there are various digital tools that can be leverage to automate the data capture and streamline the data analysis and insight generation process. Chat to us to find out how The Change Compass can help.
2. Conduct Regular Assessments
Regular assessments are critical to understanding how well each initiative is being adopted and its impact on the organisation. These assessments should be scheduled at key milestones and involve both quantitative and qualitative evaluation.
Pulse Surveys: Conduct pulse surveys at regular intervals to gauge employee sentiment and engagement with each initiative. These short, focused surveys can provide real-time insights into how changes are being received and where additional support may be needed. However do note that pulse survey in themselves may only provide very superficial insights without the depth that may be required to understand the ‘why’ or ‘how’.
Performance Reviews: Where possible integrate change adoption metrics into regular performance reviews. This ensures that the impact of initiatives is continuously monitored and that any issues are addressed promptly.
Change Audits: Periodically perform change audits to assess the effectiveness of each initiative. This involves reviewing processes, outcomes, and feedback to determine whether the change is being adopted as intended.
3. Leverage Existing Channels
Leverage existing communication and feedback channels to measure adoption. This approach ensures that you are not overloading employees with new processes and allows for seamless integration into their daily routines.
Employee Feedback Platforms: Utilise platforms already in place, such as intranet forums like Yammer, suggestion inboxes, or regular team meetings, to gather feedback on change initiatives. This feedback can provide valuable insights into adoption levels and potential areas of resistance.
Usage Analytics: For technology-driven initiatives, use existing analytics tools to monitor system usage and user behaviour. This can help identify adoption rates and areas where additional training or support may be needed.
Regular Check-ins: Integrate adoption tracking into regular team check-ins. This allows managers to discuss progress with their teams and identify any challenges early on.
4. Quantify Qualitative Data
While quantitative metrics are essential, qualitative data provides context and deeper insights into how changes are being adopted. It’s important to develop methods to quantify this qualitative data to better understand the impact of your initiatives. Quantitative data are easier to present, and may be more memorable to your stakeholders.
Sentiment Analysis: Use sentiment analysis tools to analyse employee feedback, comments from surveys, or even social media mentions. This helps quantify the overall sentiment towards each initiative, providing a clearer picture of adoption.
Focus Groups: Conduct focus groups to gather in-depth feedback on specific initiatives. While this data is qualitative, you can quantify it by categorizing responses into themes and measuring the frequency of each theme.
Narrative Metrics: Develop narrative metrics that capture the stories behind the numbers. For example, if an initiative aims to improve customer service, track success stories where employees went above and beyond as a result of the new changes.
5. Analyse Trends and Patterns
Analysing trends and patterns over time is essential for understanding the broader impact of multiple initiatives. By looking at adoption data longitudinally, you can identify which initiatives are driving long-term change and which may require adjustments.
Adoption Trajectories: Track the adoption trajectories of each initiative. Are there certain initiatives that show rapid early adoption but then plateau? Understanding these patterns can help refine strategies to sustain momentum.
Cross-Initiative Analysis: Compare adoption trends across different initiatives. Look for correlations or conflicts between initiatives. For example, if one initiative shows strong adoption while another lags, investigate whether they are competing for the same resources or if there is confusion about priorities.
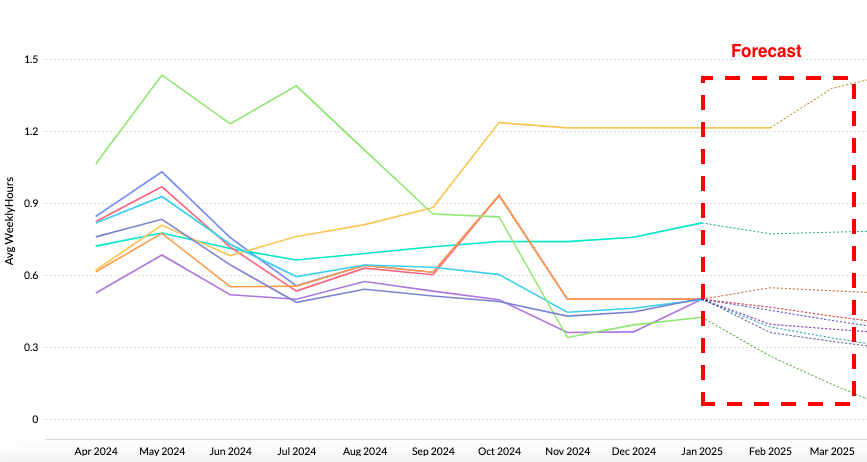
Predictive Analytics: Use predictive analytics to forecast future adoption trends based on historical data. This can help in proactive decision-making and resource allocation. This is absolutely the value of data, when you have historical data you can easily forecast what lies ahead and provide an overlay for change portfolio consideration during business planning cycles.
6. Communicate Progress Transparently
Transparent communication is vital for building trust and ensuring that everyone in the organization is aware of the progress of each initiative. This helps in aligning efforts and maintaining momentum.
Regular Updates: Provide regular updates on the progress of each initiative. Use a variety of channels such as newsletters, town halls, or internal social media to keep everyone informed.
Success Stories: Share success stories that highlight the benefits of adoption. This not only celebrates achievements but also reinforces the value of the initiatives and encourages further adoption.
Dashboard Reporting: Develop a dashboard that tracks and displays adoption metrics for all initiatives in real-time. Make this dashboard accessible to key stakeholders to ensure transparency and accountability.
7. Establish a Governance Framework
A governance framework is essential for coordinating multiple initiatives and ensuring that they are aligned with the organization’s strategic goals. This framework should provide structure, oversight, and guidance for all change efforts.
Steering Committees: Establish steering committees composed of senior leaders who oversee the progress of all initiatives. These committees should ensure that initiatives are aligned with business objectives and that resources are appropriately allocated.
Change Champions: Identify change champions within the organization who can advocate for adoption and provide support to their peers. These individuals play a crucial role in driving change from within and ensuring alignment across initiatives, similar to a strong leadership team.
Standardised Processes: Develop standardized business processes for planning, implementing, and measuring change initiatives. This ensures consistency and allows for more effective comparison and integration of efforts. In establishing the right routines they become embedded within business practices and are not seen as an ‘additional effort required’ on top of their day-jobs.
Aligning Multiple Initiatives for Maximum Business Benefit
While measuring adoption is crucial, aligning multiple initiatives to maximize business benefits is the ultimate goal. Here are key strategies to ensure alignment:
1. Prioritise Initiatives Based on Strategic Value
Not all initiatives are created equal. Prioritising initiatives based on their strategic value ensures that resources are allocated effectively and that the most critical changes receive the attention they deserve.
Value Assessment: Conduct a value assessment for each initiative to determine its potential impact on the organization’s strategic goals. Focus on initiatives that align most closely with these goals.
Resource Allocation: Allocate resources based on the strategic value of each initiative. This may involve dedicating more resources to high-priority initiatives while scaling back on others.
Phased Implementation: Consider implementing high-priority initiatives in phases. This allows you to focus efforts on achieving quick wins, which can build momentum for broader change.
Integration of change initiatives is essential to avoid duplication of efforts and to ensure that all initiatives are working towards common goals. This requires a coordinated approach and effective communication across initiatives and stakeholders.
Change Integration Plan: Develop a change integration plan that outlines how different initiatives will work together. This plan should identify potential overlaps and ensure that all initiatives are aligned. It could be that lower prioritised initiatives be pushed out making the runway for more strategic initiatives with higher priorities. It could also be ‘packaging’ change releases across different initiatives where they make sense to deliver change to the impacted teams in a more cohesive and easier-to-digest manner, similar to a comprehensive change management plan. This may be due to the nature of the changes or the volume and capacity required in the impact of the changes.
Cross-Functional Teams: Establish cross-functional teams to oversee the integration of initiatives. These teams should include team members who are representatives from each initiative to ensure collaboration and alignment. Ideally, cross-functional forums already exist and this is just tapping into an existing channel.
Unified Communication Strategy: Create a unified communication strategy that aligns messaging across initiatives. This helps avoid confusion and ensures that employees receive consistent information. To do this, data is required to be able to have a clear view in terms of communication content and planned releases.
3. Monitor and Adjust in Real-Time
The business environment is dynamic, and change initiatives need to be adaptable. Monitoring progress in real-time and being willing to adjust strategies is crucial for success. At a minimum, set up routine reporting timelines so that data and reporting are harmonised and embedded within the operating rhythms of those involved.
Real-Time Monitoring: Use real-time data to monitor the progress of each initiative within the change process. This allows you to identify issues early and make adjustments as needed.
Agile Approach: Adopt an agile approach to change management, where initiatives are continuously reviewed and adjusted based on feedback and changing circumstances.
Flexibility in Execution: Be prepared to pivot if an initiative is not delivering the expected results or needs to be adjusted based on the challenges of impacted business teams. This might involve reallocating resources, adjusting timelines, or even pausing initiatives that are not aligned with current business needs.
Successfully managing and aligning multiple change initiatives is a complex but achievable task. By establishing common metrics, conducting regular assessments, leveraging existing channels, and quantifying qualitative data, you can effectively measure adoption. Aligning initiatives for maximum business benefit requires prioritisation, integration, and real-time monitoring. For change management practitioners and leaders, these strategies are essential for driving organisational success in a world of increased rate of change. By strategically aligning multiple initiatives, you can ensure that the organisation not only adapts to change but thrives in it.
Though not elaborated, what is inherent in this article is the importance of behaviour in adoption, understanding it, and measuring it. To read more about driving behaviour change check out The Ultimate Guide to Behaviour Change.
Rethinking Change Champions Beyond the Project Lens
For decades, the change champion has been a familiar figure in large-scale transformation projects – the trusted liaison between the change team and the business, responsible for rallying colleagues, answering questions, and providing on-the-ground feedback.
But in most organisations, they are treated as short-term, disposable resources: assembled for a single initiative, tasked with helping during deployment, and then disbanded as soon as the project reaches steady state.
This project-by-project approach misses a critical opportunity.
Increasingly, forward-thinking organisations are moving towards an enterprise change champion model and treating these roles not as temporary assignments, but as a strategic, cross-project capability that sits at the heart of building a more change-resilient workforce.
Why the Traditional Change Champion Model Falls Short
The conventional change champion construct has obvious strengths:
Champions are close to the ground, embedded in business units, and understand local challenges.
They can translate change plans into the everyday realities of their teams.
They give the project team early warning signs about resistance or readiness issues.
However, the limitations are equally apparent:
Short-Term Focus – Once a deployment is complete, project change champions are often released without retaining the capability they’ve built.
Loss of Internal Expertise – Any lessons learned, trust built, and skills acquired fade quickly when champions return to their ‘day jobs’ without a broader mandate.
Fragmentation – Each project recruits, trains, and manages its own champions independently, leading to inconsistent standards and duplicated engagement with the same stakeholders.
Missed Development Opportunities – Some of the most promising leaders remain untapped between projects.
When organisations experience continuous transformation with multiple overlapping initiatives, with varying scopes and impacts, this ad-hoc model leads to change fatigue and diluted influence.
A Step Change: The Enterprise-Wide Change Champion Network
What It Is
Instead of recruiting champions per project, the enterprise model creates a standing network of empowered, skilled employees and first-line managers who are trained, nurtured, and deployed to support any change in any part of the organisation.
They operate at two primary levels:
Employee-level champions – embedded in day-to-day operations, they bring peer credibility and act as the first touchpoint for change comms and readiness checks.
First-line manager champions – supervisory-level influencers who bridge the gap between leadership and frontline teams, actively managing the people side of change.
In addition, division-level representatives coordinate champion activity across their area and connect with the enterprise portfolio of changes. Some may sit in operational planning, HR, or directly in an enterprise change team, depending on organisational structure.
The Case for a Longer Term Champion Network
Change execution is not just about effective rollout – it’s about repeatable, scalable ability to change. The enterprise champion model delivers three key benefits that move the needle:
Sustainable Capability – Skills in influencing without authority, creative engagement, and grassroots communication are retained in the organisation.
Faster Time-to-Adoption – Champions already know the frameworks, templates, and rhythms of engagement, so each new change ramps up quickly.
Talent Pipeline – Champions gain visibility, influencing opportunities, and leadership exposure, making them prime candidates for promotion into leadership, project, or change roles. Many organisations using this model have inadvertently built a ‘leadership incubator’ in the process.
Selecting the Right Champions: Intake Principles
Not every employee is suited to being a champion. The selection criteria are critical to ensuring the network is both high-performing and credible:
Motivation – Champions must see value in playing the role, both intrinsically (desire to help the organisation evolve) and extrinsically (career growth, recognition).
Communication Skills – Ability to translate technical or abstract change messages into plain language for peers.
Coordination and Influence – Capable of corralling colleagues, keeping engagement high, and working across both formal reporting lines and informal networks.
The intake process should feel purposeful. This is not “volunteering” in the casual sense – it’s joining a professional network with enterprise significance.
Beyond Cheerleading: Shaping Change from the Ground Up
Traditional change champions too often become just “posters and cupcakes” – the enthusiastic promoters of a change, but with little voice in how it is planned or measured.
In the enterprise model, champions:
Raise Awareness – in ways that are relevant to their teams and culture, rather than relying on corporate one-size-fits-all messaging.
Sense-Check Readiness – gathering feedback and sentiment before key milestones, providing accurate insight back to project and leadership teams.
Design Local Engagement – creating tailored activities that make the change tangible and exciting.
Co-Own Measurement – participating in tracking adoption and readiness, and linking these to operational performance where relevant.
This measurement element is powerful. If champions see what is changing, when, and how much across the enterprise, they can better pace local adoption and avoid overwhelming their teams.
Now we turn to the how: the design, governance, and development practices that make an enterprise-wide change champion network a strategic business capability — trusted by leaders, respected by peers, and seen as a genuine driver of change adoption and organisational learning.
1. Designing the Enterprise Change Champion Model
A well-performing network of champions doesn’t rely on goodwill alone. It’s a deliberate, resourced capability with defined structure, integration points, and a clear operating rhythm.
a. Network Tiers
The most effective enterprise models feature three interconnected levels:
Local Champions (Employee Level)
Embedded within everyday operations.
Directly influence peers through trust and credibility.
Ensure changes are contextualised for their specific work environment.
First-Line Manager Champions
Serve as change role models for their teams.
Help translate strategic initiatives into operational priorities.
Manage workload balance between BAU and transformation demands.
Divisional / Functional Representatives
Coordinate local champions within their function or geography.
Interface with enterprise-level change, HR, or operational planning teams.
Escalate systemic adoption risks or barriers.
b. Integration with the Enterprise Operating Rhythm
Champions must be integrated into core business cycles, not treated as an “extra thing they do in their spare time”:
Quarterly Business Reviews – Include updates on change readiness and adoption.
Operational Meetings – Reserve time for upcoming change briefings.
Annual Planning – Involve champions in pipeline awareness so they can pace change delivery for their teams.
This ensures the network’s role is embedded, not bolted on.
2. Governance: Balancing Structure with Flexibility
A champion network requires governance to maintain credibility, but too much rigidity can limit creativity and ownership. Senior practitioners should consider:
a. Clear Mandate
Document the network’s remit:
To build and sustain readiness for change across the enterprise.
To surface ground-level issues early.
To contribute to measuring change adoption.
This clarity prevents champions from being used as “free event organisers” rather than strategic enablers.
b. Sponsorship
High-performing networks have active executive sponsorship, ideally within the executive team, ensuring:
Visibility at the top table.
Authority to escalate blockers.
Access to resources.
c. Role Tenure and Rotation
Typical tenure: 18–30 months, with renewal based on performance and availability.
Regular rotation broadens exposure for more employees, refreshes energy in the network, and reduces burnout from continuous change advocacy.
An enterprise network will only be as strong as its learning and development program. Champions need more than “change updates” – they need targeted skill-building.
a. Core Skills Curriculum
Influencing Without Authority – Building informal power and trust networks.
Change Fundamentals – Understanding models, frameworks, and adoption levers.
Storytelling for Change – Shaping narratives that inspire action.
Sentiment Analysis – Gathering and interpreting feedback on readiness and concerns.
Metrics Literacy – Understanding change dashboards and linking people data with performance outcomes.
b. Experiential Development
Shadowing Project Teams – To understand the “engine room” of change delivery.
Rotations Across Divisions – Cross-pollination of experience and approaches.
Facilitating Workshops – Hands-on leadership of engagement activities.
c. Recognition and Career Pathways
If you want the best people to step forward as champions, you need to position it as a career accelerator:
Formal credits in performance reviews.
Priority consideration for emerging leadership or project roles.
Public recognition in forums or internal comms.
4. Linking Champions to Change Metrics: Data as an Engagement Tool
One of the most powerful enablers of an enterprise champion network is visibility of change data– not just for executives, but for the champions themselves.
When champions can see:
The enterprise change portfolio – what’s coming, when, and where.
Impact heatmaps – the degree of change affecting each function.
Adoption trends – progress metrics by region, team, or process.
…they can better inform their local teams, manage change saturation, and proactively address pockets of resistance.
Champion-Led Reporting Loops
Champions provide local sentiment and engagement data back to the change and leadership teams.
This creates two-way measurement, balancing top-down project metrics with authentic ground-level insight.
5. Sustaining Momentum Over Time
Even the most enthusiastic champion cohorts can lose energy without deliberate momentum-building mechanisms. Senior leaders can embed sustainability by:
Regular Cohort Events – Quarterly summits to refresh skills, share success stories, and align on upcoming priorities.
Recognition Rituals – Spotlighting champions who have made significant local impact.
Knowledge Hubs – Digital platforms to share templates, tools, and peer insights.
Graduation Paths – Allowing champions to “graduate” to advanced roles (e.g., mentoring new champions or stepping into change leadership roles).
Proving Impact, Embedding Talent Pipelines, and Cultivating a Change-Agile Culture
Previously we explored the rationale for shifting to an enterprise-wide change champion model and how to design, govern, and develop a high-performing network. Now we close the loop by focusing on how to demonstrate return on investment (ROI), embed the champion network into talent and leadership pipelines, and drive a culture where agility and change readiness are organisational norms.
1. Demonstrating the Strategic Impact and ROI of the Champion Network
Transformation leaders need to show tangible value to maintain investment in the champion model. This requires defining and tracking the right measures across multiple dimensions:
a. Change Adoption Metrics
Speed to Adoption: Time taken for teams to reach defined levels of new process or tool usage.
Adoption Volume: Percentage of the workforce actively using or complying with the change.
Resistance Incidence: Frequency and severity of resistance signals identified via champions.
b. Employee Engagement and Sentiment
Regular pulse surveys co-designed with champions to gauge readiness, concerns, and morale.
Qualitative feedback from champions about barriers and enablers on the ground.
c. Talent Development Outcomes
Promotion and role progression rates of change champions.
Retention of champions compared to peer groups.
Champion participation rates in subsequent change initiatives.
d. Business Performance Linkage
Where possible, correlate change adoption rates with key performance indicators affected by the transformation (e.g., productivity improvement, customer satisfaction, error reduction).
The narrative around these metrics should highlight how the champion network reduces risk, accelerates change, and strengthens leadership pipelines—making it easier to secure ongoing support and resources.
2. Embedding the Champion Network into Talent and Leadership Pipelines
One of the most powerful aspects of an enterprise change champion model is its ability to develop future leaders through hands-on, cross-functional change experience:
a. Career Pathway Integration
Define clear career pathways linking champion roles to leadership, project management, and change leadership positions.
Include champion experience as a valued skill in performance appraisals and promotion criteria.
b. Succession and Rotation Planning
Rotate champions through different business units and change projects to broaden their exposure.
Use the network as a talent pipeline, actively identifying high-potential employees for targeted development.
c. Leadership Sponsorship and Mentorship
Engage senior leaders as sponsors for champions, providing mentorship and visibility on strategic initiatives.
Create mentorship programs pairing seasoned change professionals with champions to accelerate learning.
When treated seriously as a talent development program, the champion network becomes a leadership incubator that benefits the organisation far beyond the immediate change portfolio.
3. Cultivating a Change-Agile Culture through the Champion Model
Beyond skills and metrics, the enterprise champion model shapes an organisation’s cultural DNA by embedding change agility as a norm:
a. Peer Influence and Grassroots Advocacy
Champions serve as trusted peers who normalize change discussions, reducing fear and uncertainty.
Their ongoing active involvement signals to employees that change is continuous and manageable.
b. Building Collective Ownership
Shared responsibility for success is fostered as champions co-own change outcomes with leadership and project teams.
This prevents change being viewed as “something done to us” and instead as “something we drive together.”
c. Transparent Communication and Feedback Loops
Regular updates from champions create a two-way dialogue between employees and leaders.
Transparent sharing of data and progress builds trust and accountability.
d. Resilience and Adaptability
The readiness and skills of champions help the organisation respond dynamically to shifting priorities and emerging challenges.
4. Case Study Insights: Organisations Leading with Enterprise Change Champions
Many organizations have reaped significant benefits from this approach:
A global financial services firm reported a 30% faster adoption rate for technology transformations after establishing an enterprise champion network, alongside measurable improvements in employee engagement during change windows.
A large insurer credits their champion network with preventing change fatigue across multiple simultaneous programs by pacing adoption and tailoring communications locally, thereby maintaining high service continuity.
These examples highlight that a well-designed enterprise champion model is more than a support function. It is a strategic enabler of organisational resilience and talent development.
Closing Thoughts
Building a sustainable enterprise change champion model requires commitment, structure, and investment. But the payoff is clear: an organisation equipped not only to execute change more effectively but to cultivate the next generation of leaders who understand change at a deep level.
By proving impact through metrics, integrating champions into career pathways, and cultivating a culture of collective ownership and agility, senior change and transformation practitioners can transform their organisations into change-ready powerhouses.
If you’re keen on setting up an enterprise change champion group powered by change data insights, reach out and chat to us.