Managing multiple changes is not a new phenomenon for a lot of organisations. However, the value of managing change at a portfolio level is not clear for a lot of leaders. This is a review of academic research on the value of managing multiple change initiatives across an organisation (change portfolio management), with specific focus on the impact of change on people and tangible business benefits. Drawing from peer-reviewed academic sources, this report identifies quantifiable business benefits and performance outcomes associated with effective change portfolio management.
Academic research consistently demonstrates that organisations face significant challenges when implementing multiple change initiatives simultaneously. However, organisations that develop effective change portfolio management capabilities achieve substantially better outcomes, including:
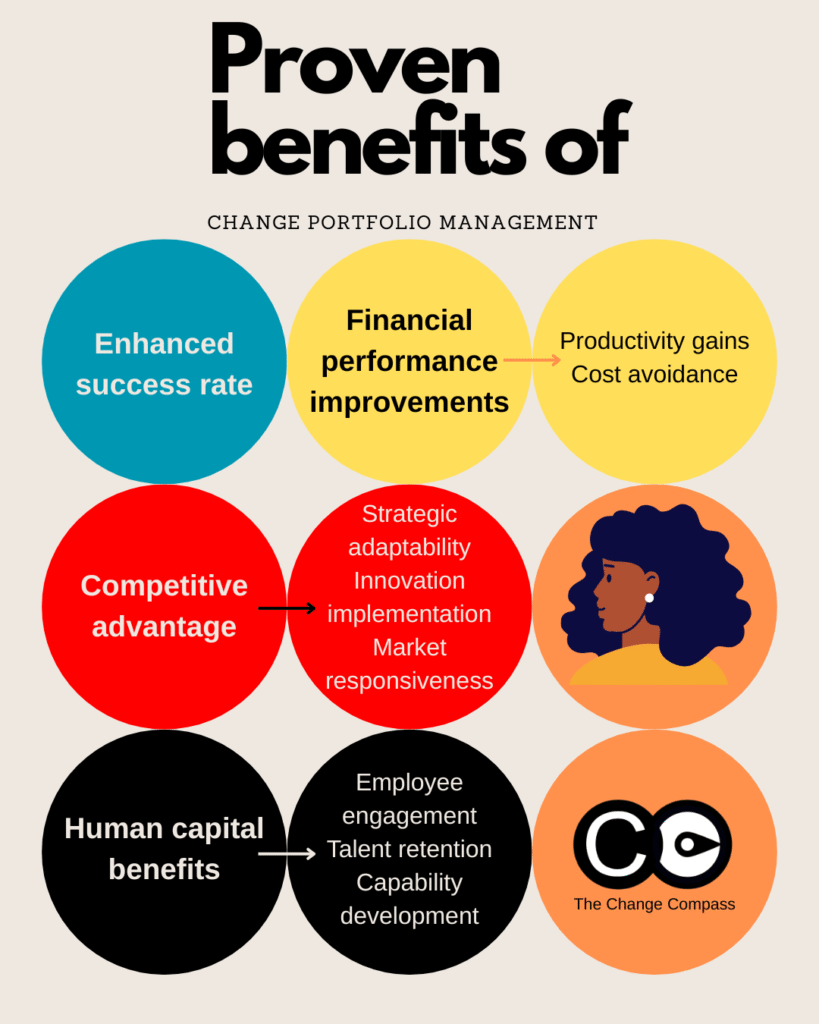
1. Productivity Improvements: Firms with more complex organisational capabilities show “considerably increased firm performance in terms of labour productivity” (Costa et al., 2023).
2. Competitive Advantage: Organisations with better change management capabilities gain strategic advantages over competitors with lower change capacity (Heckmann et al., 2016).
3. Organisational Resilience: Organisations with higher change capacity demonstrate greater resilience during periods of disruption (Mladenova, 2022).
This report synthesizes academic research to provide evidence-based insights on the tangible business benefits of effective change portfolio management.
Background
Organisations today face unprecedented pressure to implement multiple simultaneous changes. Technological disruption, competitive pressures, and evolving customer expectations drive the need for continuous transformation. However, academic research reveals that implementing multiple change initiatives simultaneously creates significant challenges for both individuals and organisations.
Here lies the dilemma. Most organisations are implementing multiple change initiatives. However, nearly all methodologies and change management concepts are only focused on one singular initiative been executed at a time.
Here we examine peer-reviewed academic research on how change portfolio management affects organisational outcomes and quantifies the tangible business benefits of effective change management. It focuses specifically on the value of effectively managing multiple change initiatives across the organisation and identifies measurable business benefits supported by scholarly evidence.
Journals reviewed
This review synthesizes findings from peer-reviewed academic journals including:
– Journal of Business Research
– SAGE Journals
– Industrial and Corporate Change (Oxford Academic)
– Cogent Business & Management
– Administrative Sciences
– Organisational Dynamics
The research focuses on empirical studies that quantify the relationship between change management approaches and business outcomes. Particular attention was given to studies that provide statistical evidence of the impact of change portfolio management on organisational performance.
Change Capacity Limitations: Academic Evidence
The Challenge of Multiple Change Initiatives
Academic research consistently demonstrates that organisations struggle to implement multiple change initiatives simultaneously. Mladenova (2022) found that “multiple and overlapping change initiatives become the norm rather than an exception, thus exert additional pressure on organisations.” Her research identified that when organisations face “increasing levels of unpredictability and need to adapt to fast environmental shifts, linear causal models to plan and implement changes become harder to follow.” However, the bulk of popular change management concepts are linear in nature.
Organisational Capacity for Change
Heckmann et al. (2016) define Organisational Capacity for Change (OCC) as “the capacity of an organisation to institutionalize and manage change on an ongoing basis.” Their empirical research found that “an organisation’s capacity for change associates positively with the performance of its change projects.”
Importantly, the study found that “higher levels of technological turbulence weaken” the relationship between organisational capacity for change and project performance. This suggests that organisations face even greater challenges managing multiple changes during periods of technological disruption.
Adna and Sukoco (2020) studied 313 middle managers and their followers and found that “organisational capacity for change mediates the influence of managerial cognitive capabilities on organisational performance.” Their research demonstrated that organisations need coordinated portfolio approaches to effectively manage multiple changes. Having the right routines also support continuous and multiple changes.
Tangible Business Benefits: Academic Evidence
Success Rate
Academic research provides clear evidence that effective change portfolio management significantly improves success rates:
– Improved Project Performance: Heckmann et al. (2016) found that “an organisation’s capacity for change associates positively with the performance of its change projects” in their empirical study of 134 German firms.
Financial Performance Improvements
Academic research demonstrates measurable financial benefits from effective change portfolio management:
– Productivity Gains: Costa et al. (2023) empirically demonstrated that firms with more complex organisational capabilities showed “considerably increases firm performance in terms of labor productivity.” Their study of Italian firms identified that “Complex” organisations (those with highest organisational capabilities) demonstrated superior productivity metrics compared to firms with less developed capabilities.
– Cost Avoidance: Errida and Lotfi (2021) systematic review of literature identified that failed change initiatives result in both direct costs (resources invested) and indirect costs (lost productivity).
– Resource Utilization Efficiency: Rousseau and ten Have (2022) found that organisations using evidence-based change management practices showed improved change-related decision quality, leading to better use of resources during change implementation.
Competitive Advantage
Academic research identifies clear competitive advantages from effective change portfolio management:
– Strategic Adaptability: Heckmann et al. (2016) established that organisations with better change management capabilities gain strategic advantages over competitors with lower change capacity. Their research demonstrated that organisations with higher change capacity are better positioned to implement future strategic changes.
– Innovation Implementation: Costa et al. (2023) demonstrated that firms with more complex organisational capabilities showed greater ability to innovate and adapt to market changes. Their research found that “higher organisational complexity—captured by the range and variety of actions put in place by firms—is thus reflected in better performance.”
– Market Responsiveness: Mladenova (2022) found that organisations with higher change capacity can better handle “multiple and overlapping change initiatives” which have “become the norm rather than an exception.” The research identified that organisations with higher change capacity demonstrate superior market responsiveness.
Human Capital Benefits
Academic research shows significant human capital benefits from effective change portfolio management:
– Employee Engagement: Mladenova (2022) found that organisations implementing multiple simultaneous changes without adequate change capacity experience diminishing returns partly due to employee disengagement. Organisations with effective change portfolio management maintain higher levels of employee engagement during periods of change.
– Talent Retention: Heckmann et al. (2016) found that organisations with higher change capacity experience lower turnover during periods of change. Their research demonstrated that effective change portfolio management contributes to organisational stability and talent retention.
– Capability Development: Costa et al. (2023) found that organisations with more complex capabilities develop stronger human capital over time. Their research demonstrated that investment in organisational capabilities creates a foundation for future performance improvements.
Organisational Performance Taxonomy
Costa et al. (2023) identified four clusters of firms based on organisational capabilities, providing a framework for understanding the relationship between change capabilities and performance. The following descriptions are inferred from the study and not actual quoted descriptions.
1. Essential (basic capabilities): Organisations with minimal change management capabilities that struggle with implementing multiple changes.
2. Managerial (moderate capabilities): Organisations with some change management capabilities but limited coordination across initiatives.
3. Interdependent (advanced capabilities): Organisations with developed change management capabilities and coordination across initiatives.
4. Complex (highest capabilities): Organisations with capabilities that can effectively implement multiple and complex changes. These tend to have experienced a range of ‘technological-organisational’ changes.
Their research demonstrated that firms in the Complex and Interdependent clusters showed significantly higher performance metrics than those in the Essential and Managerial clusters. This provides a framework for measuring organisational capability development and its impact on performance.
Recommendations from Academic Research
Academic research suggests several evidence-based approaches to improve change portfolio management:
1. Invest in Change Capacity: Heckmann et al. (2016) recommend that “companies should invest in their capacities for change, particularly in the HRM area” to build change capacity. Their research demonstrated that investment in change capacity is a strategic business decision with measurable returns.
2. Develop Integrated Approaches: Errida and Lotfi (2021) found that “the use of a single model or few models is not sufficient to cover various change situations” and that “integrating existing models may lead to an integrated understanding of how to ensure successful organisational change.”
3. Build on Positive Experiences: Heckmann et al. (2016) found that “positive experiences in previous change projects increase OCC (Organisational Capacity for Change).” Their research demonstrated that successful change experiences create a virtuous cycle that builds change capacity over time.
4. Use Evidence-Based Practices: Rousseau and ten Have (2022) found that “planned change is more likely to succeed when using science-informed practices” and that “regular use of four sources of evidence (scientific, organisational, stakeholder, and practitioner experience) improve the quality of change-related decisions.”
Academic Evidence for Change Portfolio Management
The academic research reviewed in this report provides clear evidence that managing multiple change initiatives as a portfolio delivers significant business benefits compared to uncoordinated change approaches.
Organisations that effectively manage their change portfolio can expect:
3. Human Capital Benefits: Improved employee engagement, talent retention, and capability development.
4. Long-term Performance: Greater organisational resilience and sustainable growth.
Whilst there is not a lot of research currently in the newly emerging field of change portfolio management, overall academic evidence strongly supports the value of change portfolio management practices as a strategic approach to organisational transformation.
References
Adna, B. E., & Sukoco, B. M. (2020). Managerial cognitive capabilities, organisational capacity for change, and performance: The moderating effect of social capital. Cogent Business & Management, 7(1). https://doi.org/10.1080/23311975.2020.1843310
Costa, S., De Santis, S., Dosi, G., Monducci, R., Sbardella, A., & Virgillito, M. E. (2023). From organisational capabilities to corporate performances: at the roots of productivity slowdown. Industrial and Corporate Change, 32(6), 1217-1244. https://doi.org/10.1093/icc/dtad030
Errida, A., & Lotfi, B. (2021). The determinants of organisational change management success: Literature review and case study. SAGE Journals. https://doi.org/10.1177/18479790211016273
Heckmann, N., Steger, T., & Dowling, M. (2016). Organisational capacity for change, change experience, and change project performance. Journal of Business Research, 69(2), 777-784. https://doi.org/10.1016/j.jbusres.2015.07.012
Mladenova, I. (2022). Relation between Organisational Capacity for Change and Readiness for Change. Administrative Sciences, 12(4), 135. https://doi.org/10.3390/admsci12040135
Rousseau, D. M., & ten Have, S. (2022). Evidence-based change management. Organisational Dynamics, 51(3). https://doi.org/10.1016/j.orgdyn.2022.100899
Most organisations approach change management assessment the same way: a readiness survey circulated two weeks before go-live, a handful of traffic-light ratings, and a report that arrives too late to influence any decisions. It is a ritual that satisfies governance requirements while doing almost nothing to improve outcomes.
The cost of this gap is significant. McKinsey’s research on organisational transformations found that only 26% of transformations succeed at both improving performance and sustaining those improvements over time. Meanwhile, Prosci’s benchmarking data shows that 88% of projects with excellent change management met or exceeded their objectives, compared to just 13% with poor change management. The difference between these two realities is not effort or intent; it is the quality of assessment that informs strategy before execution begins.
A rigorous change management assessment does more than check a box. It identifies where cumulative change load will overwhelm specific teams, where leadership sponsorship is insufficient, and where the organisation’s capacity for change falls short of what the portfolio demands. This guide presents a practical framework for conducting assessments that actually shape decisions.
Why most change management assessments miss the mark
The fundamental problem with conventional change assessments is scope. Most organisations assess readiness for a single initiative in isolation, asking whether stakeholders are aware of the change and whether training has been scheduled. This approach ignores three critical dimensions that determine whether change will succeed or fail.
Cumulative load across concurrent changes
The average employee now experiences ten planned change programmes a year, according to McKinsey’s latest research, a fivefold increase from a decade ago. Assessing each initiative separately means no one has visibility of the total burden falling on the same teams, the same managers, and the same frontline staff. A team that could comfortably absorb one system migration may collapse under the weight of a simultaneous restructure, a compliance programme, and a new performance management process.
Capacity versus readiness
Readiness asks: “Are people prepared for this specific change?” Capacity asks: “Can this part of the organisation absorb more change right now?” These are fundamentally different questions. An organisation can be perfectly ready for a new CRM rollout, with trained users and enthusiastic sponsors, yet still fail because the same people are simultaneously absorbing three other initiatives that have drained their discretionary effort.
Assessment as decision input, not documentation
Too many assessments produce reports that sit in SharePoint. A well-designed change management assessment should directly influence investment decisions, sequencing choices, and resource allocation. If your assessment does not change any decisions, it is not an assessment; it is a compliance exercise.
Three types of change management assessment
Before building a framework, it helps to distinguish the three assessment types that serve different purposes at different points in the change lifecycle.
Readiness assessment
A readiness assessment evaluates whether a specific group of stakeholders is prepared for a particular change. It typically examines awareness levels, training completion, leadership alignment, and infrastructure readiness. This is the most common type, and it is necessary but insufficient on its own.
Impact assessment
An impact assessment maps the effects of change across the organisation: which teams are affected, what processes will change, what behaviours need to shift, and how significantly. A strong impact assessment looks at degree of change (not just whether a team is “in scope”), timing overlaps, and cumulative load when multiple initiatives converge on the same groups.
Maturity assessment
A maturity assessment evaluates the organisation’s overall change management capability: governance structures, leadership behaviours, measurement practices, and integration with project delivery. This is the most strategic of the three and informs long-term capability building. For a deeper exploration of maturity models, see our guide to change management maturity.
The most effective organisations use all three in combination, applying each at the right moment in the change lifecycle.
A practical five-step change management assessment framework
This framework moves assessment from a one-off checklist to a dynamic capability that continuously informs decisions across the change portfolio.
Step 1: Scope the change portfolio
Before assessing individual initiatives, map the full portfolio of changes in flight or planned for the next 12 months. For each initiative, capture:
Nature of the change (technology, process, structure, culture)
Affected business units, roles, and geographies
Timeline and key milestones
Expected degree of disruption (minor adjustment vs fundamental shift)
This portfolio view is the foundation for everything that follows. Without it, you are assessing puzzle pieces without seeing the picture on the box.
Step 2: Map cumulative impact across stakeholder groups
With the portfolio mapped, overlay all changes onto the stakeholder groups they affect. The goal is to answer one question: which groups face the highest cumulative change load, and when?
Key indicators to track:
Number of concurrent initiatives per team or role
Degree of behavioural change required (not just system changes)
Timing clusters where multiple changes converge
Dependencies between initiatives that create sequencing risks
This step often reveals surprises. A finance team that appears lightly affected by any single project may be drowning under six initiatives that each require modest but simultaneous effort. Moving beyond simple heatmaps to multi-dimensional impact views is critical for this analysis.
Step 3: Assess change capacity versus change load
Capacity assessment examines the organisation’s ability to absorb change at a given point in time. This is distinct from readiness because it accounts for everything happening concurrently, not just the initiative being assessed.
Evaluate capacity across four dimensions:
Leadership bandwidth: Do sponsors have the time and attention to actively support this change alongside their other commitments?
Team absorption capacity: Are affected teams already operating at or beyond capacity due to other changes or operational pressures?
Support infrastructure: Are there enough change practitioners, trainers, and communication resources to support the portfolio?
Cultural resilience: Does the organisation have a track record of successful change, or is there accumulated change fatigue?
Where change load exceeds capacity, the response is not to push harder. It is to sequence, defer, or redesign.
Step 4: Evaluate leadership readiness and sponsor alignment
Prosci’s research consistently identifies active and visible sponsorship as the single greatest contributor to change success. Yet sponsor assessment is often treated as a formality.
A genuine sponsor assessment examines:
Whether the sponsor understands the specific behavioural changes required (not just the project deliverables)
Whether the sponsor has allocated time to visibly champion the change
Whether the sponsor coalition is aligned, with no conflicting messages from peer leaders
Whether sponsors at each level of the hierarchy are prepared to reinforce the change within their teams
If sponsor alignment is weak, no amount of communication or training will compensate. This step should produce a clear, honest evaluation that the project team can act on.
Step 5: Design measurement baselines
An assessment without a baseline is a snapshot that cannot be tracked. For each dimension assessed, establish a measurable starting point against which progress can be measured.
Effective baselines include:
Current awareness and understanding levels (via pulse surveys)
Current adoption rates for similar past changes (as a benchmark)
The value of a change management assessment is entirely determined by what decisions it influences. Assessment data should feed into four decision points:
Sequencing decisions: When cumulative load on a team exceeds capacity, the data should trigger a conversation about deferring, phasing, or redesigning one or more initiatives. This is not a failure of the change team; it is a mature organisational response to resource constraints.
Investment decisions: Assessment data can reveal where additional investment in change support, whether dedicated practitioners, additional training resources, or extended timelines, will yield the highest return. WTW’s 2023 research found that companies taking a proactive, data-driven approach to change management drove nearly three times more revenue than those with below-average change effectiveness.
Design decisions: Impact assessment data can reshape how a change is designed. If the assessment reveals that a particular team faces an unsustainable load in Q3, the project team can redesign the rollout to phase that team’s transition to Q4 instead.
Governance decisions: Mature organisations embed assessment criteria into their project governance frameworks, ensuring no initiative proceeds past a gate review without a validated change management assessment. This transforms assessment from optional to structural.
How digital change analytics accelerate assessment
Portfolio-level assessment across dozens of concurrent initiatives is extraordinarily difficult to manage with spreadsheets and manual surveys. The data is too dynamic, the interdependencies too complex, and the stakeholder landscape too fluid.
Digital change management platforms such as The Change Compass enable organisations to map cumulative impact across the entire change portfolio in real time, visualise capacity constraints before they become crises, and generate the kind of multi-dimensional analysis that manual methods simply cannot achieve at scale. For organisations managing complex, concurrent transformations, this kind of tooling shifts assessment from periodic reporting to continuous, decision-ready intelligence.
For a practical assessment template to get started, contact our team to request a downloadable change management assessment framework tailored to your portfolio.
A change management assessment should be the most influential artefact your change team produces. When done well, it surfaces the risks that no one else is tracking, the cumulative load that no single project team can see, and the capacity constraints that will determine whether the portfolio succeeds or stalls. Stop assessing readiness for individual changes in isolation. Start assessing the organisation’s capacity to absorb the full weight of what is being asked of it. That shift, from initiative-level readiness to portfolio-level capacity, is the difference between assessment as documentation and assessment as strategy.
Frequently asked questions
What is a change management assessment? A change management assessment is a structured evaluation of an organisation’s readiness, capacity, and capability to absorb planned changes. It typically examines stakeholder impact, leadership alignment, cumulative change load, and support infrastructure. The most effective assessments go beyond single-initiative readiness to evaluate the full change portfolio.
How often should you conduct a change management assessment? For organisations managing multiple concurrent changes, assessment should be continuous rather than periodic. At minimum, reassess at each major project gate, quarterly for portfolio-level capacity, and whenever the change portfolio shifts significantly due to new initiatives, deferrals, or scope changes.
What is the difference between a readiness assessment and an impact assessment? A readiness assessment evaluates whether stakeholders are prepared for a specific change (awareness, training, support). An impact assessment maps the effects of change across the organisation, examining which groups are affected, how significantly, and where multiple changes overlap. Readiness tells you if people are prepared; impact tells you what they need to be prepared for.
How do you assess change capacity across an organisation? Change capacity assessment examines leadership bandwidth, team absorption limits, support infrastructure availability, and cultural resilience. The key is to evaluate these dimensions against the cumulative load of all concurrent changes, not just one initiative. Where load exceeds capacity, the appropriate response is to sequence, defer, or redesign.
What metrics should a change management assessment include? Effective assessments measure cumulative change load per stakeholder group, sponsor alignment scores, leadership bandwidth indicators, team capacity utilisation, and baseline awareness and adoption levels. These metrics should be tracked over time against established baselines to show progress and identify emerging risks.
How does change management assessment differ from change management maturity assessment? A change management assessment evaluates readiness and capacity for specific changes or a portfolio of changes. A maturity assessment evaluates the organisation’s overall change management capability, including governance, methodology, leadership behaviours, and measurement practices. Assessment is tactical and ongoing; maturity evaluation is strategic and periodic.
Suggested title: The complete guide to change management assessments in 2026
Suggested meta description: Learn a 5-step change management assessment framework that evaluates portfolio-level capacity, not just readiness. Move from compliance to strategy.
Organisational transformations are essential for staying competitive in today’s fast-paced world, but they often come with challenges that can derail progress. One of the most pressing issues is change overload—when employees and stakeholders are overwhelmed by the sheer volume or pace of changes being implemented. This can lead to burnout, disengagement, resistance, and ultimately, failure to achieve transformation goals.
Artificial intelligence (AI) offers a powerful solution to combat change overload. By leveraging AI tools and strategies, organisations can streamline processes, personalise communication, optimise workflows, and make data-driven decisions that reduce stress and improve adoption rates. This guide provides actionable steps to harness AI effectively in managing large-scale transformations while preventing change fatigue.
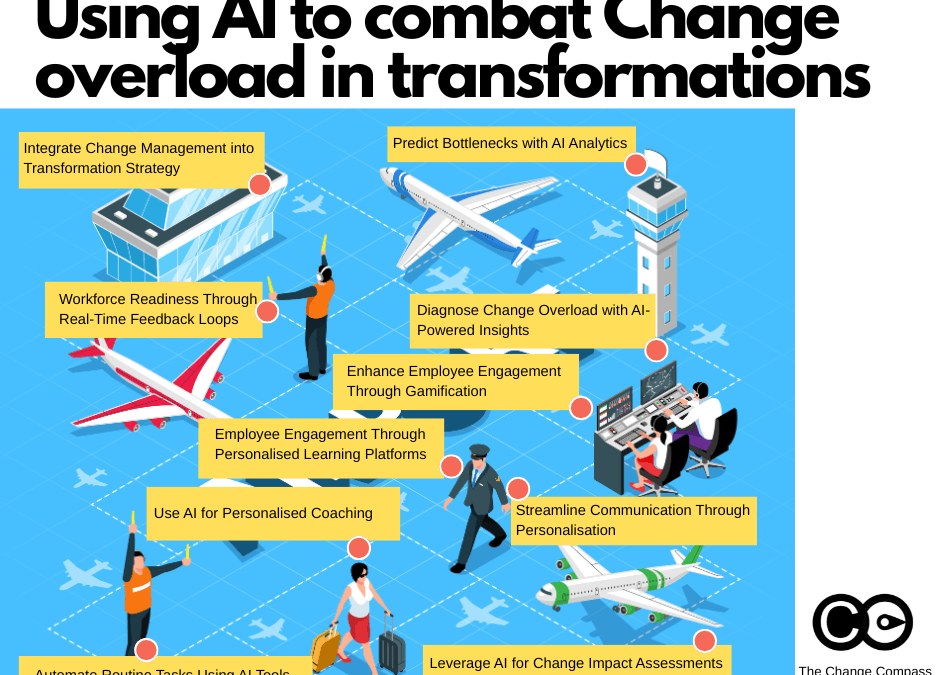
1. Diagnose Change Overload with AI-Powered Insights
Before addressing change overload, you need to identify where it exists and how it impacts your organisation. AI-powered analytics tools can provide real-time data on employee sentiment, workload distribution, and engagement levels—helping you pinpoint areas of concern before they escalate.
How to Apply This:
Use Sentiment Analysis Tools: Platforms like Microsoft Viva Insights or Qualtrics EmployeeXM can analyse employee feedback from surveys, emails, or chat platforms to detect patterns of stress or disengagement. For example:
If sentiment analysis reveals a spike in negative feedback during a specific project phase, it may indicate that employees are overwhelmed by unclear communication or unrealistic deadlines.
Monitor Workload Distribution: Tools such as Workday or Asana’s workload management feature can highlight individuals or teams carrying disproportionate workloads. This allows leaders to redistribute tasks more equitably.
Track Change Saturation Metrics: Use metrics like the number of concurrent projects per team or the average time spent on change-related activities per week may be a start. AI dashboards can automatically calculate these metrics and flag when thresholds are exceeded.
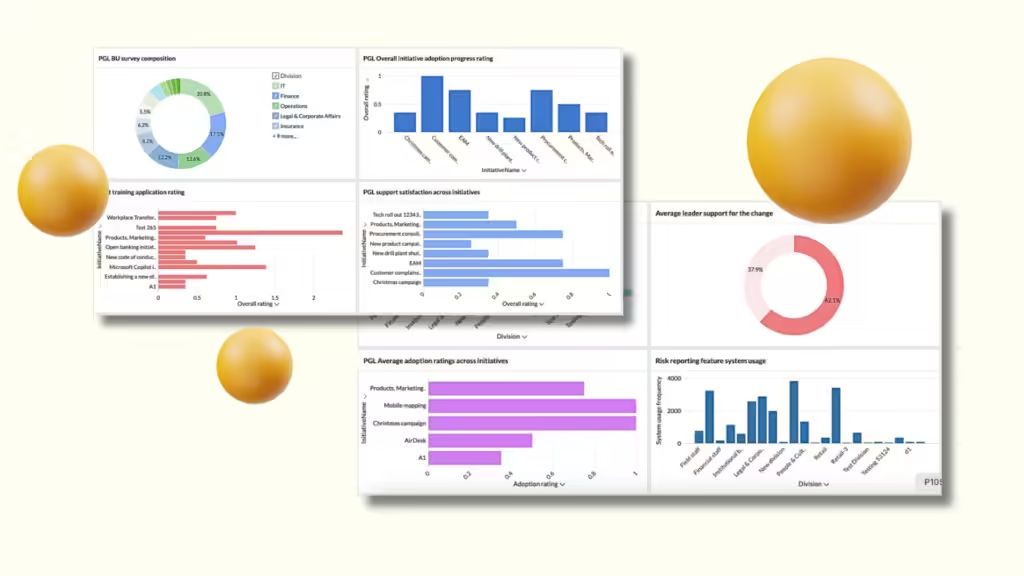
Visualise Change Saturation: Tools such as The Change Compass can help to easily capture change impacts across initiatives and turn these into data visualisation to support decision making. Embedded AI tools help to interpret the data and call out key risk areas and recommendations.
🔍 Example: A retail organisation undergoing digital transformation used AI sentiment analysis to discover that frontline employees felt excluded from decision-making processes. Leaders adjusted their communication approach to involve key frontline change champions which improved morale and reduced resistance.
2. Streamline Communication Through Personalisation
One-size-fits-all communication often adds to change fatigue by overwhelming employees with ineffective or irrelevant information. AI can help tailor messages based on individual roles, preferences, and needs—ensuring that employees only receive what’s most relevant to them.
How to Apply This:
Leverage Natural Language Processing (NLP): Tools like IBM Watson can analyse employee communication styles and suggest tone adjustments for clearer messaging.
Segment Audiences Automatically: Use platforms like Poppulo or Dynamic Signal to categorise employees by role, department, or location and deliver targeted updates accordingly. For instance:
IT teams might receive detailed technical updates about new systems being implemented, while frontline staff get simplified instructions on how the changes will impact their day-to-day tasks.
Automate Feedback Loops: Chatbots powered by AI (e.g., Tidio or Drift) can collect ongoing feedback from employees about the clarity and usefulness of communications during transformation initiatives.
💡 Pro Tip: Combine AI-driven personalisation with human oversight to ensure messages remain empathetic and aligned with organisational culture.
3. Predict Bottlenecks with AI Analytics
One of AI’s greatest strengths is its ability to analyse historical data and predict future outcomes—a capability that’s invaluable for managing change timelines and resource allocation effectively. Predictive analytics can help you anticipate bottlenecks before they occur and adjust your strategy in real time. For example, there could be cyclical periods of the year where the change volume tends to be higher. From our research at The Change Compass, we’ve seen that across different industries, October-November, and February-March tend to be high change volume periods.
How to Apply This:
Forecast Employee Capacity: If you already have the data you can use tools like Tableau or Power BI to predict when teams will be overstretched based on upcoming project timelines and historical workload data. Alternatively, utilise The Change Compass’ forecasting capabilities to predict trends.
Identify High-Risk Areas: Predictive models can flag departments or teams likely to experience resistance based on past behaviours or current engagement levels.
Scenario Planning: Use AI simulations (such as those offered by AnyLogic) to test different implementation strategies for your transformation initiative. The Change Compass also has a scenario planning feature to help you model changes before making the decision.
📊 Example: A financial services firm used predictive analytics during its digital transformation to identify that Q4 was historically the busiest period for its customer service team. By rescheduling non-critical training sessions for later Q1, they reduced employee stress and maintained service quality.
4. Enhance Employee Engagement Through Personalised Learning Platforms
Engaged employees are more likely to embrace change rather than resist it. AI-powered learning platforms offer personalised training pathways that equip employees with the skills they need for new roles or technologies introduced during transformation.
How to Apply This:
Create Adaptive Learning Journeys: Platforms like Degreed or EdCast use AI algorithms to recommend training modules based on an employee’s current skill set and career aspirations.
Gamify Learning Experiences: Incorporate gamification elements such as badges or leaderboards into your training programs using tools like Kahoot! or Quizizz.
Monitor Training Effectiveness: Use analytics within learning management systems (LMS) like Cornerstone OnDemand to track completion rates, quiz scores, and time spent on modules.
🎯 Action Step: Pair training initiatives with clear career progression opportunities tied directly to the transformation goals—for example, offering certifications for mastering new software systems being implemented.
5. Automate Routine Tasks Using AI Tools
Repetitive tasks drain employees’ energy and time—resources that could be better spent on strategic initiatives during transformations. Automation powered by AI can alleviate this burden by handling routine tasks efficiently. This not only reduces workload but also empowers employees to focus on higher-value activities that drive transformation success.
Note that this approach is assuming the organisation has the appetite to leverage AI and automation to reduce workload.
How to Apply This:
Automate Administrative Tasks: Tools like UiPath or Zapier can automate workflows such as data entry, meeting scheduling, or report generation. For example:
Automating the creation of weekly project status reports allows project managers to spend more time addressing risks and engaging with stakeholders.
Streamline Onboarding Processes: Implement chatbots like Leena AI or Talla that guide employees through onboarding steps during organisational changes. These tools can answer FAQs, provide training schedules, and even send reminders for task completion.
Enable Self-Service Options: Deploy virtual assistants (e.g., Google Dialogflow) that allow employees to access FAQs about new policies, systems, or procedures without waiting for human support.
💡 Pro Tip: When automating tasks, ensure transparency with employees about what is being automated and why. This helps build trust and prevents fears about job security.
6. Foster Workforce Readiness Through Real-Time Feedback Loops
Continuous feedback is essential during transformations—it helps leaders course-correct quickly while keeping employees informed and engaged. However, traditional feedback mechanisms like annual surveys are often too slow to capture real-time issues. AI tools enable organisations to collect and analyse feedback at scale in real time, creating a more agile approach to managing change fatigue.
How to Apply This:
Deploy Pulse Surveys: Platforms like Culture Amp or Peakon use AI algorithms to analyse survey responses instantly and provide actionable insights. For example:
If a pulse survey reveals low morale in a specific department, leaders can intervene immediately with targeted support or communication efforts.
Monitor Collaboration Metrics: Tools such as Slack Insights or Microsoft Teams Analytics track engagement levels within collaboration platforms. If metrics show a drop in activity or participation, it could indicate disengagement or confusion about transformation goals.
Close Feedback Loops Quickly: Use automated workflows triggered by feedback results. For instance:
If employees flag a lack of clarity about a new system rollout, an automated workflow can schedule additional training sessions or send out simplified guides.
📌 Key Insight: Real-time feedback not only identifies issues early but also demonstrates that leadership values employee input—a critical factor in building trust during change.
7. Leverage AI for Change Impact Assessments
One of the most overlooked aspects of managing change is understanding its cumulative impact across the organisation. Many organisations fail to consider how multiple simultaneous changes affect employee capacity and morale. AI tools can help conduct comprehensive change impact assessments by analysing data across projects, teams, and timelines.
How to Apply This:
Map Change Dependencies: Use AI-powered tools like The Change Compass to visualise how different initiatives overlap and interact. For example:
If two major IT upgrades are scheduled for the same quarter, the tool can flag potential conflicts and recommend rescheduling one of them as well as locating the right timing.
It could also be a series of smaller initiatives all being executed at the same time, again leading to the risk that key messages may not be absorbed by impacted employees
Analyse Historical Data: Predict how similar changes have impacted the organisation in the past using predictive analytics tools mentioned previously.
Simulate Scenarios: Run simulations to test different implementation strategies (e.g., phased vs big-bang rollouts) and predict their impact on employee workload and engagement.
🔍 Example: A global logistics company used AI-driven impact assessments to identify that rolling out a new CRM system during peak holiday season would overwhelm its sales team. By postponing the rollout until after the busy period, they avoided unnecessary stress and ensured smoother adoption.
8. Enhance Employee Engagement Through Gamification
AI can make transformation initiatives more engaging by incorporating gamification elements into training programs, communication strategies, and performance tracking systems. Gamification taps into employees’ intrinsic motivation by rewarding participation and progress—making change feel less daunting and more rewarding.
How to Apply This:
Gamify Training Programs: Use platforms like Kahoot! or Quizizz to create interactive quizzes and challenges related to new systems or processes being introduced.
Incentivise Participation: Offer digital badges, points, or leaderboards for completing key milestones in transformation initiatives (e.g., attending training sessions or adopting new tools).
Track Progress Automatically: AI-powered LMS platforms like Degreed can track employee progress in real time and provide personalised recommendations for next steps.
🎯 Action Step: Pair gamification efforts with tangible rewards such as gift cards or extra leave days for top performers.
💡 Pro Tip: Ensure gamification efforts are inclusive—design challenges that appeal to all personality types, not just competitive individuals.
9. Use AI for Personalised Coaching
AI-powered coaching platforms are revolutionising how organisations support their employees during transformations. These tools provide personalised guidance tailored to each employee’s role, skills, and career aspirations—helping them navigate change more effectively while feeling supported.
How to Apply This:
Deploy Virtual Coaches: Platforms like BetterUp or CoachHub use AI algorithms to match employees with virtual coaches who provide tailored advice on navigating change.
Provide Role-Specific Guidance: Use AI tools that offer customised recommendations based on an employee’s role within the organisation. For instance:
A sales representative might receive tips on leveraging new CRM features, while a manager gets guidance on leading their team through uncertainty.
Monitor Coaching Effectiveness: Track metrics such as employee satisfaction scores or performance improvements after coaching sessions.
🔍 Example: A tech company implementing agile methodologies used an AI coaching platform to train managers on fostering collaboration within cross-functional teams. The result was a smoother transition with fewer bottlenecks.
10. Integrate Change Management into Your Digital Transformation Strategy
AI should not operate in isolation; it must be embedded into your broader change management framework for maximum impact. This includes aligning AI initiatives with existing change management methodologies.
How to Apply This:
Centralise Data Sources: Use platforms like The Change Compass to consolidate insights from various data sources into a single dashboard, think data sources such as system usage, performance KPIs and employee survey results. It also enables you to capture your change data and deliverables according to your preferred methodology and populate data with generative AI.
Align Metrics Across Teams: Ensure KPIs related to change readiness (e.g., adoption rates) are consistent across departments.
Train Leaders on AI Capabilities: Equip managers with basic knowledge of how AI works so they can champion its use within their teams.
🌟 Final Thought: The integration of AI into change management isn’t just about technology—it’s about creating a culture of adaptability where data-driven decisions empower people at every level of the organisation.
Call-to-Action: Start Your Journey Towards Smarter Change Management
The challenges of large-scale transformations don’t have to result in burnout or disengagement when you harness the power of artificial intelligence effectively. Begin by assessing your current change portfolio environment—what tools are you already using? Where are the gaps? Then explore how AI solutions can fill those gaps while aligning with your organisational goals.
Ready to take the next step? Dive deeper into strategies for agile change portfolio management here and discover how data-driven insights can revolutionise your approach today!
Artificial Intelligence (AI) is no longer a futuristic concept—it is here, transforming industries and reshaping how organisations operate. For change and transformation professionals, AI presents both opportunities and challenges. While it automates repetitive tasks and provides advanced insights, it also demands a shift in mindset, skillsets, and approaches to managing change.
Change and transformation professionals must now navigate a world where AI not only augments their work but also redefines their roles. Here we explore how AI is impacting the field of change management, what parts of the work will shift and evolve, and how change manager can adapt to thrive in this new era.
The Impact of AI on Change Management
AI is revolutionizing change management by automating processes, providing predictive analytics, and enabling personalization at scale. It allows organisations to identify resistance early, tailor interventions for specific stakeholders, and measure the effectiveness of change initiatives in real time. However, these advancements also mean that the traditional ways of working are evolving rapidly.
For change professionals, this transformation requires a deeper understanding of how to integrate AI into their processes while maintaining a human-centered approach. Beyond the usual AI use for pictures and communications, let’s break down the key areas where AI is making an impact:
1. Automation of Repetitive Tasks
One of the most immediate benefits of AI in change management is its ability to automate repetitive and time-consuming tasks. For example:
– Stakeholder Analysis: AI tools can analyse large datasets to identify key stakeholders, map their influence networks, and predict their responses to change.
– Communication: Generative AI can draft personalized emails, newsletters, or FAQs tailored to different stakeholder groups.
– Reporting: Automated dashboards powered by AI can provide real-time updates on adoption rates, engagement levels, and other key metrics.
This automation frees up time for change professionals to focus on higher-value activities such as strategy development and stakeholder engagement.
2. Data-Driven Insights
AI enables access to advanced data analytics that were previously unavailable or too complex to process manually. Predictive analytics tools can forecast employee resistance, identify potential risks, and recommend targeted interventions before problems escalate. For example:
– Sentiment analysis tools can assess employee feedback from surveys or social media platforms to gauge morale and identify concerns.
– Behavioural analytics can track how employees are interacting with new tools or processes, providing insights into adoption patterns.
However, it is worth noting that the more data collected, including historical data, the richer the AI insights will be as it will generate more accurate observations and recommendations.
These insights allow change professionals to move from reactive approaches to proactive strategies based on real-time data.
3. Personalisation at Scale
AI empowers organisations to deliver highly personalised experiences for employees during times of change. Instead of one-size-fits-all approaches, AI tools can segment stakeholders based on their preferences, behaviours, or roles and tailor communication or training accordingly. For instance:
– Adaptive learning platforms can create customised training modules for employees based on their skill gaps.
– Chatbots powered by natural language processing (NLP) can answer individual questions about new systems or processes in real time. With the ease of designing and implementing chatbots nowadays, designing a chatbot for implementing a change initiative is absolutely feasible.
Personalisation improves engagement and reduces resistance by addressing the unique needs of each individual or group.
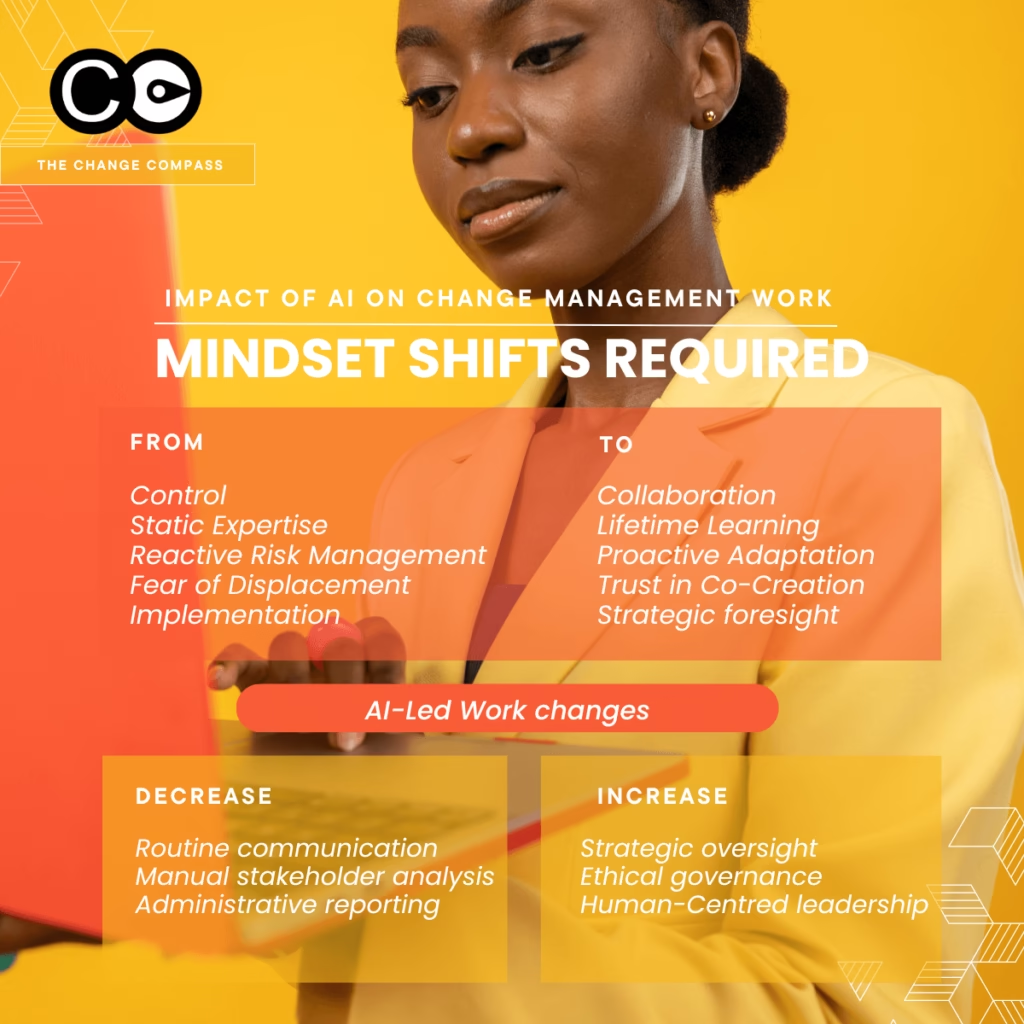
What Will Decrease in the Work of Change manager?
While AI enhances many aspects of change management, it also reduces the need for certain traditional tasks:
1. Routine Communication
AI tools like chatbots or automated email systems can handle routine communication tasks such as sending updates or answering frequently asked questions (FAQs). This reduces the time spent on drafting generic messages or managing basic inquiries.
2. Manual Stakeholder Analysis
In the past, stakeholder analysis often involved manual mapping exercises based on interviews or surveys. With AI-driven tools that analyse organisational networks and sentiment data, this process becomes faster and more accurate.
3. Administrative Reporting
Manual reporting on metrics like adoption rates or training completion will decrease as AI-powered dashboards provide real-time analytics. Change managers will no longer need to spend hours compiling reports; instead, they can focus on interpreting the data and making strategic decisions.
What Will Increase in the Work of Change manager?
While some tasks decrease with AI integration, others become more critical:
1. Strategic Oversight
With AI handling operational tasks, change manager will need to focus more on strategic oversight. This includes ensuring that AI tools align with organisational goals and values while driving meaningful outcomes.
For example:
– Interpreting data insights provided by AI tools to refine strategies. With the range and volume of insights generated, the change professional needs to be focused on what parts add value and where the attention should be placed
– Ensuring that predictive analytics align with broader business objectives. AI generated data will need to be evaluated together with other sources of data. There may be data points that are not captured by AI, thereby impacting the predictive recommendations.
– Balancing short-term efficiency gains with long-term cultural shifts. The use of AI must align with the appetite of the organisation and what the people are capable of adopting. The change professional needs to careful assess the extent of the shifts required and adjust the AI usage and resulting business impacts accordingly. Is the organisation actual ready for the operating model changes inflicted by AI? Work efficiency aside, what will the organisation do with excess people capacity? And will it be ready to implement various business efficiency changes resulting from AI? This is a core question that leaders need to answer.
2. Ethical Governance
As organisations increasingly rely on AI for decision-making, ethical oversight becomes a core responsibility for change manager. Whilst this may not be considered as the ‘core job’ for change managers, it is important to incorporate this as a key part of monitoring of employee feedback and adoption management. They must ensure that:
– AI systems are free from biases that could harm employees or stakeholders. If biases are found, that there is action plans to address these
– Data privacy is maintained while using analytics tools. This will affect which tool is chosen and mode is utilised.
– Transparency is upheld in how decisions are influenced by AI. For example, does the AI recommendation reference data points specifically to support transparent tracing.
Building trust in AI systems among employees will be a critical part of this role.
3. Human-Centered Leadership
Despite its capabilities, AI cannot replace human empathy or emotional intelligence—qualities essential for navigating complex organisational changes. Change manager must:
– Act as empathetic leaders who address fears about job displacement or role changes due to automation.
– Foster trust in both leadership and technology by maintaining open lines of communication.
– Focus on building resilient teams that embrace adaptability and continuous learning.
Mindset Shifts Required for Change manager
To succeed in an AI-driven environment, change manager must adopt new mindsets:
1. From Control to Collaboration: Embrace collaboration with AI as a partner rather than viewing it as a tool to control outcomes.
2. From Static Expertise to Lifelong Learning: Continuously update skills related to data literacy, digital transformation strategies, and emerging technologies.
3. From Reactive Risk Management to Proactive Adaptation: Use predictive insights from AI tools to anticipate challenges rather than reacting after they occur.
4. From Fear of Displacement to Trust in Co-Creation: Recognize that AI enhances human capabilities rather than replacing them entirely.
These mindset shifts will enable change manager to lead effectively in an era where technology plays an increasingly central role in organisational transformation.
Immediate Use Cases for Change managers to Leverage AI
As AI continues to transform the workplace, change managers must adopt practical strategies that integrate AI into their workflows while maintaining a human-centered approach. Below are actionable steps to help change professionals thrive in the AI-driven future.
1. Use AI to Enhance Stakeholder Engagement
AI provides powerful tools to analyze and engage stakeholders more effectively. Change manager can leverage these capabilities to build stronger relationships and drive alignment across the organisation.
Actionable Steps:
– Leverage Sentiment Analysis Tools: Use AI-powered sentiment analysis to gauge stakeholder attitudes and concerns from surveys, emails, or social media. This allows you to identify resistance early and address it proactively.
– Develop Personalized Communication Plans: Use AI tools to segment stakeholders based on their roles, preferences, or behaviours. Tailor communication strategies for each group, ensuring messages resonate with their specific needs.
– Deploy Chatbots for Real-Time Support: Implement AI chatbots to provide stakeholders with instant access to information about change initiatives. This reduces the burden on change teams while improving responsiveness.
Example in Practice:
A global organisation undergoing a digital transformation may use AI sentiment analysis to monitor employee feedback during the rollout of a new system. By identifying teams with low engagement scores, the change team can intervene early with targeted workshops and one-on-one coaching sessions.
2. Integrate Predictive Analytics into Change Planning
Predictive analytics is one of the most transformative aspects of AI for change management. It allows change manager to anticipate challenges, forecast outcomes, and refine strategies based on data-driven insights.
Actionable Steps:
– Identify Potential Resistance Hotspots: Use predictive models to analyse historical data and identify departments or teams likely to resist upcoming changes.
– Forecast Adoption Rates: Leverage analytics tools to predict how quickly employees will adopt new processes or technologies. Adjust timelines and training plans accordingly.
– Optimise Resource Allocation: Use AI insights to determine where resources (e.g., training budgets or change champions) will have the greatest impact.
Example in Practice:
A financial services firm used predictive analytics during a merger to identify which regions were most likely to experience resistance based on past organisational changes. This allowed the team to deploy additional resources in those areas, reducing delays and improving overall adoption rates.
3. Focus on Building Trust in AI
As AI becomes more integrated into organisational processes, trust becomes a critical factor for success. Employees and stakeholders may feel uncertain about how decisions are being made or fear that their roles will be replaced by automation.
Actionable Steps:
– Be Transparent About AI’s Role: Clearly communicate how AI is being used in decision-making processes and emphasize that it is a tool to support—not replace—human judgment.
– Address Ethical Concerns: Ensure that AI systems are free from bias and comply with data privacy regulations. Regularly audit AI tools for fairness and accuracy.
– Foster Open Dialogue: Create forums where employees can ask questions about AI implementations, share concerns, and provide feedback.
Example in Practice:
A healthcare organisation introduced AI-powered scheduling software but faced resistance from staff who feared losing control over their work schedules. By hosting workshops that explained how the system worked and allowing employees to provide input into its configuration, the organisation built trust and improved adoption rates.
4. Lead with Emotional Intelligence
While AI automates many tasks, it cannot replace the human touch required for effective leadership during times of change. Change managers must double down on emotional intelligence (EI) to complement AI’s capabilities. It may not be that employee emotional reactions and nuances are fully captured by AI, so care need to be taken in this regard.
Actionable Steps:
– Empathize with Employee Concerns: Actively listen to employees’ fears about job displacement or role changes caused by automation.
– Foster a Growth Mindset: Encourage teams to see AI as an opportunity for personal and professional development rather than a threat.
Example in Practice:
During an automation initiative at a manufacturing company, senior leaders held town halls where they acknowledged employees’ concerns about job security but emphasized opportunities for upskilling. This approach helped reduce anxiety and fostered a more positive attitude toward the changes.
5. Redefine Training Strategies
AI is transforming how organisations approach employee training during times of change. Traditional one-size-fits-all training programs are being replaced by adaptive learning platforms that deliver personalized content based on individual needs.
Actionable Steps:
– Implement Adaptive Learning Platforms: Use AI-powered tools that assess employees’ existing skills and create customized learning paths.
– Focus on Digital Literacy: Ensure employees understand how to use new AI tools effectively as part of their daily workflows.
– Provide Continuous Learning Opportunities: Move beyond one-time training sessions by offering ongoing development programs that evolve with organisational needs.
Example in Practice:
A retail company introduced an adaptive learning platform during its e-commerce transformation. Employees received tailored training modules based on their roles and skill gaps, resulting in faster adoption of new systems and improved performance metrics.
6. Balance Efficiency with Culture implications
AI brings remarkable efficiency gains, but change managers must ensure that these do not come at the expense of organisational culture. Careful analysis should be done to understand potential impacts of AI on the cultural and behavioural norms of the organisation before proceeding.
Actionable Steps:
– Prioritize Culture Over Speed: While AI can accelerate processes, take time to ensure that cultural alignment is not overlooked during rapid transformations. What behaviours need to be there to support the adoption and implementation and how are these reinforced?
– Balancing cultural norms and behaviours: Are there particular rituals and behaviours that are critical to the culture of the organisation that AI should not try and replace? Are there practices that should remain despite AI gains in efficiency due to cultural goals?
– Measure Success Holistically: Go beyond efficiency metrics by assessing employee engagement, morale, and overall satisfaction during changes.
Example in Practice:
A tech company undergoing rapid scaling used AI tools for project management but ensured that team leaders continued holding regular one-on-one meetings with employees. This balance preserved trust and engagement during a period of significant growth.
The Evolving Role of Change managers
As organisations embrace AI, the role of change manager is shifting from operational execution to strategic leadership. Key areas of focus include:
1. Strategic Visioning: Aligning AI-driven initiatives with long-term organisational goals.
2. Ethical Oversight: Ensuring responsible use of AI while maintaining transparency and trust.
3. Proactive Adaptation: Using predictive insights from AI tools to stay ahead of challenges.
4. Human-Centered Leadership: Balancing technological advancements with empathy and emotional intelligence.
Change manager who embrace these shifts will not only remain relevant but also play a pivotal role in shaping the future of work.
The proliferation of AI is transforming every facet of change management—from automating routine tasks to enabling data-driven decision-making and personalized engagement strategies. For change manager, this evolution presents an opportunity to elevate their roles by focusing on strategic oversight, ethical governance, trust-building, and human-centered leadership.
By adopting practical strategies such as leveraging predictive analytics, redefining training approaches, and leading with emotional intelligence, experienced professionals can harness the power of AI while maintaining a people-first approach. The future of change management lies not in replacing humans with technology but in combining the strengths of both for greater impact. As we move further into this era of transformation, change manager who adapt their mindsets, skillsets, and approaches will be at the forefront of driving successful organisational change—one that balances innovation with humanity.
Air traffic control is one of the most sophisticated and high-stakes management systems in the world. Ensuring the safety of thousands of flights daily requires rigorous coordination, precise timing, and a structured yet adaptable approach. When failures occur, they often result in catastrophic consequences, as seen in the tragic January 2025 midair collision between an army helicopter and a passenger jet in Washington, D.C. airspace.
Think about the last time you took a flight. You probably didn’t worry about how the pilot knew where to go, how to land safely, or how to avoid other planes in the sky. That’s because air traffic control is a well-oiled machine, built on a foundation of real-time data, clear protocols, and experienced professionals making split-second decisions. Now, imagine if air traffic controllers had to work with outdated information, or if pilots had to rely on intuition rather than hard facts. Chaos, right?
The same principles that apply to managing air traffic also hold valuable lessons for change and transformation management within organisations. Large-scale transformations involve multiple initiatives running in parallel, conflicting priorities, and significant risks. Without a structured, centralised approach, organisations risk failure, reduced value realisation, and employee fatigue.
The same logic applies to organisational change and transformation. Leaders are often trying to land multiple initiatives at once, each with its own trajectory, speed, and impact. Without real-time, accurate data, it’s all too easy for change initiatives to collide, stall, or overwhelm employees. Just as the aviation industry depends on continuous data updates to prevent disasters, businesses must embrace data-driven decision-making to ensure their transformation efforts succeed.
Here we’ll explore what air traffic control can teach us about using data effectively in change management. If you’ve ever felt like your organisation’s transformation efforts are flying blind, chaotic and uncoordinated, this one’s for you.
Lesson 1: The Danger of Overloading Critical Roles
The D.C. Midair Collision: A Case of Role Overload
In January 2025, a tragic midair collision occurred in Washington, D.C. airspace between an army helicopter and a passenger jet, claiming 67 lives. Investigations revealed multiple contributing factors, including inadequate pilot training, fatigue, insufficient maintenance, and ignored safety protocols. This incident underscored the dangers of overstretched resources, outdated processes, and poor data visibility—lessons that extend beyond aviation and into how organisations manage complex, high-stakes operations like change and transformation.
Additionally, the air traffic controller on duty was handling both helicopter and airplane traffic simultaneously, leading to a critical lapse in coordination. This split focus contributed to poor coordination and a lack of real-time situational awareness, ultimately leading to disaster. This is aligned with findings from various research that providing adequate resources is important in driving change and transformation.
Parallels in Change and Transformation Management
Organisations often suffer from similar overload issues when managing change. Many initiatives—ranging from business-as-usual (BAU) efforts to large-scale transformations—compete for attention, resources, and stakeholder engagement. Without a structured approach, teams end up working in silos, unaware of competing priorities or overlapping impacts.
There are some who argue that change is the new norm, so employees just need to get on the program and learn to adapt. It may be easy to say this, but successful organisations have learnt how to do this, versus ignoring the issue. After all, managing capacity and resources is a normal part of any effective operations management and strategy execution. Within a change context, the effects are just more pronounced given the timelines and the need to balance both business-as-usual and changes.
Key Takeaways:
Centralised Oversight: Organisations need a structured governance model—whether through a Transformation Office, PMO, or Change Centre of Excellence—to track all initiatives and prevent “collisions.”
Clear Role Definition: Initiative owners and sponsors should have a clear understanding of their responsibilities, engagement processes, and decision-making frameworks.
Avoiding Initiative Overload: Employees experience “change fatigue” when multiple transformations run concurrently without proper coordination. Leaders must balance initiative rollout to ensure sustainable adoption.
Lesson 2: Providing Initiative Owners with Data-Driven Decision Autonomy
The UPS ‘Continuous Descent Arrivals’ System
UPS has been testing a data-driven approach to landings called ‘Continuous Descent Arrivals’ (source: Wall Street Journal article: Managing Air Traffic Control). Instead of relying solely on air traffic controllers to direct landing schedules, pilots have access to a full dashboard of real-time data, allowing them to determine their optimal landing times while still following a structured governance protocol. While CDA is effective during light traffic conditions, implementing it during heavy traffic poses technical challenges. Air traffic controllers must ensure safe separation between aircraft while optimising descent paths.
Applying This to Agile Change Management
In agile organisations, multiple initiatives are constantly iterating, requiring a balance between flexibility and coordination. Rather than centralised bottleneck approvals, initiative owners should be empowered to make informed, autonomous decisions—provided they follow structured governance (and when there is less risk of multiple releases and impacts on the business).
Key Takeaways:
Real-Time Data Sharing: Just as pilots rely on up-to-date flight data, organisations must have a transparent system where initiative owners can see enterprise-wide transformation impacts and adjust accordingly.
Governance Without Bureaucracy: Pre-set governance protocols should allow for self-service decision-making without stifling agility.
Last-Minute Adjustments with Predictability: Agile initiatives should have the flexibility to adjust their release schedules as long as they adhere to predefined impact management processes.
Lesson 3: Resourcing Air Traffic Control for Organisational Change
Lack of Air Traffic Controllers: A Root Cause of the D.C. Accident
The D.C. accident highlighted that understaffing was a critical factor. Insufficient air traffic controllers led to delayed decision-making and unsafe airspace conditions.
The Importance of Resource Allocation in Change and Transformation
Many organisations lack a dedicated team overseeing enterprise-wide change. Instead, initiatives operate independently, often leading to inefficiencies, redundancies, and conflicts. According to McKinsey, companies that effectively prioritise and allocate resources to transformation initiatives can generate 40% more value compared to their peers.
Key Takeaways:
Dedicated Transformation Governance Teams: Whether in the form of a PMO, Transformation Office, or Change Centre of Excellence, a central function should be responsible for initiative alignment.
Prioritisation Frameworks: Not all initiatives should receive equal attention. Organisations must establish structured prioritisation mechanisms based on value, risk, and strategic alignment.
Investment in Change Capacity: Just as air traffic controllers are indispensable to aviation safety, organisations must invest in skilled change professionals to ensure seamless initiative execution.
Lesson 4: Proactive Risk Management to Prevent Initiative Collisions
The Risk of Unchecked Initiative Timelines
Just as midair collisions can occur due to inadequate tracking of aircraft positions, organisational change initiatives can “crash” when timelines and impacts are not actively managed. Without a real-time view of concurrent changes, organisations risk:
Conflicting Business Priorities: Competing transformations may pull resources in different directions, leading to delays and reduced impact.
Change Saturation: Employees struggle to absorb too many changes at once, leading to disengagement and lower adoption.
Operational Disruptions: Poorly sequenced initiatives can create unintended consequences, disrupting critical business functions.
Establishing a Proactive “Air Traffic Control” for Change
Enterprise Change Heatmaps: Organisations should maintain a real-time dashboard of ongoing and upcoming changes to anticipate and mitigate risks.
Stakeholder Impact Assessments: Before launching initiatives, leaders must assess cumulative impacts on employees and customers.
Strategic Sequencing: Similar to how air traffic controllers ensure safe landing schedules, organisations must deliberately pace their change initiatives.
The Role of Data in Change and Transformation: Lessons from Air Traffic Control
You Need a Single Source of Truth—No More Guesswork
Aviation Example: The Power of Integrated Data Systems
In aviation, pilots and controllers don’t work off scattered spreadsheets or conflicting reports. They use a unified system that integrates radar, satellite tracking, and aircraft GPS, providing a single, comprehensive view of air traffic. With this system, pilots and controllers can see exactly where each aircraft is and make informed decisions to keep everyone safe.
Application in Change Management: Why Fragmented Data is a Recipe for Disaster
Now, compare this to how many organisations manage change. Different business units track initiatives in separate spreadsheets, using inconsistent reporting standards. Transformation offices, HR, finance, and IT often operate in silos, each with their own version of the truth. When leaders don’t have a clear, real-time picture of what’s happening across the organisation, it’s like trying to land a plane in thick fog—without instruments.
Key Takeaways:
Create a Centralised Change Management Platform: Just like air traffic control relies on a single system, organisations need a centralised platform where all change initiatives are tracked in real time.
Standardise Data Collection and Reporting: Everyone involved in change initiatives should follow the same data standards to ensure consistency and accuracy.
Increase Visibility Across Business Units: Leaders need an enterprise-wide view of all change efforts to avoid conflicts and align priorities.
Real-Time Data Enables Agile, Confident Decision-Making
UPS has a fascinating system for managing landings, known as ‘Continuous Descent Arrivals.’ Instead of waiting for air traffic controllers to dictate their landing time, pilots receive real-time data about their approach, runway conditions, and surrounding traffic. This allows them to determine the best landing time themselves—within a structured framework. The result? More efficient landings, less fuel waste, and greater overall safety.
Application in Change Management: The Danger of Outdated Reports
Too often, business leaders make transformation decisions based on data that’s weeks—or even months—old. By the time they realise a problem, the initiative has already veered off course. When leaders lack real-time data, they either act too late or overcorrect, causing further disruptions.
Key Takeaways:
Use Live Dashboards for Initiative Management: Just as pilots rely on real-time flight data, change leaders should have constantly updated dashboards showing initiative progress, risks, and dependencies.
Empower Initiative Owners with Data-Driven Autonomy: When given up-to-date information, initiative owners can make faster, smarter adjustments—without waiting for top-down approvals.
Leverage Predictive Analytics to Anticipate Challenges: AI-driven insights can flag potential risks, such as change saturation or conflicting priorities, before they become full-blown issues.
Modern aircraft are equipped with automatic dependent surveillance-broadcast (ADS-B) systems, which allow them to communicate real-time flight data with each other. If two planes are on a collision course, these systems warn pilots, giving them time to adjust. It’s a proactive approach to risk management—problems are detected and resolved before they escalate.
Application in Change Management: Avoiding Crashes Between Initiatives
In organisations, multiple change initiatives often roll out simultaneously, each demanding employee attention, resources, and operational bandwidth. Without real-time risk monitoring, it’s easy to overwhelm employees or create operational bottlenecks. Many organisations don’t realise there’s an issue until productivity starts dropping or employees push back against the sheer volume of change.
Key Takeaways:
Invest in Impact Assessment Tools: Before launching an initiative, leaders should evaluate its potential impact on employees and the business.
Run Scenario Planning Exercises: Like pilots in flight simulators, organisations should model different change scenarios to prepare for potential challenges.
Set Up Early Warning Systems: AI-driven analytics can detect overlapping initiatives, allowing leaders to intervene before issues arise.
The High Cost of Inaccurate or Delayed Data
Aviation Example: The D.C. Midair Collision
The tragic January 2025 midair collision in Washington, D.C. was, in part, the result of outdated and incomplete data. A single air traffic controller was responsible for both helicopter and airplane traffic, leading to a dangerous lapse in coordination. Miscommunication about airspace restrictions only made matters worse, resulting in an avoidable catastrophe.
Poor Data Leads to Costly Mistakes
The corporate equivalent of this is when transformation teams work with old or incomplete data. Decisions based on last quarter’s reports can lead to wasted resources, poorly sequenced initiatives, and employee burnout. The consequences might not be as immediately tragic as an aviation disaster, but the financial, momentum and cultural costs can be devastating.
Key Takeaways:
Prioritise Frequent Data Updates: Change leaders must ensure initiative data is refreshed regularly to reflect real-time realities.
Collaborate Across Functions to Maintain Accuracy: Transformation leaders, HR, finance, and IT should work together to ensure all change impact data is reliable.
Automate Reporting Where Possible: AI and automation can reduce human error and provide real-time insights without manual effort.
Balancing Automation with Human Judgment
Aviation Example: Autopilot vs. Pilot Oversight
While modern planes rely heavily on autopilot, pilots are still in control. They use automation as a support system, but ultimately, human judgment is the final safeguard. It’s the perfect balance—automation enhances efficiency, while human oversight ensures safety.
Some leaders may find the process of collecting and analyzing data cumbersome, time-consuming, and even unnecessary—especially when they’re focused on quick execution. Gathering accurate, real-time data requires investment in tools, training, and disciplined processes, which can feel like an administrative burden rather than a value driver.
However, the benefits far outweigh the effort. A well-structured data system provides clarity on initiative progress, prevents conflicting priorities, enhances decision-making, and ensures resources are allocated effectively. Without it, organisations risk initiative overload, employee burnout, wasted budgets, and ultimately, failed transformations. Just like in aviation, where poor data can lead to fatal accidents, a lack of real-time insights in change management can result in costly missteps that derail business success.
Moreover, having an integrated process whereby data regularly feeds into decision making, as a normal business-as-usual process, builds the overall capability of the organisation to be a lot more agile and be able to change with confidence.
Navigating Change with Data-Driven Precision
Aviation has shown us what happens when decision-makers lack real-time, accurate data—mistakes happen, and consequences can be severe. In organisational change, the same principles apply. By embracing real-time data, predictive analytics, and structured governance, companies can navigate change more effectively, preventing initiative overload, reducing resistance, and maximising impact.
Ultimately, the goal is simple: Ensure your change initiatives don’t crash and burn. And just like in aviation, data is the key to a smooth landing.
If you would like to chat more about how to utilise a digital/AI solution that will equip you will insightful data to make critical business decisions in your air traffic control of your changes, reach out to us here.