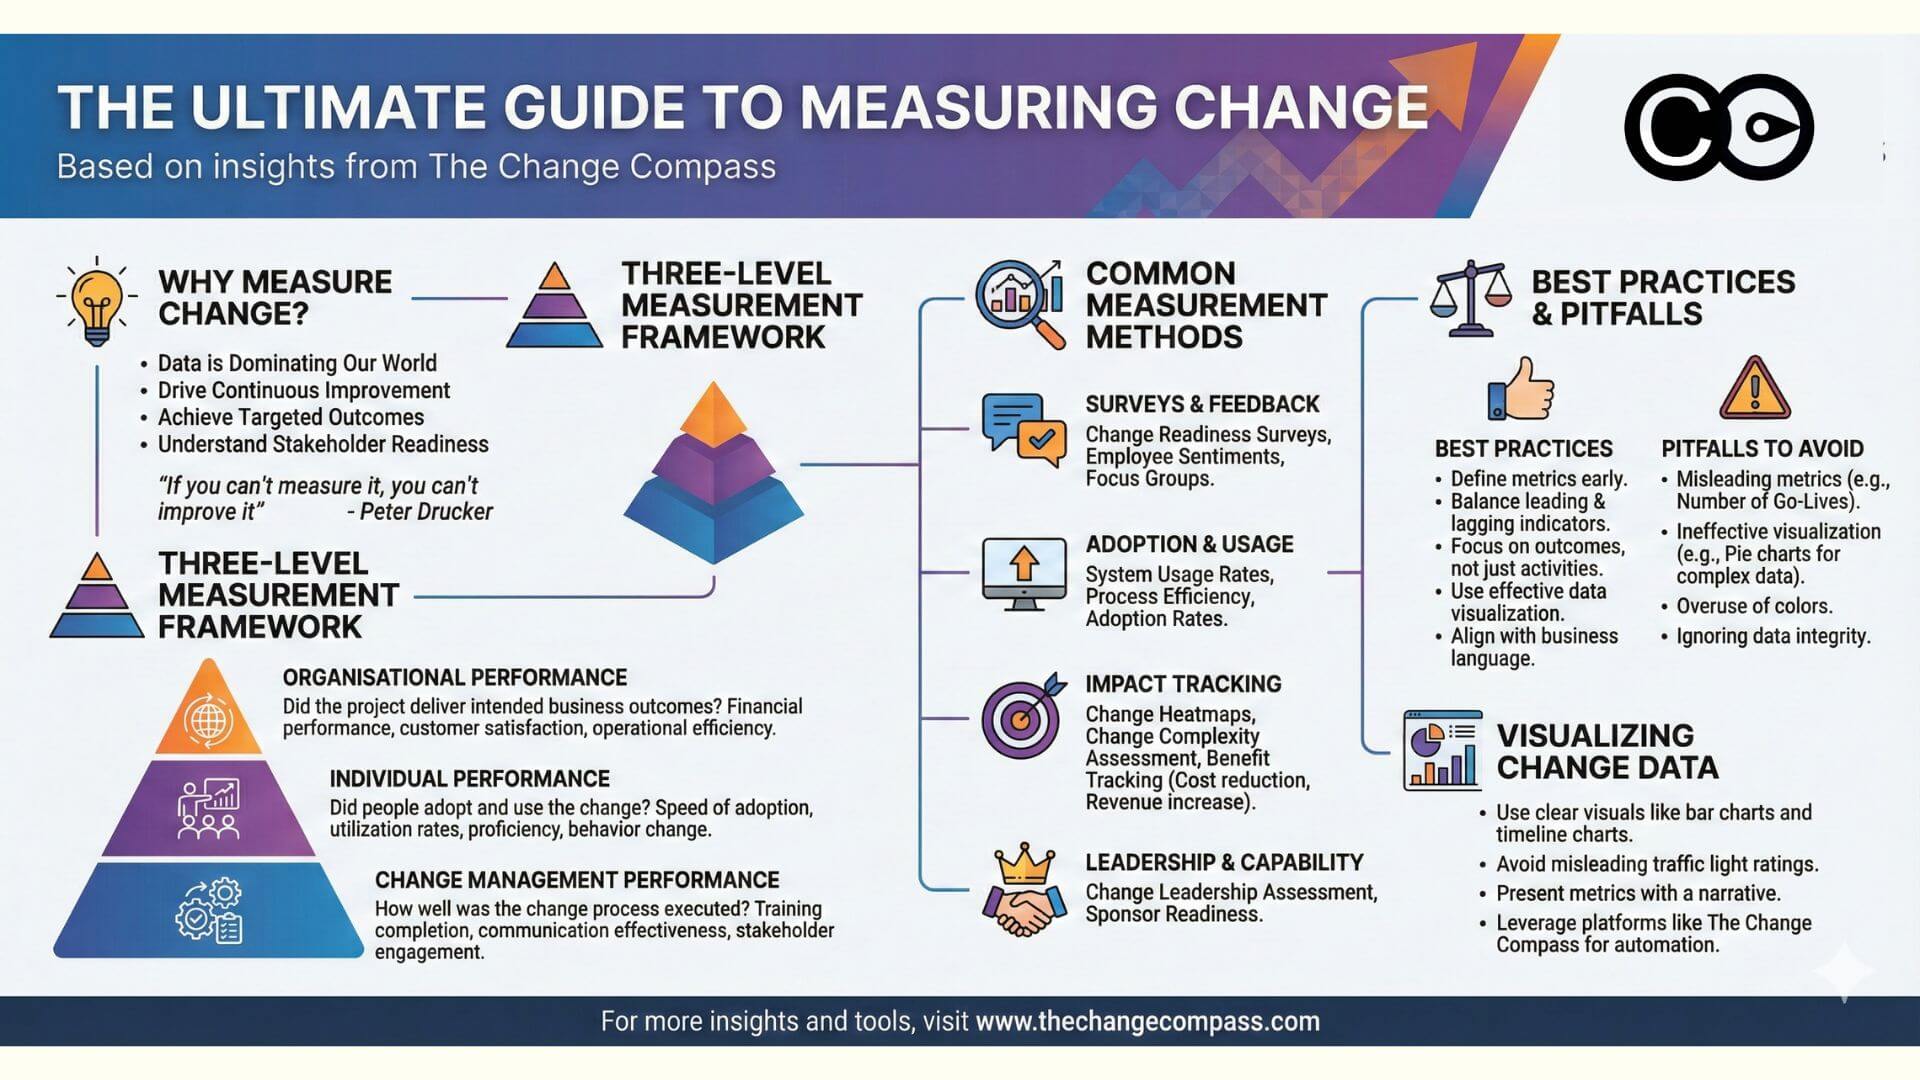
Change measurement translates organisational impact into quantifiable data through surveys, analytics dashboards, and AI-powered tools. Organisations that measure change readiness and adoption rates are 78% more likely to meet project objectives. This guide covers six project-level methods, seven business-level measures, and three enterprise-level frameworks across the Plan-Execute-Realise lifecycle.
A lot of change practitioners are extremely comfortable with saying that change management is about attitudes, behaviours, and feelings and therefore we cannot measure them. This metaphor that change management is ‘soft’ extends into areas such as leadership and employee engagement whereby it may not be easy to measure and track things. However, is it really that because something is harder to measure and less black and white that there is less merit in measuring these?
“If you can’t measure it you can’t improve it” Peter Drucker
The ‘why’ behind a lot of industry change in our day and age comes from the fact that data is now dominating our world. Data is a central part of everything that is changing in our world. Since we are now more reliant on the internet for information, the data that can be collected through our digital interactions around our lives are now driving change. Home assistant Alexa from Amazon can recognize our voices and tell us what we want to know. We can be identified through street cameras. Our Google usage leads to better-targeted advertisements and product promotions. Our Facebook usage leads to a deep understanding of our preferences and lifestyles, and therefore we become targetted by advertisements for what we may find value in (according to Facebook data and algorithms).
So if our world is surrounded by data, why are we not measuring it in managing change? To answer this question let’s look at what we are or are not measuring.
These are some of the common ways in which change is often measured in projects:
Project methods intro
1. Change readiness surveys – What do readiness surveys actually measure?
Change readiness surveys are 5-10 question pulse assessments (Likert + open text) sent via SurveyMonkey/Microsoft Forms at pre-launch, mid-execution, and post-launch. They benchmark stakeholder preparedness, with 92% accuracy when combined with behavioural observations. Top organisations survey quarterly.
Change readiness surveys are usually online surveys sent by a project owner to understand how stakeholder groups are feeling about the change at different points in time throughout the project. It can be in the form on a Likert scale or free text. Most results are summarized into a quantitative scale of the degree in which the group is ready for change. A simple SurveyMonkey could be set up to measure stakeholder readiness for change. ChangeTracking (now part of Accenture) is a comprehensive online tool that measures the change journey and readiness of stakeholder groups throughout the initiative.
2. Training evaluation surveys – How do you prove training ROI?
These evaluations are normally based on participant satisfaction across various categories such as content, instructor effectiveness, usefulness, etc. In a face-to-face training format, these surveys are normally paper-based so as to increase the completion rate. For online or virtual training, ratings may be completed by the user at the conclusion or after the session.
3. Communications metrics – Which comms metrics matter most?
One way in which communications may be measured is the ‘hit rate’ or the number of users/audience that views the article/material/page. This may be easily tracked using Google Analytics that not only tracks number of views per page but also viewership by the time of day/week as well as audience demographic information as such gender and geographical locations.
4. Employee sentiments/culture surveys – What reveals change resistance early?
There are some organizations that measure employee sentiments or culture over the year and often there are questions that are linked to change. These surveys tend to be short and based on a Likert scale with less open-ended questions for qualitative feedback. Since these surveys are often sent across the entire organization they are a ‘catch-all’ yardstick and may not be specific to particular initiatives.
5. Change heatmaps – When do heatmaps fail (and what works better)?
Some organizations devise change heatmaps on excel spreadsheets to try and map out the extent to which different business units are impacted by change. This artifact speaks to the amount of change and often leads to discussions concerning the capacity that the business has to ‘handle/digest’ change. The problem with most heatmaps is that they are usually categorized and rated by the creator of the artifact (or a limited number of people making judgments), and therefore subject to bias. Data that is based on 1 person’s opinions also tend not to have as much weight in a decision-making forum.
6. Change benefit tracking – How do you track post-launch ROI?
In addition to typical change management measures, there are various initiatives-specific measures that focus on the actual outcome and benefit of the change with the goal of determining to what extent the change has taken place. Some example of this includes:
System usage rates
Cost reduction
Revenue increase
Transaction speed
Process efficiency
Speed of decision making
Customer satisfaction rate
Employee productivity rate
Incidents of process violation
Non-initiative based change management measures
There are two other measures that are used within an organizational vs. initiative-specific context, change leadership assessment and change maturity assessment. In the next section, we will discuss these two areas.
Change leadership assessment
David Miller from Changefirst wrote about 3 types of change leaders.:
1. The sponsor whose role is to drive the initiative to success from the beginning to the end. This involves possessing competencies in rallying and motivating people, building a strong network of sponsors and communicating clearly to various stakeholder groups.
2. The influencer whose role is to leverage their network and influence to market and garner the traction required to make the initiative successful. Four types of influencers as identified by Changefirst includes:
a) Advocates who are great at promoting and advocating the benefits of the change
b) Connectors who are able to link and leverage people across a part of the organization to support the change
c) Controllers who have control over access to information and people and these could include administrators and operations staff
d) Experts who are viewed by others in the organization as being technically credible
3. The change agent is someone who is tasked with supporting the overall change in various ways, including any promotional activities, gaging different parts of the organization on the change and be able to influence, up, down and sideways across the organization to drive a successful change outcome.
Whilst there isn’t one industry standard tool for assessing change leadership competencies and capabilities. There are various change leadership assessment tools offered by Changefirst as well as other various smaller consulting firms. One of the most comprehensive change leadership assessment tools is by ChangeTracking is the Change Capacity Assessment which is a self-assessment with the broad categories being Goal Attainment, Flexibility, Decision Making, and Relationship Building.
Some of the key competencies critical in change leadership have been called out by Pagon & Banutal (2008), and include:
Goal attainment
Assessing organizational culture and climate
Change implementation
Motivating and influencing others
Adaptability
Stakeholder management
Collaboration
Build organizational capacity and capability for change
Maneuvering around organizational politics
Change maturity assessment
Organisations are increasingly realising that managing change initiative by initiative is no longer going to cut it as it does not enable organizational learning and growth. Initiatives come and go and those who rely on contractor change managers often find that their ability to manage change as an organization does not mature much across initiatives.
Change maturity assessment is focused on building change capability across the organization across different dimensions, whether it be project change management or change leadership. The goal of conducting a change maturity assessment is to identify areas in which there may be a capability gap and therefore enable structured planning to close this gap.
There are 2 major change maturity assessment models available in the market. The first is by Prosci and the second is by the Change Management Institute. To read more about change maturity assessment read out article A New Guide for Improving Change Management Maturity, where we outline how to improve change maturity throughout different business units across the organization.
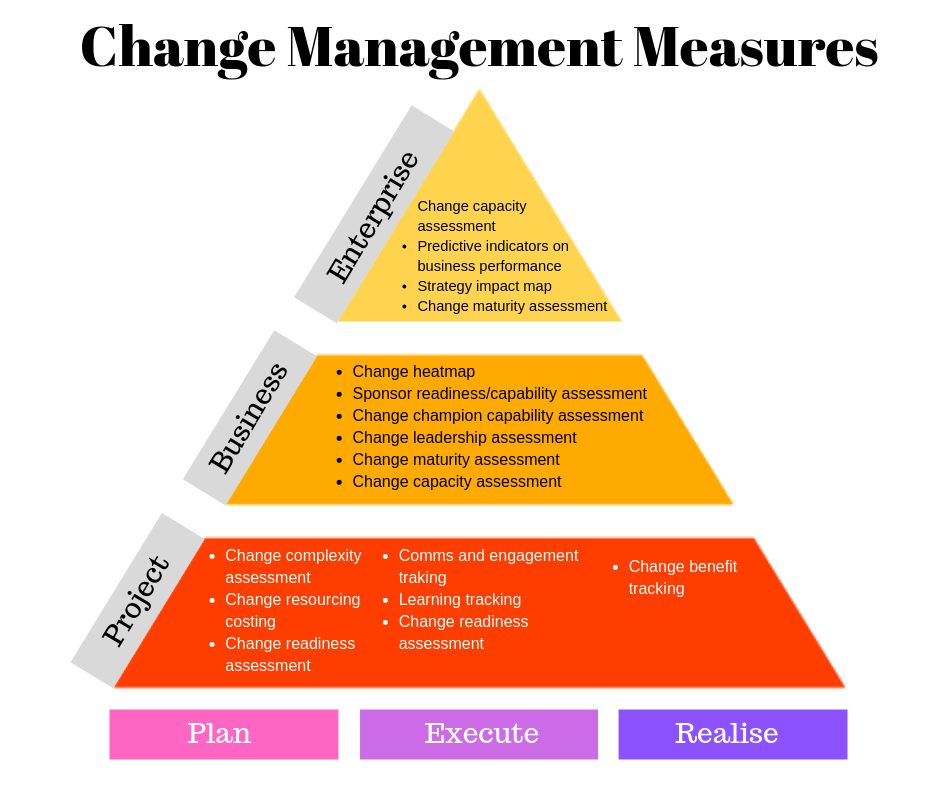
A comprehensive model of Change Management Measures
In this diagram various change management measures are represented along two axes, one being the different phases of the initiative lifecycle, and the other being different organizational levels of project, business and enterprise in which change management measures fall into.
Project level measures
‘Plan’ phase
In this phase of the project, the team is discovering and scoping what the project involves and what the change is. As a result, the details are not known clearly at the commencement of the phase. Later in the phase the scope becomes much clearer and the team starts to plan what activities are required to implement the change.
The change complexity assessment evaluates how complex the project is. It looks at how many people could be impacted, what the size of the impact could be, how many business units are impacted, whether multiple systems and processes are impacted, etc.
Change resourcing costing. At the planning phase of the project cost required for the change management stream of the work is required. This includes such as any contractors, communication campaigns, learning cost, travel, and administration cost, just to name a few.
Change readiness assessment is usually conducted prior to the change and during the change. Usually, the same set of questions is asked of various stakeholder groups to assess their readiness for change.
‘Execute’ phase
The execute phase is one of the most critical parts of the project. Activities are in full flight and the project is busy iterating and re-iterating changes to ensure successful execution to achieve project goals.
Communication and engagement tracking. Effective engagement of stakeholders in the change is absolutely critical. Stakeholder interviews, surveys, communication readership rates are all ways in which engagement may be tracked.
Learning tracking. Measuring learning is critical since it tracks to what extent the new competencies and skills have been acquired through learning interventions. Typical measurements include course tests or quizzes in addition to course evaluations. On the job performance may also be used to track learning outcomes and to what extent learning has been applied in the work setting.
Change readiness assessment continues to be critical to track during the execution phase of the project
‘Realise’ phase
In this phase of the project the change has ‘gone live’ and most project activities have been completed. It is anticipated in this phase that the ‘change’ occurs and that the benefits can then be tracked and measured.
Change benefit tracking measures and tracks the extent to which the targeted benefits and outcomes have been achieved. Some of these measures may be ‘hard’ quantitative measures whilst others may be ‘soft’ measures that are more behavioural.
Business level measures
Business level measures are those that measure to what extent the business has the right ability, capacity, and readiness for the change.
Change heatmaps can help to visualize which part of the business is most impacted by 1 project or multiple projects. The power of the change heatmap is in visualizing which part of the business is the most impacted, and to compare the relative impacts across businesses. As the number of change initiatives increase so would the complexity of the change. When facing this situation organisations need to graduate from relying on excel spreadsheets to using more sophisticated data visualization tools to aid data-based decision making. To read more about change heatmaps and why this is not the only way to understand business change impact, go to The Death of the Change Heatmap.
Sponsor readiness/capability assessment can be a critical tool to help identify any capability gaps in the sponsor so that effort may be taken to support the sponsor. A strong and effective sponsor can make or break a change initiative. Early engagement and support of the sponsor are critical. Both Prosci, as well as Changefirst, have sponsor competency assessment offerings.
Change champion capability assessment. Change champion or change agent are critical ‘nodes’ in which to drive and support change within the organizational network. A lot of change champions are appointed only for one particular initiative. Having a business-focus change champion network means that their capability can be developed over time, and they can support multiple initiatives and not just one. Assessing and supporting change champion capability would also directly translate to better change outcomes.
Change leadership and change maturity assessment – refer to the previous section
Change capacity assessment.
In an environment where there is significant change happening concurrently, careful planning and sequencing of change in balance with existing capacity are critical. There are several aspects of change capacity that should be called out in the measurement process:
Different parts of the business can have different capacity for change. Those parts of the business with better change capability, and perhaps with better change leadership, are often able to receive and digest more changes than other businesses that do not possess the same level of capability.
Some businesses are much more time-sensitive and therefore their change capacity needs to be measured with more granularity. For example, call centre staff capacity is often measured in terms of minutes. Therefore, to effectively plan for their change capacity, the impacts of change needs to be quantified and articulated in a precise, time-bound context so that effective resourcing can be planned in advance.
The change tolerance or change saturation level for business needs careful measurement in combination with operational feedback to determine. For example, it could be that last month a part of the business experienced significant change impact across several initiatives happening at the same time. The operational indicators were that there was some impact on customer satisfaction, productivity, and there were negative sentiments reported by staff that there was too much change to handle. This could mean that the change tolerance level may have been exceeded. With the right measurement of change impact levels for that part of the business, next time this level of change is seen, previous lessons may be utilized to plan for this volume of change. Utilise measurement and data visualization tools such as the Change Compass to track change capacity.
Enterprise level change measures
At an enterprise level, many of the business unit level measures are still applicable. However, the focus is comparing across different business units to sense-make what each part of the business is going through and if the overall picture is aligned with the intentions and the strategic direction of the organization. For example, typical questions include:
Is it surprising that one part of the business is undergoing significant change whilst another is not?
Is there a reason that one business unit is focused on a few very large changes whilst for other business units there is a larger set of changes each with smaller impacts?
Is the overall pace of change optimum according to strategic intent? Does it need to speed up or slow down?
What is the process to govern, report and make decisions on enterprise level change, prioritization, sequencing and benefit realization?
Is there one business unit that is able to manage change more effectively, faster with greater outcomes? How can other business units leverage any internal best practices?
As mentioned in the Change Management Measures diagram, some enterprise level change measures include:
Change capacity assessment – Does one business unit’s change capacity limits mean that we are not able to execute on a critical strategy within the allocated time? How do we create more capacity? Ways in which to create more capacity could include more resources such as staff, or initiative funding, more time is given, or more talent to lead initiatives
Change maturity assessment – At an enterprise level, the concern is with the overall change maturity of the organization. How do we implement enterprise level interventions to build change maturity through programs, networks, and exchanges, such as:
Enterprise change capability programs
Enterprise change analytics and measurement tools
Enterprise change methodology
Enterprise network of change champions
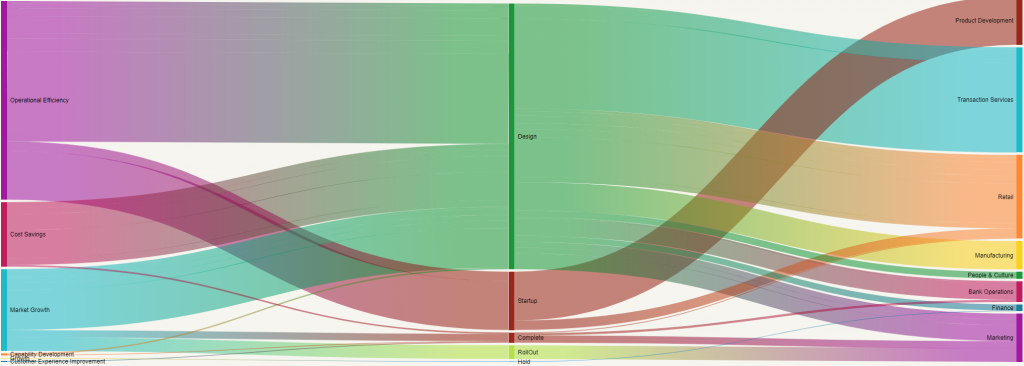
Strategy impact map – Change management need not be focused only on project execution or business unit capability. It can also demonstrate value at an enterprise level by focusing on strategy execution (which by definition is change). The way in which different strategies exert impact on various business units may be visualized to help stakeholder understand which initiatives within which strategic intent impact which business units. To illustrate this please refer to the below diagram which is an example of a strategy impact map. In this diagram, each of the organisation’s strategy is displayed with different initiatives branching out of each strategy. The width of each initiative correlates with the level of impact that the initiative has on the business over a pre-determined period of time. Therefore, the width of each strategy also indicates the overall relative impact on the business.
This data visualization artifact can be valuable for business leaders and strategic planning functions as it depicts visually how the implementation of various strategies is impacting business units. This helps planners to better understand strategy implementation impacts, potential risks and opportunities, and balancing change pace with strategy goals at various points in time.
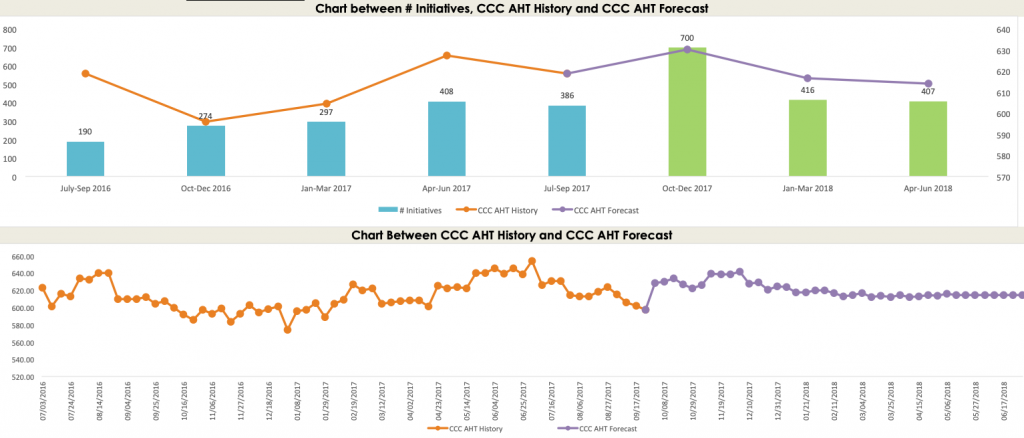
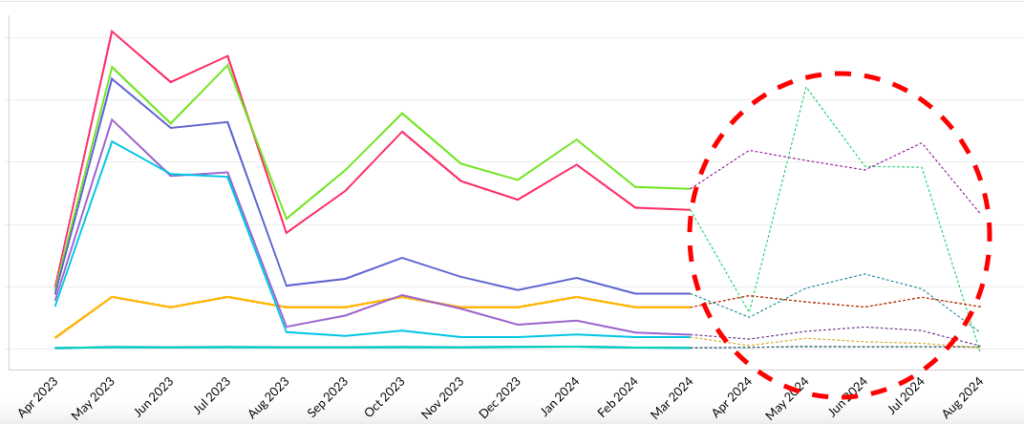
Predictive indicators on business performance – We started this article talking about how data is all around us and we also need to better manage change using data. With quantitative data on change impact, it is possible to ascertain any correlations with operational business indicators such as customer satisfaction, service availability, etc. For those business indicators where there is a significant correlation, it is possible to hence use predictive reporting to forecast performance indicator trends, given planned change impacts.
In the below graph you can see an example of this whereby using historical data it is possible to establish correlations and therefore forecast future impact on business indicators. This example is focused on the customer contact centre (CCC) and key business indicator of average handling time (AHT) is utilized as an illustration.
This type of predictive performance forecasting is extremely valuable for organisations undergoing significant change and would like to understand how change may impact their business performance. By demonstrating the impact on business indicators, this puts the importance of managing change at the front and centre of the decision-making table. At The Change Compass, we are developing this type of measurement and reporting function. This is the frontier for change management – to be established as a key business-driving function (versus a standard back-office function).
Change can be measured and this article has outlined various operational and strategic ways in which change measurement can demonstrate significant value. Most corporate functions cannot exist without data and analytics. For example, Human Resources relies on people and pay data. Marketing cannot function without measurement of channel and campaign effectiveness. For Information Technology, pretty much everything is measured from system usage, to cost, to efficiency. It is time we start utilizing data to better visualize change to better plan and make business decisions.
References:
Miller, David (2011) Successful Change. How to implement change through people. Changefirst Ltd.
Pagon & Banutal (2008) Leadership Competencies for Successful Change Management. Study Report. University of Maribor.
Frequently Asked Questions (FAQ)
What are the most important change management metrics to track? Focus on adoption rates, readiness scores, communication engagement, and benefit realisation metrics tailored to project phases and business capacity.
How do you measure change readiness effectively? Combine pulse surveys with behavioural indicators and sponsor assessments. Balance frequency with depth for actionable insights. Read “Beyond the Survey: A Strategic Lens on Change Readiness Assessment.”
Why replace change heatmaps with other visuals? Heatmaps introduce subjectivity bias. Timeline charts and capacity dashboards provide clearer decision-making data. See “The Death of the Change Heatmap.”
What role does AI play in change measurement? AI enables real-time sentiment analysis, predictive capacity planning, and automated risk detection across initiatives. Platforms integrate natural language queries for instant insights.
How many change metrics should organisations track? Target 8-15 core metrics aligned with strategic objectives across project, business, and enterprise levels to maintain focus and actionability.
What enterprise-level change metrics matter most? Strategy impact mapping, cross-business capacity analysis, and predictive performance forecasting linking change volume to operational outcomes.
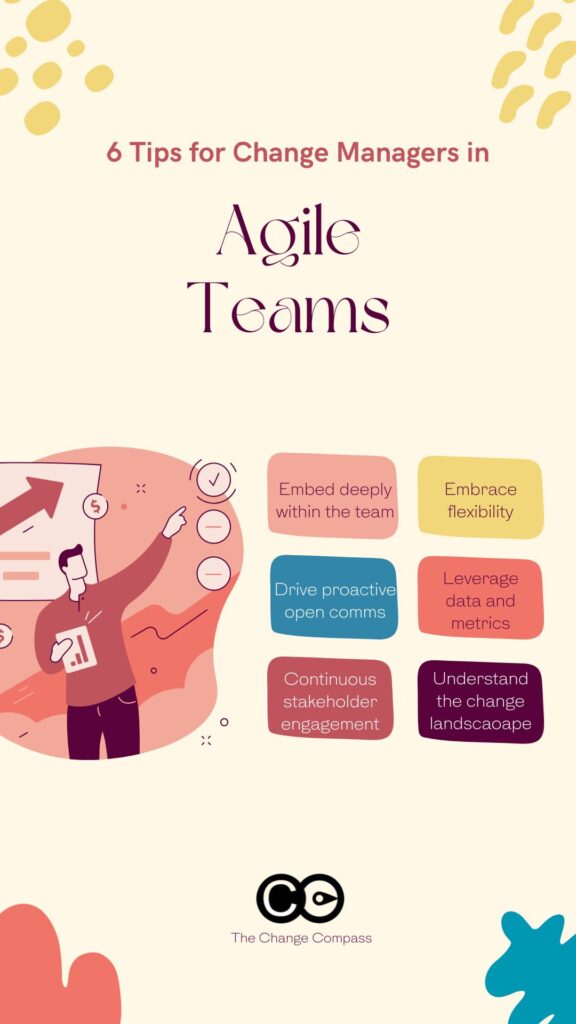
The role of change managers has been left out of the various agile methodologies. This is even though most fully acknowledge the importance of change management in the success of initiatives. Does this mean that the agile teams should and can take on the role of change managers? While most of you reading this article may have change practitioners in the organisations, there are plenty of organisations that run agile teams without change managers in the team.
Is it that in agile environments, change management responsibilities are distributed across team members rather than centralised in a single role? After all the agile team is self-organising and has shared accountability?
For organisations that do not have change managers in agile teams, they are still able to deliver valuable and continuous changes. The difference is in how effective the agile team is in delivering a solution where:
A range of stakeholders are continuously engaged effectively and therefore have high levels of readiness
Stakeholders’ readiness for the pace and design of agile is taken into account and various education/engagement sessions are designed as required
They’re able to identify the various behavioural changes required in fully adopting the change
Stakeholders continuously track and reinforce adoption
The team is aware of the change landscape of impacted stakeholders and can work with them respectively to design and deliver in a way that maximises adoption in a targeted way
It is quite difficult for a small agile team to have all these skillsets. You can equally place the same argument for Business Analysts. Even if the team does not have this role, they could equally undertake a lot of the tasks that a Business Analyst would typically undertake in an agile project, however, maybe not at the same level of professionalism and rigor.
In a small agile team of cross-functional specialists, by design each member is a specialist in his/her functional domain, whether it is testing, software development, operations, etc. It would be rare for a domain specialist to have such a breadth of skillsets to include a range of change management skills. Of course, this is not impossible, but difficult for a team to possess.
An agile team is by design focused on delivering. By design, the agile team is laser-focused on its iteration work and delivering to the schedule at the right quality. It does not have a lot of capacity to devote itself to working with a wide range of stakeholders as a result. The change manager, on the other hand, is by design focused on the world of the stakeholders as well as what the agile team is delivering and designing a series of steps for the changes to take place or a people and organisational perspective.
Moreover, beyond project change management skills, organisations that have a myriad of self-organising agile teams require greater air-traffic control at a portfolio and enterprise level. Whilst this may be fulfilled from a portfolio management perspective, attention should also be paid to change portfolio management. Within a fast-paced change environment, the capacity stakeholders across the organisation have for the changes, and the overall prioritisation and sequencing for these changes are paramount.
Without this, changes may fall off the radar, superseded by other competing changes delivered by other agile teams. Alternatively, change saturation fatigue may be a result. In fact, there is increasing evidence that this is prevalent across organisations. Stakeholders’ capacity for change is limited and must be managed effectively to ensure the right changes are adopted.
If change management so critical to agile changes let’s delve into the essential role that change managers play within agile teams, breaking down their contributions across the four typical phases of an agile initiative: Define, Build, Test, and Deploy.
Define Phase
During the Define phase, agile teams lay the groundwork for the project by identifying objectives, scope, and initial requirements. For change managers, this phase is critical for assessing the scope and complexity of the change and determining the necessary resources and support structures.
Key Activities for Change Managers in the Define Phase:
1. Assessing Change Size and Complexity: Change managers evaluate the magnitude of the change and its potential impact on various parts of the organization. This assessment helps in tailoring change management strategies to address specific needs.
2. Resource Planning: Identifying the required business and change support resources is essential. This includes assembling a team of change champions, communication specialists, and trainers who will help facilitate the change.
3. Strategic Planning: Developing a comprehensive plan that outlines key activities and tactics to engage stakeholders and drive successful change. This plan acts as a roadmap for the entire change management process.
Build Phase
In the Build phase, agile teams start developing the solution. Change managers intensify their efforts to understand the potential impacts of the change and begin engaging stakeholders.
Key Activities for Change Managers in the Build Phase:
1. Detailed Stakeholder Assessments: Conducting thorough assessments to identify how different stakeholders will be affected by the change. Understanding these impacts is crucial for tailoring communication and training efforts.
2. Initiating Stakeholder Engagement: Early engagement with stakeholders to communicate the vision, goals, and expected outcomes of the change. This engagement helps in building awareness and buy-in from the outset.
3. Scenario Planning: Since the exact nature of the change may not be fully defined, change managers work with various scenarios to anticipate potential challenges and opportunities. This flexibility allows for adaptive communication and engagement strategies.
Test Phase
The Test phase is where agile teams validate the solution through testing and feedback. For change managers, this phase is pivotal for ensuring stakeholders are prepared for the upcoming changes.
Key Activities for Change Managers in the Test Phase:
1. Collaborating on Testing Processes: Working closely with agile teams to determine how stakeholders can be involved in testing. This may include business testers, change champions, or end-users who provide valuable feedback.
2. Designing Communication Content and Learning Interventions: Developing and rolling out communication materials and training programs to prepare stakeholders for the change. These interventions are tailored based on feedback from testing.
3. Engaging Stakeholders Through Various Channels: Utilizing demos, team briefings, and other engagement channels to keep stakeholders informed and involved throughout the testing process.
Deploy Phase
The Deploy phase marks the transition of the solution into the live environment. Change managers play a crucial role in ensuring a smooth transition and full adoption of the change.
Key Activities for Change Managers in the Deploy Phase:
1. Ensuring Readiness: Before deployment, change managers gather evidence that stakeholders are ready for the change. This involves assessing training completion, communication effectiveness, and overall preparedness.
2. Executing Engagement Strategies: During deployment, change managers leverage various engagement channels to support the transition. This includes continued communication, support hotlines, and face-to-face interactions to address any concerns.
3. Monitoring and Feedback: Establishing performance metrics to monitor the adoption and effectiveness of the change. Feedback is collected and analyzed to make necessary adjustments and integrate the change into business-as-usual operations.
Key Differences in Change Management for Agile Teams
While the core principles of change management remain consistent, their application within agile teams introduces unique challenges and opportunities. Here are some key differences:
Proactive Integration in Cross-Functional Teams
Change managers actively contribute to the progress of agile teams by embedding themselves within the cross-functional team structure. This close collaboration ensures that change management activities are aligned with the development process, allowing for more effective and timely interventions.
Flexibility and Adaptation
In agile environments, the content and nature of changes may evolve throughout the project lifecycle. Change managers must remain flexible, working with scenarios and adaptable communication strategies to respond to shifting requirements and stakeholder needs.
Continuous Feedback and Engagement
Ongoing stakeholder engagement and continuous feedback are cornerstones of effective change management in agile teams. Regular check-ins, feedback loops, and open communication channels help to identify and address concerns early, ensuring smoother transitions and higher adoption rates.
Iterative Planning and Adjustment
The iterative nature of agile projects necessitates continuous review and adjustment of change management plans. Change managers must be prepared to tweak strategies, update communication materials, and refine training programs based on real-time feedback and evolving project dynamics.
Practical Tips for Change Managers in Agile Teams
1. Embed Yourself in the Team: Become an integral part of the agile team to gain a deeper understanding of the project dynamics and build strong relationships with team members.
2. Embrace Flexibility: Be prepared to pivot and adapt your change management strategies as the project evolves. Flexibility is key to staying relevant and effective. Come up with scenarios such as communication materials and engagement tactics as needed.
3. Drive Proactive Open Communication: Create an environment where stakeholders feel comfortable sharing feedback and concerns. This openness will help you address issues promptly and maintain trust. Note that stakeholders may need learning interventions to truly understand and adjust to agile ways of working.
4. Leverage Data and Metrics: Use data and performance metrics to monitor the effectiveness of your change management efforts. Data does not just apply to the rest of the agile team. Change management data is no less valuable. This will help you make informed decisions and demonstrate the value of your work. To read more about how to measure change check out our practical guide here.
5. Continuous Stakeholder Engagement: Engage with stakeholders early and often. Building strong relationships and maintaining regular communication will increase the likelihood of successful change adoption.
6. Understand the Change Landscape: Since the change manager’s role is to adopt a people lens, it is critical to see from the impacted stakeholder’s perspective the range of changes they are or will be going through. Change that is designed in a vacuum will not be successful.
Change managers play a pivotal role in the success of agile teams, ensuring that changes are effectively adopted and integrated into the organization. By understanding the unique dynamics of agile projects and adopting flexible, proactive, and iterative approaches, change managers can significantly enhance the readiness and adoption of changes. Their efforts not only support the agile team but also drive the overall success of the organization in navigating an increasingly intense landscape of changes.
Is change management just a job or a career? When you clock in and clock out everyday do you ever wonder what is the purpose of all this work? Yes, your natural response could be, well, managing change helps improve employee work experience and we help company land initiatives. We help maximise initiative benefits. Is this all? And are these the only ultimate outcomes?
For those of us who have made change management a career, we often roll out eyes across initiatives as we see common trends and occurrences across initiatives. What would have been highly stressful or dramatic is just seen as ‘yet again’ more of the same. You know what I mean …
Sponsors who only show up for announcements and ghost the project team the rest of the time
Corporate communications wrestle you to the ground by taking out factual information about the initiative that are critical
You send out a series of initiative communications and the impacted teams rarely read them
Some of your stakeholders nod and agree furiously in project meetings and do nothing afterwards, despite repeated engagement and consultations
Thanks for corporate-wide budget cuts, your project is now sliced into bare bones, and all the work required to drive behaviour change evaporate into thin air, to be replaced by a pure system implementation
Don’t get me wrong. There is definitely a lot of organisational benefits in managing change. There are definitely ample studies that draw attention to how, without successful change efforts, initiatives are doomed for failure. We definitely play a key role in achieving those hefty millions in benefits that are targeted. Also, let’s not forget that most of us are in this because we care about people. We truly believe that creating a good experience for people is the essence of what drives successful change.
The big questions is – what is your purpose and the meaning you are striving for when you work in change management? Beyond the cheque that pays the bills, why do we work hard to improve how change is managed? What is our north star? What truly motivates through thick and thin, through obstacles that stakeholders put along the way?
This is a personal question and not always an easy one to answer. There are some who are happy to go to work, get paid, ignore the BS within the corporate environment, just to feed their family and pay the mortgage. Others may have stumbled into change management and find it interesting work. However, to really strive in leading change, year after year, initiative after initiative, there would need to be some kind of burning flame inside you that keeps pushing you forward.
Exploring your own motivation in driving change not only helps you to understand your own behaviour and the source of your energy, it also helps you be clear about what you really care about. Clarity about your passion helps you to know what to reach for next time you are feeling down about how the project is going, or none of your change tactics are panning out.
For me, the meaning of managing change is only realised after experiencing a series of bad changes. Let me share more. I’ve worked for organisations where I have seen how hurtful and how traumatic bad changes have been for employees. A typical context is organisational restructuring. These are just a few examples what could happen ….
Employees are marched out by security after having lost their jobs on the day of the announcement, in case they retaliate and ‘steal’ company secrets, in public display for everyone to see
Leaders lie through their teeth about what is going to happen to the restructure in order to keep the workers productive, and eventually everyone realises it’s all been a series of lies and fabrications
Consultants are brought in to do the analysis and leaders basically reference what the message is from consultants, without interpreting what this really means for their people. Employees with years of tenure who have significant insight into how to improve business outcomes are ignored
In order to gain better roles and responsibilities managers backstab each other and even team members to jostle their way to favourite positions in the new org chart
For the individuals involved it could be such traumatic experiences that they may be scarred by the experience. Counselling may be required and organisational stress levels may be through the roof. It is not just those individual employees, but their families and friends could also be impacted like ripples in a pond.
Even if you don’t focus on the most dramatic of changes, a series of smaller badly run changes can still impact employees, their belief in the company, their trust in management, their work life health as well as overall health. Multiple smaller changes can add up.
So for me, the real meaning behind managing and leading change is about all those individuals that could be impacted, whether it be employees, customers or partners. Each is a person with a set of circumstances. They may be dealing with other stressors in their family or friendship circles already, or that they may be particularly vulnerable. This is particularly the case in our virtual working world.
Every person deserves to lead a happy, healthy work life. And change is such an important and memorable part of working life that every life you touch is a touch of dialling up the happiness/health level. It may not be the jumping up and clicking heels type of happiness. It would be managing risks so that negative experiences are avoided or minimised. Now imagine a long list of multiple changes all effective managed. Such is the power of managing change. We touch working lives in profound ways.
This is why at The Change Compass our vision is to improve the experience of people during change. “People’s work lives shape who we are and bad change experiences can be traumatic. With great change experiences, we can change the world”.
Now, isn’t this something to get motivated about through thick and thin?
What is YOUR meaning in managing change? How have your experiences shaped your approach and belief in managing change? How do you keep going day in and day out especially when times are tough?
There is now a lot of attention and focus on data. However, is the same applied to change management data? With the substantial financial investments companies make in change efforts, there’s a growing recognition of the need to leverage change management data strategically. Senior managers and executives are increasingly demanding data-driven insights to make informed business decisions. Here, we explore the challenges associated with change data, the strategic approaches to managing it effectively, and how incorporating it into the decision-making process can drive organizational success.
Common Challenges in Working with Change Data
Ad hoc and Tactical Approaches One common challenge in working with change data is the ad hoc and tactical nature of its collection. Often, data is gathered as needed, primarily at the project level. This can result in a fragmented view of change initiatives, making it challenging to derive meaningful insights. For instance, progress data may be limited to generic metrics such as the number of change impact sessions or completed training sessions, lacking depth and context.
Data Insufficiently Fact-Based Another prevalent issue is the creation of data that lacks a solid factual foundation. Change practitioners sometimes rely on gut-feel ratings or broad categories that are difficult to defend or substantiate infront of stakeholders. Heatmaps, a popular visualization tool, may be based on subjective assessments rather than objective, quantifiable measures, hindering the data’s credibility and utility.
Ineffective Data Visualizations Data visualizations play a crucial role in conveying information effectively. Unfortunately, some visualizations fall short of making a significant impact. Whether they are overly colorful, fail to use the right chart to highlight key points, or present data in a way that obscures the primary message, ineffective visualizations can impede the decision-making processes.
Seeking Easy Fixes Many change practitioners view working with data as a chore and opt for quick fixes. They may collect just enough data to generate a report or dashboard, neglecting the importance of a thorough understanding and management of the data. This short-sighted approach can compromise the quality and reliability of the insights derived from the data.
Strategic Approaches in Working with Change Data
Strategic approaches to manage change data can result in significant value for the organisation. Imagine the power of a range of change management data that highlights anything from impact levels, saturation risks, sentiments, adoption risks and benefit realization progress. Such is the power of change data, if managed effectively. What are some of these strategic approaches?
Managing Data as a Core Routine To address the challenges associated with ad hoc and tactical data collection, organizations must establish routines for managing change data. Monthly data reviews, updates, and audits create a disciplined approach to ensure the data remains accurate, relevant, and valuable. By making data management a core routine, organizations foster a culture of accountability and accuracy. This can be applied across a large program, a business unit, a portfolio of initiatives or across the enterprise.
Leveraging AI for Data Auditing and Cleansing Artificial Intelligence (AI) can play a pivotal role in auditing and cleansing change data. Platforms like The Change Compass offer features that automate these processes, reducing the likelihood of errors and ensuring data integrity. AI-driven tools can identify inconsistencies, outliers, and inaccuracies, providing a more reliable foundation for decision-making.
Linking Change Data with Other Business Sources The true power of change data emerges when it is connected with other relevant business data sources. By integrating change management data with project data, HR data, risk data, and operations data, organizations gain a holistic view of their business landscape. This interconnected approach allows for a comprehensive understanding of key business risks and opportunities, facilitating more informed decision-making.
Incorporating Data into Decision-Making Bodies Change data should not exist in isolation; it should be integrated into key decision-making forums and processes. From executive leadership forums and strategic planning sessions to portfolio planning and operational meetings, incorporating change data into these discussions ensures that insights derived from the data inform critical business decisions. This alignment helps organizations proactively address challenges and capitalize on opportunities.
While recognizing the strategic importance of change data is a significant step forward, change practitioners must actively implement practical measures to enhance their approach to change data management. Here are some recommendations to help change practitioners become more strategic in their utilization of change data:
Standardize/Routinize Data Collection Processes: o Develop standardized processes for collecting change data across different projects and initiatives. o Implement consistent data collection templates and methodologies to ensure uniformity and comparability of data across initiatives and business units
Invest in Training and Skill Development: o Provide training for change practitioners on data management best practices, including data collection, analysis, audit and interpretation. This is critical to drive data capability and maturity. o Foster a data-driven culture within the organization by equipping practitioners with the necessary skills to leverage data effectively.
Utilize Technology and Automation: o Embrace technological solutions, such as data analytics tools and AI-driven platforms, to automate data auditing, cleansing, and visualization processes. o Leverage technology to streamline data collection and reporting, reducing manual effort and minimizing the risk of errors.
Encourage Cross-Functional Collaboration: o Facilitate collaboration between change management teams and other departments, encouraging the sharing of data and insights. o Establish cross-functional teams to integrate change data with project data, HR data, and other relevant business sources.
Implement Data Governance Frameworks: o Develop and implement robust data governance frameworks to ensure the accuracy, security, and compliance of change data. o Define roles and responsibilities for data management within change initiatives, promoting accountability and ownership.
Enhance Data Visualization and Reporting: o Invest in training or hiring professionals with expertise in data visualization to create compelling and impactful reports. o Tailor visualizations to the audience, ensuring that key messages are communicated clearly and effectively.
Conduct Regular Data Reviews and Audits: o Establish a routine for regular data reviews, updates, and audits to maintain the accuracy and relevance of change data. o Use audits as an opportunity to identify and rectify data discrepancies or inconsistencies.
Integrate Change Data into Decision-Making Processes: o Actively participate in executive leadership forums, strategic planning sessions, and other decision-making bodies. o Present change data alongside other relevant business data to contribute to well-informed decision-making.
Measure and Communicate Value: o Develop metrics to measure the value generated by change initiatives and communicate these metrics to key stakeholders. o Regularly assess the impact of change data on decision-making processes and adjust strategies accordingly.
Seek Continuous Improvement: o Foster a culture of continuous improvement within the change management function. o Encourage practitioners to reflect on past experiences, learn from challenges, and refine their approach to change data management over time.
The strategic management of change data is not just a necessity but a critical component of achieving business success in today’s dynamic environment. By addressing common challenges and adopting strategic approaches, organizations can unlock the true potential of change data. As the business landscape continues to evolve, leveraging data-driven insights becomes a strategic imperative for navigating change, mitigating risks, and capitalizing on opportunities. Embracing change data as a strategic exercise positions organizations to not only survive but thrive in an ever-changing marketplace.
As the global landscape continues to evolve, so too does the field of change management. The year 2024 promises a shift in the way organizations approach change, driven by a combination of economic factors, continued technological advancements, and the ever-increasing need for adaptability. In this article, we explore the background factors influencing the upcoming changes, and delve into seven key predictions that are set to reshape the realm of change management in the coming year.
Background
Inflation Continue to Drop: A Ray of Economic Hope
One of the pivotal factors shaping the economic landscape in 2024 is the anticipated drop in inflation. After grappling with economic uncertainties, organizations can breathe a sigh of relief as the pressure from rising costs eases. This economic respite paves the way for strategic investments and initiatives, creating a conducive environment for change.
Avoiding Recession: Building Resilience Through Change
The specter of recession has loomed large in recent years, casting a shadow on organizational stability. However, as we step into 2024, the concerted efforts to avoid recession is forecasted to have paid off. Organizations have become more resilient, honing their ability to weather economic storms through strategic change initiatives. This backdrop sets the stage for a transformative year in change management.
Key Predictions
Agile Change as Business as Usual
In 2024, the concept of Agile Change is no longer a mere ‘work in progress’ but rather an integral part of Business as Usual (BAU). Organizations have recognized the need for agility in the face of rapid change, and Agile change methodologies have transitioned from experimental to foundational. This shift represents a change in mindset, emphasizing iterative processes, collaboration, and responsiveness to evolving circumstances. After more than 10 years of agile project methodology in the market place, agile change practices are starting to become ‘the norm’.
The Rise of Adaptive/Hybrid Change Models
Building on the previous point, agility applies beyond at an ‘intra-methodology’ perspective, but also how change approaches and methodologies need to be mixed and matched to work.
The increasing pace of change demands a more flexible approach from change practitioners. The dichotomy between structure and flexibility, innovation and process-focused strategies, gives rise to adaptive and hybrid change models. The emergence of terms like “wagile” (a fusion of waterfall and agile) underscores the need for a balanced approach that combines the best of both worlds. Organizations must strike a delicate balance between structure and flexibility to navigate the complexity of modern change initiatives.
For example, in regulated business functions there may need to be quite rigid planning of exactly when the changes must take place as well as the level of consultation and engagement required. However, the actual design of different engagement, positioning and employee involvement strategies may be tested in an iterative way.
Expanding Skill Sets for Change Practitioners
To meet business needs change practitioners will need to have a broader range of skills beyond ‘people skills’. In 2024, the demand for change professionals with a broader skill set encompassing strategic thinking, digital/data literacy, and business acumen will continue to be on the rise. As change initiatives become more complex, practitioners must equip themselves with multifaceted skills to address the diverse challenges that emerge during the change process.
For example, stakeholders are increasingly looking for data for reporting purposes to get a clearer sense of how changes are tracking. Beyond sentiments and opinions, stakeholders are looking for adoption indicators as well as precise indications of the nature of impacts across the employee population.
The Ascendance of Change Portfolio Management
Change portfolio management will continue to gain increasing visibility and importance in 2024. Organizations are recognizing the need to manage change initiatives collectively, aligning them with strategic objectives. The holistic oversight provided by change portfolio management enables organizations to prioritize, monitor, and evaluate change initiatives in a comprehensive manner, ensuring that resources are optimally allocated for maximum impact.
Whilst stakeholders may not be clear of the differences between transformation, portfolio management and change portfolio management, they are clearer of the benefits required in managing people impacts, against the need to maximise business performance and change adoption.
Leveraging Change Data for Informed Decision-Making
In the evolving landscape of change management, data is no longer just a nice-to-have; it’s a necessity. In 2024, the norm becomes leveraging change data to make informed decisions. Organizations recognize the value of data analytics in understanding the impact of change, identifying patterns, and proactively addressing challenges. This data-driven approach enhances the efficacy of change initiatives and provides a foundation for continuous improvement.
It is no longer that the expectation for data-led decision making rests in project functions such as technical development, business analysis, testing and user-experience. Change management teams are also expected to demonstrate the impact of their work through data.
Increasing Use of Software in Change Implementation
The leverage of software in change implementation should see an uptick in 2024, along with general increase in software usage rates in organisations. Organizations are leveraging technology to streamline and enhance various aspects of the change management process. From change project management tools, change measurement platforms, as well as change portfolio management tools the role of software can accelerate the pace of change initiatives and supports the realisation of benefits.
AI for Change: From Wait-and-See to Full Adoption
Artificial Intelligence (AI) for change management is no longer a ‘wait-and-see’ proposition; it’s a reality in 2024. In 2023 a lot of users have sat on the fence as others argue about the risks in using AI and data security. The launch of Microsoft Co-pilot and the continued adoption of Chat GPT 4 signal a paradigm shift in how organizations approach AI. Users will over time be used to asking a chat bot, using prompts to form analysis and other AI features to augment their work. Advanced AI change tools can also assist in decision-making, predictive analytics, and even virtual facilitation, revolutionizing the efficiency and effectiveness of change processes.
In addition, there will be significant interest in change management tools that have incorporated AI features, from data and trend analysis, risk analysis to recommendations on change approaches.
As organizations navigate the complexities of 2024, change management emerges as a critical linchpin for success. The predictions outlined in this article reflect an emerging shift in the approach to managing change, from the integration of Agile methodologies to the widespread adoption of AI. Change practitioners must equip themselves with a versatile skill set to thrive in this dynamic environment, where strategic thinking, digital literacy, and adaptability are paramount. As we stand on the cusp of a transformative year, organizations that embrace these predictions are poised not only to weather the winds of change but to harness them for sustained success.
In this Change Practitioner Q&A series, we talk to change managers to ask them how they approach their work. This time we are talking to Annah Kaspar.
Change Compass: Describe yourself in 3 sentences
Annah: I’m curious and a little irreverent because I want to know everything (except, controversially, about football). I love to hear people’s stories and tend to empathise deeply. Happiness is going to places I’ve never been, and hanging out with kind and interesting people.
Change Compass: What has been the most challenging situation for you as a change practitioner? Tell us what happened and how you fared through it.
Annah: It was not due to a type of change or a stakeholder group. It was working with a Program Manager who believed change management was an independent addendum of sorts, separate from the ‘main work’ of technology and process. They didn’t see how project stream interdependencies have a direct correlation to the quality of change outcomes, or that the best change outcomes occur when all project team members collaborate. This played out dreadfully when the PM refused to prioritise a gap analysis, despite this being a dependency for identifying changes and impacts.
The PM was unfamiliar with the flow-on effects. Unclear changes and impacts create ineffective change strategies, poor forecasting of time/effort/budget, ineffective stakeholder engagement and misaligned key messages. This creates low confidence in project solutions and poor adoption and change experience.
How did I fare? Suffice it to say it wasn’t fun for me or the stakeholders, and by that time the root cause (no gap analysis) was an abstract concept. I believe delivery alignment within a project team is one key indicator for delivery effectiveness across an organisation. When there are transparent and integrated project delivery plans and open dialogue about how all project team members play a valued role, then I know we can deliver superb change outcomes.
Change Compass: What are the most useful things to focus on when you first start on a project, and why.
Annah: I make a beeline for the project Business Case, or if there isn’t one, I work with others to get clear on the project drivers, especially the benefits. This is the ultimate ‘why’. If there are no connections between the project’s Business Case and the organisation’s strategy then I look to create these, otherwise the project is in trouble before it has even started.
All project outcomes, scope and solutions flow from the case for change. The next most important is a High Level stakeholder scan and a High Level impact scan. This requires data, data, data! The more the better, as it increases the odds of making better judgments. So even though it’s early days, it’s never too soon to capture data, and for that, you need the whole project team onboard with the critical role of collecting and validating it so you can optimise the delivery approach.
Change Compass: As change practitioners we don’t often get to stick around to see the fruits of our labour, but from your experience what are the top factors in driving full change adoption?
Annah: I was once on the receiving side of change, so I have strong views about this! If these four things are covered, then you’ve achieved sustainability:
Active & visible leaders who advocate for the changes and put their reputation on the line to support success,
A project team who co-creates integrated delivery strategies with impacted people
Direct feedback loops for impacted people. These need in-built response mechanisms and complete psychological safety. No feedback should ever be punished or dismissed
Post-project monitoring of key performance indicators (team and individual) with corresponding rewards to reinforce desired results and support where required to uplift results
Change Compass: You’re known to remain calm when there is a lot of stress and project drama around. What is your advice for others?
Annah: My tough but fair mentor once advised me to think up worst-case scenarios to prepare for challenges. It seemed counter-intuitive and overly negative at first, and would stress me out more! But over time, I saw that I too fall into the category of a perfectly nice and reasonable person who is overwhelmed by fear.
This mostly leads to unhelpful perspectives (cognitive distortions or ‘thinking traps’), unhelpful behaviours (character assassination, shutting down, unnecessary displays of overt authority etc) and ultimately a toxic workplace culture. So in difficult situations, the habit of thinking through not-so-great scenarios, combined with mindfulness, is just a basic form of risk management.
I’m now a huge advocate for speaking up early about risks and applying risk management to all aspects of project delivery. It’s not about ticking boxes. It’s about protecting us by counter-intuitively facing discomfort, creating emotional space for ourselves and others to regulate responses, and removing thinking traps so we can make those trade-off decisions to solve a project drama.
Change Compass: Thanks for sharing your experiences and wisdom with us Annah!
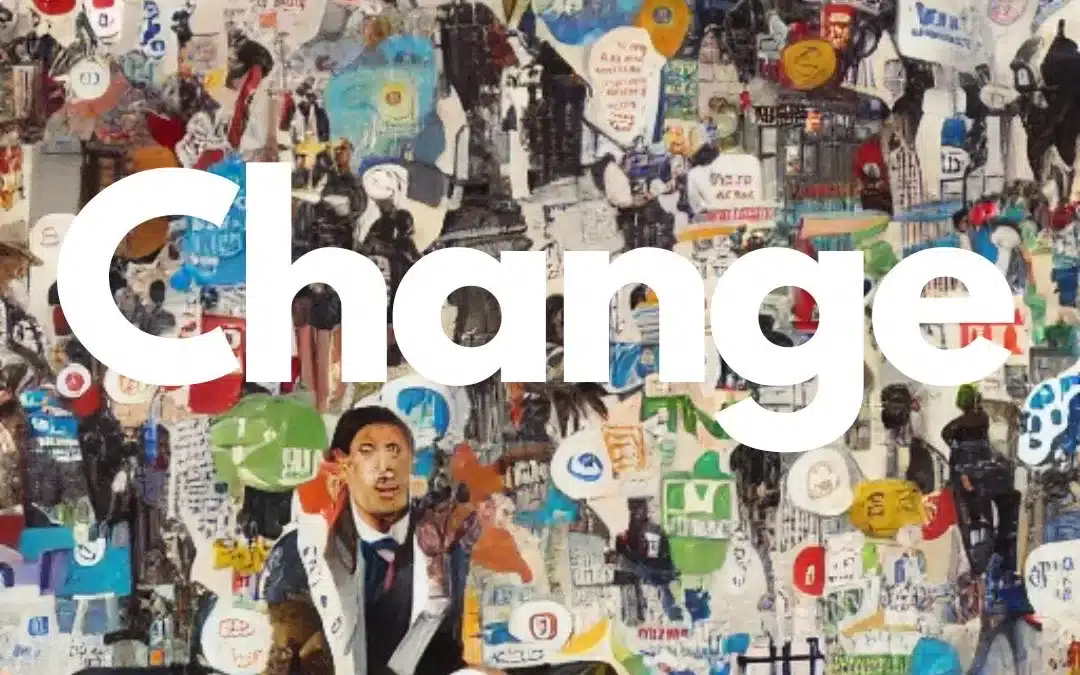
Not too long ago, ‘change’ was predominantly linked to technological breakthroughs and process optimizations. Companies were driven to adopt new technologies and methodologies to stay ahead of the competition and meet the growing demands of consumers. The focus was on efficiency, productivity, and achieving higher profits through innovation. Terms like ‘digital transformation’ and ‘disruption’ frequently dominated boardroom discussions and industry conferences.
It has been that the focus was mostly on technology and process. These were considered the ‘hard’ levers that can be pulled to gain significant business improvements. Companies have been spending big on digitizing their business to save costs and investing in streamlining processes as well.
However, the narrative has shifted.
While technology continues to advance at an unprecedented pace, ‘change’ has taken on a more profound and holistic meaning. Today, companies and people, in general, are recognizing that the ability to adapt, evolve, and respond to the world’s myriad challenges is the true essence of progress.
One reason ‘change’ has become a prevailing buzzword is its resonance with a broader audience. Unlike technical jargon, it connects with people on a more personal level, emphasizing that change is not just about adopting new tools and strategies, but about embracing growth and personal development. It speaks to the capacity of individuals to navigate uncertainties, adjust their mindset, and embrace continuous learning.
Moreover, an increasing percentage of companies are aware that their success hinges on the collective ability of their employees to adapt and remain agile. Leaders now recognize that fostering a culture of change and learning is crucial for attracting and retaining talent, boosting employee morale, and nurturing innovation.
Looking around us, the word ‘change’ is everywhere. Not only are people a lot more comfortable talking about change, but there is also a general acknowledgment of change as an overt occurrence.
Advertising and Slogans: Embracing the Spirit of Change
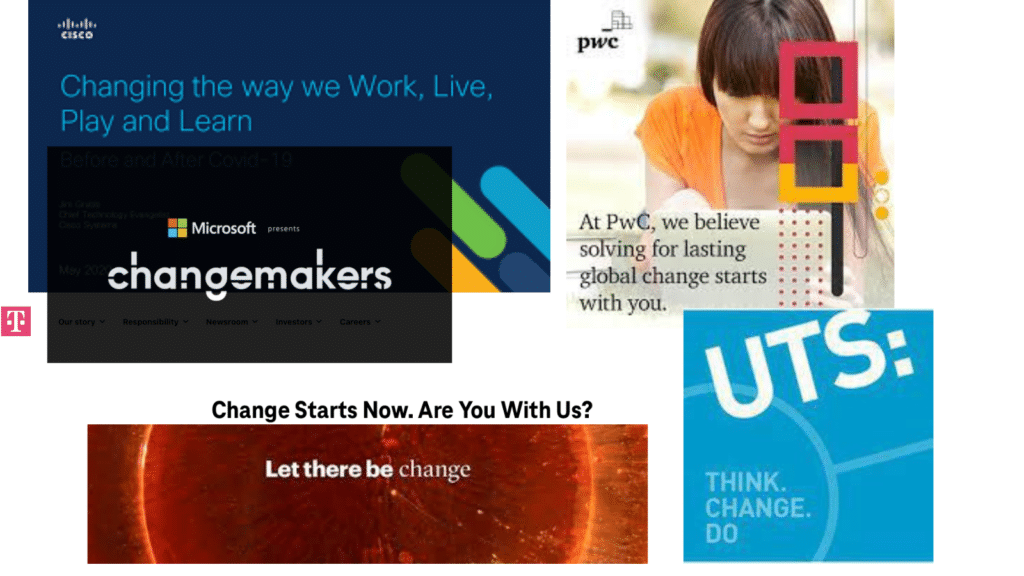
Companies are also quick to adopt the word ‘change’ in their jargon. Here are some examples.
Cisco “Changing the Way We Work, Live, Play, and Learn”
Cisco, a multinational technology company, explicitly uses the word ‘change’ in its advertising and philosophy. The slogan “Changing the Way We Work, Live, Play, and Learn” highlights Cisco’s focus on transforming various aspects of modern life through their technological solutions.
2. Accenture – “Let there be change”
Accenture, a global consulting and professional services firm, uses the phrase “Let there be change” in its advertisements and marketing materials. This tagline reflects the company’s focus on driving transformative change for its clients and within the industries it serves.
3. T-Mobile – “Change starts now”
This encapsulates the company’s commitment to driving transformation and initiating positive changes in the telecommunications industry. The slogan suggests a sense of urgency and empowerment, encouraging customers to take action and embrace the benefits of a new era in mobile communication.
4. PwC – “Solving for global change starts with you”
This tagline conveys the idea that PwC believes individuals have the power to drive positive change on a global scale. It encourages people to take action and play an active role in addressing global challenges and making a difference. By emphasizing that “you” are the starting point for solving global change, PwC highlights the importance of individual responsibility, innovation, and collaboration in creating a more sustainable and equitable world.
5. University of Technology Sydney “Think. Change. Do.”
This represents UTS’s commitment to fostering a transformative learning experience that prepares its students to be active contributors to society and catalysts for positive change. However, please note that taglines can be updated or changed over time, so it’s a good idea to verify the most current information from UTS’s official sources.
The prevalence of ‘change’ in advertising and slogans reflects companies’ desire to connect with their audiences on a deeper level. By evoking the spirit of change, these companies emphasize their commitment to innovation, customer-centricity, and positive societal impact. They appeal to consumers who seek purpose-driven brands and are eager to embrace progress and sustainability.
Change as a Catalyst for Resilience
In an ever-changing world, adaptability is synonymous with resilience. Companies that can quickly adjust to market shifts, economic downturns, and unforeseen challenges are more likely to thrive. ‘Change’ has thus become the rallying cry for building organizations that are not only successful but also capable of weathering storms and bouncing back from setbacks.
What this means for change practitioners
Change practitioners are in an excellent position to help organisations to shift their change capability and deliver on business improvement objectives. Change is increasingly acknowledged across organisations as a critical competency. The focus on change is there and change practitioners should use this to spearhead the momentum.
What next?
To take things to the next level, change practitioners must complement the upscaling of digitization and AI in organisations by augmenting the same in their work. This means incorporating more machine learning and AI, more digitization, and greater usage of data.
Change practitioners should ensure data is a core part of their practice and a foundational way of formulating change approaches and recommendations to their business stakeholders. Business leaders will increasingly leverage data across all business facets in business management, enabled by digital solutions. In a similar manner, change practitioners must also leverage digital solutions to automate and increase the effectiveness of change work.
Within an increasingly complex change environment, change practitioners should be well-versed in collecting and analysing data and generating data insights, again leveraging digital solutions. With the promise of AI and machine learning, there is already plenty of current opportunities to improve the effectiveness of change work, today. The uptake of this is up to each change practitioner.
The rise of ‘change’ as a popular buzzword reflects the transformative times we live in. As technology continues to shape the world around us, it is the capability of human beings to adapt and evolve that has taken center stage. From technological advancements to human adaptability, ‘change’ has transcended industries and become a part of our collective consciousness. For change practitioners, this is an opportune time to use this momentum to ramp up their own adoption of the digitization of change work and use this to improve the effectiveness of change.
Change management professionals often struggle with proving the worth of their services and why they are needed. There are certainly plenty of reasons why change management professionals are required and most experienced project managers and senior leaders would acknowledge this. However, for the less mature organisations that may not have had effective change management experts leading initiatives, the rationale on the additional value of change management may be less clear.
When we look across different project members and project teams, it is easy to argue that without developers, the technical project cannot progress. Without business analysts, we cannot understand and flesh out the core business steps required in the initiative. And of course, we definitely need a project manager for a project. But, what’s the justification for a change manager? Many projects have other project or business representatives do the change work instead.
As an attempt to justify in a very direct way, the value of change management, many resort to ROI calculations and aim toward higher ROI. This ROI of change management may seem like a great way to convey and show in a very direct and financial way, the value of change management towards project success. After all, we use ROI for calculating projects, why not use the same for change management as well to value the people side of change?
There are plenty of articles on how to best calculate change management ROI. Here are a couple:
1. PROSCI
Prosci has a good, clear way of calculating change management ROI within a project (though it doesn’t take into account speed of adoption). You simply evaluate to what extent employee adoption is important to the project. Then you take the overall expected project benefits and deduct the part of the expected benefits if there was no adoption. This is termed “people side benefit contribution”.
People Side Benefit Contribution = Expected Project Benefits – Expected Project Benefits (if adoption and usage = 0)
People Side Benefit Coefficient = People Side Benefit Contribution / Expected Project Benefits
2. Rightpoint
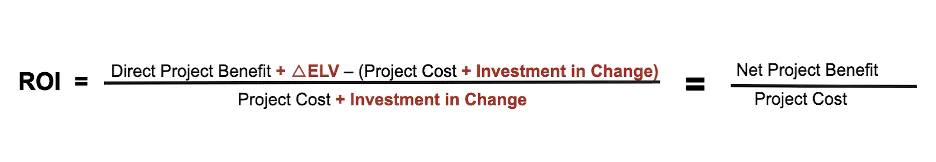
Rightpoint has a variation to this calculation. They have added ELV (Employee Lifetime Value) to the calculation.
Using ROI may be useful when the cost of the initiative is the critical focus for the organisation for its strategic investment. However, it is not the only way to convey the overall value of successful change management. In addition, the ROI method limits the value of change management to focus on the cost invested versus the value created. Also, this type of calculation limits the value of change to a project by project perspective.
So, how else do we show the direct financial value of change management? Let’s look to research. It turns out there are plenty of research examples. Here are some:
McKinsey & Company. (2016). The people power of transformations. This study found that transformation initiatives are 5.8 times more successful if CEOs communicate a compelling change story, and 6.3 times more successful when leaders share messages about change efforts with the rest of the organization. Link here.
Korn Ferry. (2018). Engaging hearts and minds: Preparing for a changing world. This study found that calls out change as a key trend found that companies with high levels of employee engagement had 4.5 times higher revenue growth compared to companies with low levels of engagement, noting that all companies are undergoing change. Link here.
IBM. (2016). Making change work … while the world keeps changing. This study found that 76% of successful projects include change management activities at the beginning of their overall project plans, which is 33% more than less successful projects. Link here.
IBM. (2015) Why a business case for change management. The article references a survey carried out in 2010 where companies that apply a value (benefit) realization approach (of which change management is a core component) complete projects at least twice as quickly and under budget by a factor of at least 1.9 times, Compared to those that don’t. Link here.
Towers Watson. (2013). Change and communication ROI. Organizations with highly effective communication and change management practices are more than twice as likely to significantly outperform their peers in total shareholder returns, versus organizations that are not highly effective in either of these areas. Link here.
Prosci. (2020). Best Practices in Change Management 11th Edition. The paper referred to a Prosci study that found that projects with excellent change management practices 6 times more likelihood of meeting project objectives than those that are poor. Link here.
So the value the importance of change management, let’s take a comparison to see the difference in using a ROI calculation of the value of change management versus using findings from the above research findings to demonstrate the derived value.
Let’s take a typical project example. Company A has ….
Annual revenue of $1 billion with 5% profitability
The revenue growth is 1%
Project A costs $1Million and is targeted for $3 million in benefits.
If the expected project benefits without adoption would be $1Million, then, the people-side contribution is …
$2Million / $3Million = $667K.
Let’s contrast this to other calculations using research.
Research findings | Calculation
Korn Ferry study where companies with high levels of employee engagement had 4.5 times higher revenue growth compared to companies with low levels of engagement. Taking a very conservative approach of portioning on 1/3 of employee engagement linked to change, this means 1.5 times higher revenue growth. | Taking a very conservative approach of portioning 1/3 of employee engagement as linked to change, this means 1.5 times higher revenue growth. This means if the revenue growth is 1%, then the additional revenue is $15 Million per year.
You can see that $15 million in value is much higher than the $667K in initiative ROI. From these examples, you can see that the financial value dwarfs that from the ROI calculation. On top of this, these are from research findings, which may have a stronger perceived validity and be easier to be trusted by stakeholders than the ROI calculation.
To point out, it is not an apple-to-apple comparison between the change management ROI from one initiative to the organisational value of change management across initiatives. However, the call out is that:
The financial value of change management does not need to be limited to individual initiatives
The sum may be greater than its parts. Rather than measuring at initiative levels, research findings are looking at organisational-level value
The value of change management may be more than cost, but also other value drivers such as revenue
As change management practitioners we should not shy away from calling out and citing the value of change management. Cost may be one value, but the true benefit of change management is both the top line as well as the bottom line. Directly referring to the research-backed findings also helps to highlight its value size and importance.
To do this, we should also work to deliver organisational value in managing change and not limit ourselves to one initiative. Focus on uplifting change management capability in the forms of leadership styles, change governance, change analytics, and change champion network capability, just to name a few.
Change management is often seen as a ‘soft’ discipline that is more an ‘art’ than science. However, successful change management, like managing a business, relies on having the right data to understand if the journey is going in the right direction toward change adoption. The data can inform whether the objectives will be achieved or not.
Data science has emerged to be one of the most sought-after skills in the marketplace at the moment. This is not a surprise because data is what powers and drives our digital economy. Data has the power to make or break companies. Companies that leverages data can significant improve customer experiences, improve efficiency, improve revenue, etc. In fact all facets of how a company is run can benefit from data science. In this article, we explore practical data science techniques that organizations can use to improve change outcomes and achieve their goals more effectively.
Improved decision making
One of the significant benefits of using data science in change management is the ability to make informed decisions. Data science techniques, such as predictive analytics and statistical analysis, allow organizations to extract insights from data that would be almost impossible to detect or analyse manually. This enables organizations to make data-driven decisions that are supported by empirical evidence rather than intuition or guesswork.
Increased Efficiency
Data science can help streamline the change management process and make it more efficient. By automating repetitive tasks, such as data collection, cleaning, and analysis, organizations can free up resources and focus on more critical aspects of change management. Moreover, data science can provide real-time updates and feedback, making it easier for organizations to track progress, identify bottlenecks, and adjust the change management plan accordingly.
Improved Accuracy
Data science techniques can improve the accuracy of change management efforts by removing bias and subjectivity from decision-making processes. By relying on empirical evidence, data science enables organizations to make decisions based on objective facts rather than personal opinions or biases. This can help reduce the risk of errors and ensure that change management efforts are based on the most accurate and reliable data available.
Better Risk Management
Data science can help organizations identify potential risks and develop contingency plans to mitigate those risks. Predictive analytics can be used to forecast the impact of change management efforts and identify potential risks that may arise during the transition. For example, change impacts across multiple initiatives against seasonal operations workload peaks and troughs.
Enhanced Communication
Data science can help facilitate better communication and collaboration between stakeholders involved in the change management process. By presenting data in a visual format, such as graphs, charts, and maps, data science can make complex information more accessible and understandable to all stakeholders. This can help ensure that everyone involved in the change management process has a clear understanding of the goals, objectives, and progress of the transition.
Key data science approaches in change management
Conduct a Data Audit
Before embarking on any change management initiative, it’s essential to conduct a data audit to ensure that the data being used is accurate, complete, and consistent. For example, data related to the current status or the baseline, before change takes place. A data audit involves identifying data sources, reviewing data quality, and creating a data inventory. This can help organizations identify gaps in data and ensure that data is available to support the change management process. This includes any impacted stakeholder status or operational data.
During a data audit, change managers should ask themselves the following questions:
What data sources from change leaders and key stakeholders do we need to support the change management process?
Is the data we are using accurate and reliable?
Are there any gaps in our data inventory?
What data do we need to collect to support our change management initiatives, including measurable impact data?
Using Predictive Analytics
Predictive analytics is a valuable data science technique that can be used to forecast the impact of change management initiatives. Predictive analytics involves using historical data to build models that can predict the future impact of change management initiatives. This can help organizations identify potential risks and develop proactive strategies to mitigate those risks.
Change managers can use predictive analytics to answer the following questions:
What is the expected impact of our change management initiatives?
What are the potential risks associated with our change management initiatives?
What proactive strategies can we implement to mitigate those risks?
How can we use predictive analytics to optimize the change management process?
Leveraging Business Intelligence
Business intelligence is a data science technique that involves using tools and techniques to transform raw data into actionable insights. Business intelligence tools can help organizations identify trends, patterns, and insights that can inform the change management process. This can help organizations make informed decisions, improve communication, and increase the efficiency of change management initiatives.
Change managers can use business intelligence to answer the following questions:
What insights can we gain from our data?
What trends and patterns are emerging from our data?
How can we use business intelligence to improve communication and collaboration among stakeholders?
How can we use business intelligence to increase the efficiency of change management initiatives?
Using Data Visualization
Data visualization is a valuable data science technique that involves presenting data in a visual format such as graphs, charts, and maps. Data visualization can help organizations communicate complex information more effectively and make it easier for stakeholders to understand the goals, objectives, and progress of change management initiatives. This can improve communication and increase stakeholder engagement in the change management process.
Change managers can use data visualization to answer the following questions:
How can we present our data in a way that is easy to understand?
How can we use data visualization to communicate progress and results to stakeholders?
How can we use data visualization to identify trends and patterns in our data?
How can we use data visualization to increase stakeholder engagement in the change management process?
Monitoring and Evaluating Progress
Monitoring and evaluating progress is a critical part of the change management process. Data science techniques, such as statistical analysis and data mining, can be used to monitor progress and evaluate the effectiveness of change management initiatives. This can help organizations identify areas for improvement, adjust the change management plan, and ensure that change management initiatives are achieving the desired outcomes.
Change managers can use monitoring and evaluation techniques to answer the following questions:
How can we measure the effectiveness of our change management initiatives? (e.g. employee engagement, customer satisfaction, business outcomes, etc.) And what method do we use to collect the data? E.g. surveys or focus groups?
What data do we need to collect to evaluate the change initiative progress?
How can we use statistical analysis and data mining to identify areas for improvement?
How can we use monitoring of ongoing support or continuous improvement?
The outlined approaches are some of the key ways in which we can use data science to manage the change process. Change practitioners should invest in their data science capability and adopt data science techniques to drive effective change management success. Stakeholders will take more notice of change management status and they may also better understand the value of managing change. Most importantly, data helps to achieve change objectives.