

A large services organisation ran a change readiness assessment before a major operating-model shift. The survey came back at 78% favourable. Leadership read it as a green light and pressed go. Eight months later the initiative was quietly behind on every adoption metric that mattered, and the post-implementation review reached for the usual explanation: the change was harder than expected, the culture was more resistant than the survey suggested. Neither explanation was true. The survey had measured what people felt about the change in the abstract. It had not measured whether the structural conditions for adoption were actually present. They were not, and that was knowable before the launch.
This is the central weakness of how most organisations approach change readiness assessment. The instrument is almost always a survey, and the survey almost always measures individual sentiment at a single point in time. Sentiment matters, but it is one of three dimensions of readiness, and it is the one least predictive of whether adoption actually lands. The dimensions that predict adoption most strongly, leadership alignment and systemic capacity, are precisely the ones a sentiment survey cannot see.
Readiness is worth measuring well, because it is one of the few leading indicators a change function has. Almost everything else is lagging: adoption rates, engagement scores, benefit realisation all tell you what already happened. Readiness, measured properly, tells you what is about to happen while you can still change it. The problem is not that organisations measure readiness. It is that they measure one third of it and treat the result as the whole.
What change readiness assessment actually predicts
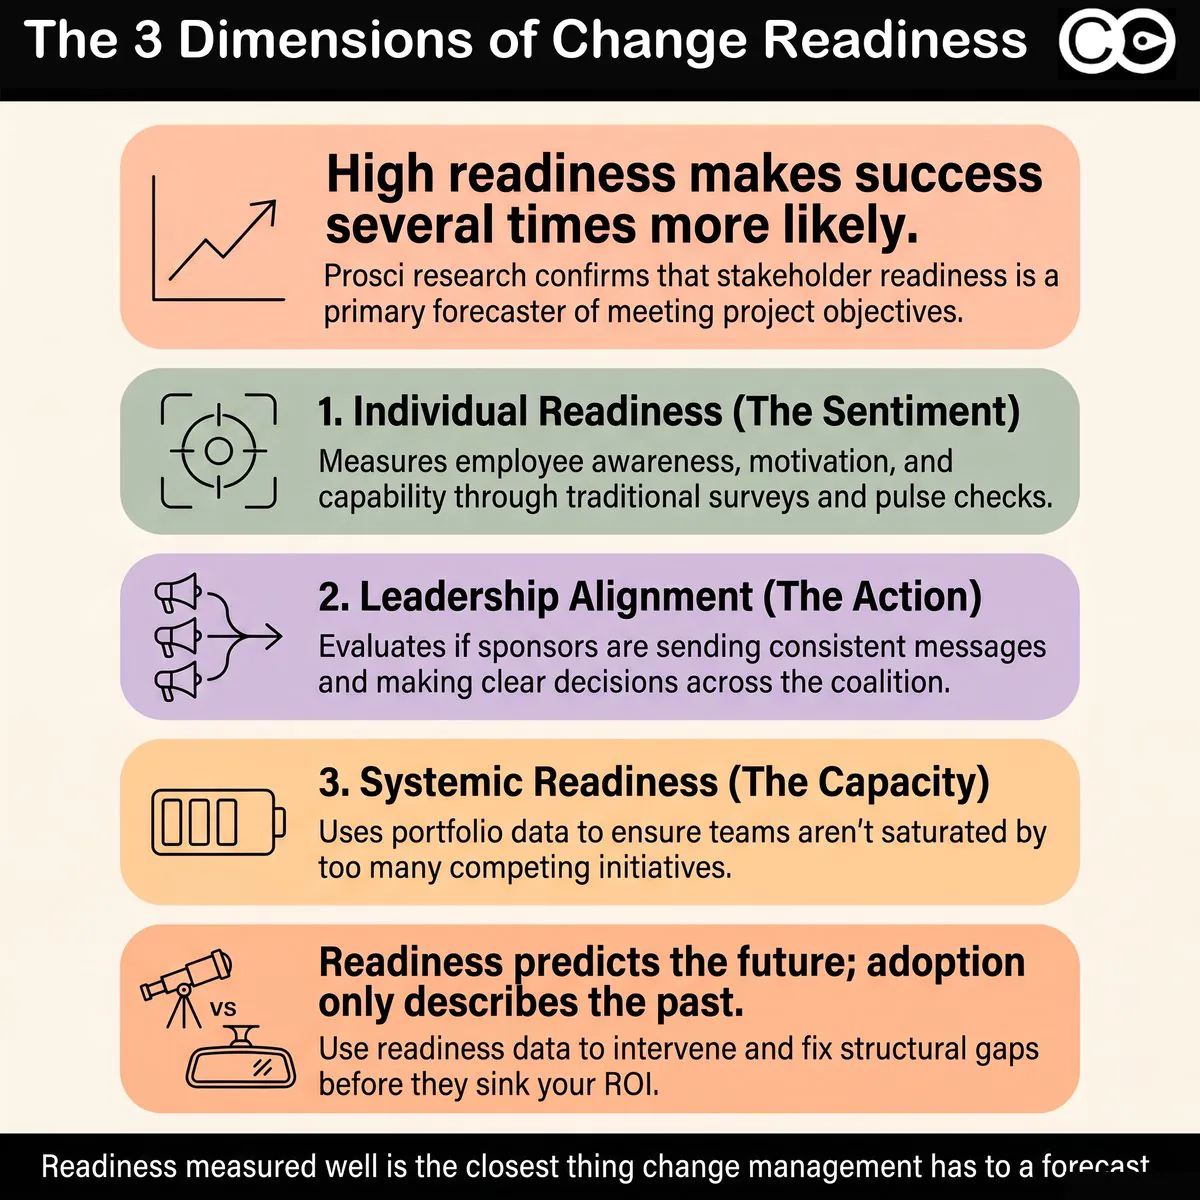
Change readiness assessment is the practice of evaluating, before and during a change, whether the conditions required for successful adoption are present. The reason it matters is that readiness is a genuine leading predictor of outcomes, not a feel-good exercise. Prosci’s research across more than 10,800 practitioners consistently finds that initiatives with strong change management and high stakeholder readiness are several times more likely to meet their objectives than those with poor readiness. The correlation is strong enough that readiness deserves to be treated as a forecasting instrument, not a box-ticking ritual.
But a predictor is only as good as the variables it captures. If your readiness assessment captures only individual sentiment, you have a model that predicts how people feel, which is weakly correlated with whether they will actually adopt the change when the structural conditions work against them. People can feel positive about a change and still fail to adopt it because their team is saturated, their manager has been given three contradictory priorities, or the supporting process and system changes have not landed. Conversely, people can feel anxious about a change and adopt it cleanly because leadership is aligned, capacity has been protected, and the path is clear.
Why readiness is a leading indicator, not a lagging one
Most change measurement happens too late to act on. Adoption curves, benefit realisation, and engagement dips all describe a state that already exists. Readiness is different. Measured before launch and tracked through delivery, it tells you whether you are heading for an adoption problem while there is still time to intervene. This is what makes readiness assessment strategically valuable: it converts change management from a reactive discipline into a predictive one. But that only works if the assessment measures the variables that actually move adoption.
This is also why readiness deserves a place in the business case, not just the change plan. McKinsey’s research on transformations found that even transformations rated successful capture only a fraction of their intended value, and a large share of that shortfall is set in motion early, before execution even begins, by conditions that a proper readiness assessment would have surfaced. The strategic point is that readiness is not a soft, people-side comfort metric. It is an early read on value at risk. When a senior leader treats a readiness assessment as optional, they are choosing to launch without a forecast of the one variable most within their control.
Where survey-only readiness breaks down
A sentiment survey asks people whether they understand the change, whether they support it, and whether they feel equipped for it. Those are reasonable questions. The problem is threefold. First, self-reported sentiment is a weak proxy for behaviour: people routinely report readiness and then fail to change, or report scepticism and then adopt smoothly. Second, a survey captures a moment, and readiness is dynamic, eroding as competing initiatives stack up. Third, and most importantly, a survey cannot see the systemic conditions that determine whether sentiment translates into adoption. A favourable survey in a saturated, misaligned environment is a false positive, and false positives in readiness assessment are expensive because they license launches that should have been delayed.
The three dimensions of change readiness
Readiness is not a single variable. It is a composite of three distinct dimensions, each requiring a different measurement approach. Treating readiness as one number, usually the survey score, collapses three different questions into one and loses the two that matter most.
Individual readiness
This is the dimension surveys capture well. Individual readiness covers awareness of the change, understanding of why it is happening, perceived capability to operate in the new way, and personal motivation to do so. It maps closely to the awareness and desire stages of established adoption models. Sentiment surveys, pulse checks, and focus groups are legitimate instruments here, and individual readiness is a real component of the picture. The error is not measuring it. The error is stopping there.
Leadership alignment
Leadership alignment is the degree to which the sponsors and managers connected to a change are saying and doing consistent things. It covers whether the sponsor coalition is visible and active, whether messages across leaders are coherent rather than contradictory, and whether decision authority is clear when trade-offs arise. Prosci’s data identifies active and visible executive sponsorship as the single largest contributor to change success, which means misalignment at the leadership level is one of the strongest predictors of failure. A sentiment survey of the affected workforce does not measure this at all. You measure leadership alignment by auditing what leaders actually say and decide, not by asking employees how they feel.
Leadership alignment is also the dimension most likely to be quietly assumed rather than checked. Change teams tend to take it on faith that the sponsors who approved the business case are aligned on execution, when in practice they are often aligned on the goal and divided on the path. The cost of that assumption is high, because misaligned sponsorship does not announce itself. It surfaces downstream as mixed manager messaging, stalled decisions, and a workforce that correctly reads the incoherence and waits to see which leader prevails before committing. Measuring alignment explicitly, early, is how you catch this while it is still cheap to fix.
Systemic and structural readiness
The third dimension is the one almost no readiness assessment captures, and it is frequently the most predictive. Systemic readiness asks whether the structural conditions for adoption exist: Is there spare capacity in the affected groups, or are they already saturated? Are competing initiatives drawing on the same people in the same window? Have the dependent process, system, and policy changes actually landed? Is the change being introduced into an environment that can absorb it? An individual can be entirely willing and still unable to adopt, because the system around them is not ready. This dimension is measured with portfolio and operational data, not with attitudinal questions.
Why surveys can only see one dimension
The reason surveys under-measure readiness is not that they are badly designed. It is that they are the wrong instrument for two of the three dimensions. A survey is an attitudinal instrument: it captures what people think and feel. That is exactly right for individual readiness and exactly wrong for leadership alignment and systemic readiness, which are structural conditions, not attitudes.
You cannot survey your way to an accurate picture of leadership alignment, because the people best placed to report misalignment, the affected employees, often cannot see the boardroom, and the leaders themselves are unlikely to self-report that they are contradicting each other. You measure alignment by reading the actual communications, decisions, and sponsor behaviours across initiatives.
You cannot survey your way to systemic readiness either, because employees experience their own load but rarely see the cumulative portfolio picture. An employee can tell you they feel busy. They cannot tell you that four initiatives are converging on their team in the same fortnight, because no single person in the organisation has that view unless the data has been deliberately aggregated. This is why systemic readiness has to be measured with structured impact and capacity data, the same data layer that supports stakeholder impact analysis across the portfolio.
How to build a multi-dimensional readiness picture
A credible change readiness assessment combines instruments rather than relying on one. The method is to measure each dimension with the tool suited to it, then integrate the three into a single readiness view. The following sequence works in practice.
- Measure individual readiness with targeted surveys and pulse checks. Keep them short, behavioural where possible, and repeated over time rather than run once. Track the trend, not just the snapshot.
- Assess leadership alignment through a structured sponsor and message audit. Review the communications, talking points, and stated priorities of every leader connected to the change. Flag contradictions in framing, pace, or priority. This is a qualitative review, scored against a consistent rubric.
- Quantify systemic readiness with portfolio and capacity data. Map the cumulative change load on each affected stakeholder group across a rolling window, identify competing initiatives, and check the readiness of dependent process and system changes. This draws directly on a defined change capacity model.
- Integrate the three into a single readiness profile per stakeholder group. Do not average them into one number that hides the weakest dimension. Show all three, because a group can be individually willing, well-sponsored, and structurally overloaded all at once, and the overload is what will sink adoption.
- Re-measure through delivery, not just before launch. Readiness erodes as conditions change. A group that was ready at planning can be saturated by go-live if the portfolio shifts underneath them.
The output is a readiness profile that shows, for each stakeholder group, where the gap is. That specificity is what makes the assessment actionable. “This group scored 65% on the readiness survey” tells you almost nothing you can act on. “This group is individually willing and well-sponsored but carrying 1.4 times its absorption ceiling across three concurrent initiatives” tells you exactly what to fix.
Consider how this plays out in practice. A retail bank assessing readiness for a new lending-origination platform surveyed its branch network and returned a healthy 74% favourable score. On a survey-only model, that is a launch. But when the same readiness question was answered across all three dimensions, a different picture emerged. Individual readiness was genuinely high: branch staff understood the change and wanted the new system. Leadership alignment, however, was weak, because the retail and risk functions were sending subtly different messages about what “good” looked like under the new process. And systemic readiness was poor, because the platform go-live fell in the same six-week window as a separate restructure and a compliance retraining push aimed at the same staff. The survey saw none of that. The multi-dimensional assessment saw all of it, and the launch was resequenced by five weeks. Adoption landed cleanly. The survey alone would have sent them into the worst possible window with full confidence.
The readiness and saturation link
There is a structural relationship between readiness and change saturation that survey-based assessment systematically misses. Organisations operating at or beyond saturation have structurally lower readiness regardless of what their sentiment surveys say, because the capacity required to absorb a new change has already been consumed by existing ones. A favourable readiness survey in a saturated environment is one of the most dangerous false positives in change management, because it gives leadership permission to launch into a workforce that has no room to absorb the change.
This is also where readiness and change fatigue intersect. Fatigue is the human residue of repeated change; saturation is the structural ceiling on how much more can be absorbed. Both depress readiness, and neither shows up reliably in a one-off survey, because people normalise their own overload and under-report it. The only way to see the saturation component of readiness is to measure cumulative load directly, at the stakeholder-group level, with portfolio data. When you do, you often find that the binding constraint on adoption is not attitude at all. It is that the system is full.
Five common mistakes in change readiness assessment
Readiness assessment fails in recognisable ways. The most common are:
- Equating readiness with the survey score. The survey measures one of three dimensions. Treating its result as the whole readiness picture systematically over-states readiness in saturated and misaligned environments.
- Measuring once, before launch. Readiness is dynamic. A single pre-launch assessment misses the erosion that happens as competing initiatives stack up between planning and go-live.
- Ignoring leadership alignment entirely. The dimension with the strongest link to success is the one most readiness assessments never measure, because it cannot be surveyed out of the affected workforce.
- Averaging the dimensions into one number. A blended score hides the weakest dimension. A group that is willing and sponsored but structurally overloaded will show as moderately ready, when in fact it is not ready at all.
- Treating low readiness as a communications problem. When readiness is low because of saturation or misalignment, more communication does not fix it. The fix is structural: resequencing, capacity protection, or sponsor realignment.
Required versus observed readiness
Readiness is only meaningful as a comparison: the level a phase of the change requires against the level you can observe, judged by a practitioner rather than self-reported by stakeholders.
Sponsors matter here more than any other single variable. In Prosci’s Best Practices in Change Management research, projects with extremely effective sponsors were 79% likely to meet their objectives, against 27% for extremely ineffective sponsors, and only 48% of participants reported having an effective sponsor.
Who determines readiness
Stakeholders play an important role but are not the sole authority. Their feedback has to be balanced with input from project teams, leadership and objective data. Think of a doctor and patient: the patient may feel well, while the trained physician sees symptoms that say otherwise. The patient needs to understand why and want the treatment, but the physician holds accountability for the diagnosis. A trained change practitioner is in the same position, forming an assessment from a range of evidence, and the sponsor then decides what to do about it.
Mapping required against observed
Run the comparison in four steps:
- Define required readiness for each phase. What outcomes must be true at this stage (awareness level, briefings in impacted business units, town halls, coaching)? What capabilities, processes and systems must be in place?
- Assess observed readiness. Use surveys, interviews and observation for qualitative data, and project reports, metrics and tool data for quantitative.
- Identify gaps and risks. Where does observed fall short of required, and what is the risk of proceeding with the gap?
- Develop a mitigation plan with stakeholders: adjust timelines, allocate resources, add leadership presence, or provide training and refreshers.
What a stage-gate comparison looks like
The comparison works best when required readiness is written down before the data arrives, so that the evidence cannot redefine the target. The table below shows the shape for a system implementation; adapt the rows to your own change.
| Stage gate | Required readiness | Observed evidence | Typical decision |
|---|---|---|---|
| Design complete | Impacted leaders briefed; process owners named | Briefing attendance; owner sign-off | Proceed, or hold until owners are named |
| Pre-training | Impacted teams have capacity for learning time | Concurrent initiative load; manager release of hours | Adjust training schedule to avoid peaks |
| Pre go-live | Staff can complete core tasks in the new system | Proficiency checks; training completion; test results | Delay or pilot if proficiency is below the agreed threshold |
| Post go-live | Leaders reinforce new practice; usage matches plan | System usage; operational reporting; leader behaviour | Targeted reinforcement where usage lags |
Agree the thresholds with the sponsor in advance. A gate with no agreed threshold turns every readiness conversation into a debate about opinion, which is exactly what the assessment was meant to avoid.
An example from healthcare
In a healthcare organisation moving to electronic medical records, required readiness covered leaders able to drive adoption across departments, staff proficient in the new system, and IT support ready for technical issues. Observed readiness showed gaps in staff proficiency and IT capacity. The organisation postponed the rollout to provide targeted training and add contract IT staff, avoiding disruption to patient care.
Turning readiness findings into decisions
A readiness assessment is only as valuable as the decisions it changes, and the decision should be one of three: proceed, adjust or delay.
Training is a common gap. In a 2025 Wiley survey of 1,685 North American employees, only 18% had received comprehensive change training, though 78% said it would be valuable.
Turning insight into action
- Engage stakeholders in the decision. Share findings with sponsors, project teams and impacted groups and agree priorities for closing gaps.
- Tailor interventions to critical gaps. Lists of desirable elements are long and resources are limited, so focus on the gaps that could derail the initiative.
- Monitor progress. Readiness is not static. Reassess to confirm interventions worked and that readiness is rising toward go-live.
A manufacturing company preparing a new product line used readiness outcomes this way. Plant managers received intensive coaching to align messaging and prepare for employee questions (leadership gap), the production process was piloted in one plant before wider rollout (process gap), and two weeks were added to testing to fix system bugs (technology gap). Each intervention matched a specific, evidenced gap.
Adapt the method to the change
Many practitioners follow a methodology rigidly even when it does not fit. Prosci’s research found that 59% of respondents using a formal methodology reported good or excellent change management effectiveness, against 26% without one, so structure helps, but it must serve the outcome. Start with the outcome you need, adapt to the size, complexity and culture of the organisation, and use digital tools to add real-time data. A technology company scaling an agile transformation first ran readiness surveys every six weeks. When regional resistance emerged, the change team moved to weekly check-ins and agile workshops tailored to each team, which suited the pace of the work better (see also our guide to agile change management without burnout).
How Change Compass measures readiness across all three dimensions
This is where a dedicated platform changes what is possible. Most organisations can run a sentiment survey, but few can connect that survey to the systemic data that determines whether the sentiment will translate into adoption. Change Compass integrates survey data with portfolio impact data, so individual readiness can be read alongside the cumulative load, conflict, and capacity picture for the same stakeholder group. The platform’s Surveys capability captures the individual dimension, while its portfolio views supply the systemic dimension: saturation scores, stakeholder impact aggregation, and capacity modelling. The result is a readiness picture that reflects both how people feel and whether the structural conditions for adoption are actually present. No survey tool working alone can produce this, because the systemic dimension lives in portfolio data that a survey instrument never touches.
Where to start
If you do one thing differently, stop treating the readiness survey as the readiness assessment. Pick your next significant change and measure all three dimensions deliberately: run the sentiment survey for individual readiness, audit the sponsor coalition and message consistency for leadership alignment, and map the cumulative load on the affected groups for systemic readiness. Put the three side by side rather than blending them. The first time you do this, you will almost certainly find a group that looks ready on the survey and is structurally not ready at all. That gap is the single most valuable output of a real change readiness assessment, because it is the adoption failure you can still prevent. Readiness measured well is the closest thing change management has to a forecast. It is worth measuring all of it.
Frequently asked questions
What is a change readiness assessment? A change readiness assessment evaluates whether the conditions required for successful adoption of a change are present, before and during delivery. Done well, it measures three dimensions: individual readiness (sentiment and capability), leadership alignment (sponsor and message consistency), and systemic readiness (capacity, saturation, and competing load). It is a leading indicator of adoption, which is what makes it strategically valuable.
How do you measure change readiness with data rather than surveys? Surveys measure individual sentiment, which is only one dimension. Leadership alignment is measured by auditing sponsor behaviour and message consistency against a rubric. Systemic readiness is measured with portfolio and capacity data: cumulative change load per stakeholder group, competing initiatives, and the readiness of dependent process and system changes. The full picture combines all three instruments rather than relying on the survey alone.
Why is change readiness a predictor of adoption? Readiness captures the conditions that determine whether a change will be absorbed: whether people understand and support it, whether leaders are aligned behind it, and whether the system has capacity to take it on. Because it is measured before adoption happens, it functions as a leading indicator, giving change teams the chance to intervene before an adoption problem becomes visible in lagging metrics.
What is the difference between change readiness and change saturation? Change readiness is whether the conditions for adopting a specific change are present. Change saturation is whether the workforce has any remaining capacity to absorb additional change at all. They are linked: organisations at or beyond saturation have structurally lower readiness regardless of survey scores, because the capacity needed to absorb the new change has already been consumed.
How often should you assess change readiness? Readiness should be assessed before launch and tracked through delivery, not measured once. It is dynamic and erodes as competing initiatives stack up, so a group that was ready at planning can be saturated by go-live. Continuous or repeated measurement, especially of the systemic dimension, catches that erosion while there is still time to act.
References
- Prosci, Change Management Best Practices: 12th Edition Findings
- Gartner, Employees Are Losing Patience With Change Initiatives
- McKinsey & Company, Losing from day one: Why even successful transformations fall short
- Visier / Workplace Intelligence, State of Organisational Change 2024
- The Change Compass, What is change saturation?
- The Change Compass, Change fatigue vs change saturation
- The Change Compass, Stakeholder impact analysis
- The Change Compass, How to build a change capacity model