Change saturation has become one of the most searched concepts in change management practice – and one of the most inconsistently understood. In its simplest definition, change saturation occurs when the cumulative demand of concurrent change programmes on a specific employee group exceeds that group’s adaptive capacity. The employees in question do not simply slow down in their adoption of any individual change. They enter a qualitatively different state in which their willingness and ability to engage with any further change demand is fundamentally reduced. This state – characterised by fatigue, cynicism, and disengagement – is what distinguishes change saturation from ordinary change challenge, and it is why measuring it accurately matters for how organisations manage their change portfolios.
The problem is that most organisations measure change saturation using subjective methods – asking managers or employees whether they feel “overloaded,” collecting anecdotal feedback in town halls, or relying on pulse survey questions that do not produce data comparable across teams or time periods. These approaches are better than nothing, but they produce results that are difficult to act on because they cannot be disaggregated by programme, by employee group, or by change type. They tell an organisation that saturation is a problem. They do not tell it where, why, or what to do about it.
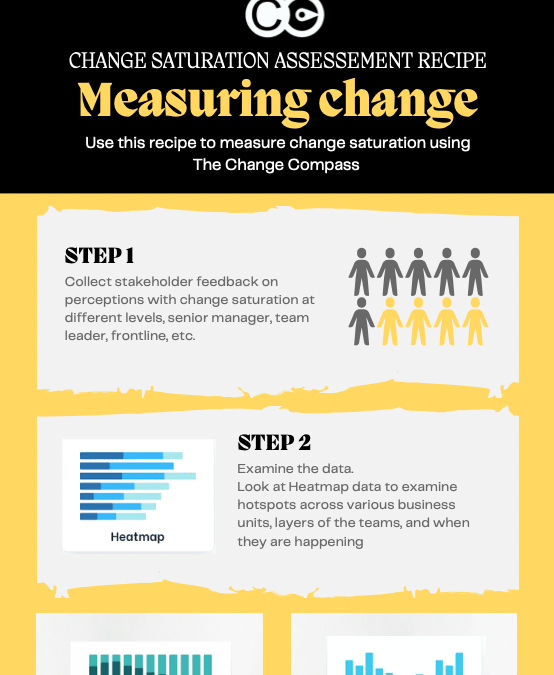
A more structured approach – a measurement recipe that produces actionable, comparable data – is what effective change saturation management requires. Download the Change Saturation Assessment Recipe for a step-by-step guide to measuring change saturation using The Change Compass.
Why personal opinion is an unreliable saturation measure
The instinct to measure change saturation through personal opinion – asking people whether they feel overwhelmed – has an obvious appeal. People experiencing saturation know it. Their self-report seems like direct access to the phenomenon being measured. The problem is that self-reported saturation is systematically biased in ways that make it unreliable for portfolio management decisions.
The first bias is social desirability. Employees who are experiencing genuine saturation may not report it accurately in formal measurement contexts if they believe reporting saturation will reflect negatively on their resilience or capability, or if they believe the organisation is not genuinely open to reducing the change load. In cultures where maintaining a positive front through adversity is valued, saturation is consistently underreported through self-report mechanisms.
The second bias is anchoring. Employees’ assessment of their saturation is relative to their recent experience. A team that has been operating at high saturation for an extended period may rate their current state as normal – because it is normal for them – even though it would be rated as high saturation by an objective measure. Conversely, a team that has recently experienced a significant increase in change load may rate themselves as highly saturated even if their objective load is within a manageable range, simply because the change from their recent baseline feels dramatic.
The third bias is aggregation. Even when individual self-reports are reasonably accurate, aggregating them across teams produces a misleading picture because the teams most likely to underreport saturation – those with the most competitive cultures, the most pressure to appear capable – are also those most likely to be genuinely saturated. The aggregate measure therefore understates saturation precisely where it is most severe.
The components of a structured saturation measurement approach
An effective change saturation measurement recipe builds the saturation assessment from objective components rather than deriving it from subjective opinion. The core components are: the volume of change programmes affecting a specific employee group, the intensity of those impacts (how much behavioural shift each change requires), the timing concentration of those impacts (how many significant changes are happening simultaneously versus sequenced), and a capacity baseline against which the aggregate load can be assessed.
Volume is the most commonly measured dimension – it is what heatmaps capture. But volume alone is insufficient, for the reasons described in change measurement literature. A single high-intensity change requiring employees to completely redesign their workflows is a fundamentally different saturation driver than five low-intensity changes requiring minor process adjustments. A measurement approach that counts changes without weighting them by intensity will misclassify teams’ saturation risk: overestimating the saturation of teams with many minor changes and underestimating it for teams with fewer but more transformative ones.
Prosci’s ADKAR model provides a useful framework for thinking about impact intensity – the degree to which a change requires employees to develop new knowledge, new capability, and new habitual behaviours, as distinct from simply being aware that something has changed. Changes that require new knowledge and capability development impose a substantially higher saturation load than those that require awareness and comprehension only. Structuring impact assessment around these ADKAR dimensions allows intensity to be captured in a way that reflects the actual cognitive and behavioural demand on employees.
Establishing capacity baselines and thresholds
Saturation is a relative concept – it describes the relationship between demand and capacity, not demand alone. Measuring demand without reference to capacity produces a number with no meaning. The second essential component of a structured saturation measurement recipe is a capacity baseline: an estimate of how much change demand a specific employee group can absorb sustainably over a defined period.
Capacity baselines can be established from multiple sources. Research-derived benchmarks – the published estimates of sustainable change load from organisations like Gartner and Prosci – provide starting points that can be calibrated to the specific context. Historical data – the correlation between past change load levels and subsequent adoption rates, attrition data, and engagement score movements – provides an empirical basis for establishing what level of change demand has historically been sustainable for specific employee groups in this organisation. And contextual factors – the current operational pressure on a team, their recent change history, their access to change support resources – adjust the baseline upward or downward based on factors the generic benchmarks do not capture.
Gartner research on change fatigue provides one of the most widely referenced frameworks for understanding capacity thresholds – specifically the finding that the average employee can effectively absorb a limited number of concurrent major changes before saturation occurs. Using this research as a calibration reference, combined with organisational-specific data, allows change leaders to establish saturation thresholds that are both research-grounded and contextually valid.
From measurement to actionable recommendations
The purpose of change saturation measurement is not to produce a number. It is to produce recommendations that stakeholders can act on. The measurement recipe therefore needs to specify not just how to assess saturation but how to translate the assessment into specific governance decisions and operational interventions.
At the governance level, saturation data should inform three types of decision: sequencing decisions (should this programme’s implementation be deferred because the affected teams are currently at or near their saturation threshold?), descoping decisions (can this programme be redesigned to reduce its saturation impact on the most overloaded employee groups without materially compromising its intended outcomes?), and resourcing decisions (does this programme require additional change support investment because the teams it is landing on have limited remaining adaptive capacity?).
At the programme level, saturation data should inform stakeholder engagement prioritisation (which teams need the most intensive support?), communication design (what communication approach is appropriate for teams in a high-saturation state versus those with ample capacity?), and the structure of transition support (what is the right blend of training, peer support, manager coaching, and post-go-live stabilisation for teams at different saturation levels?).
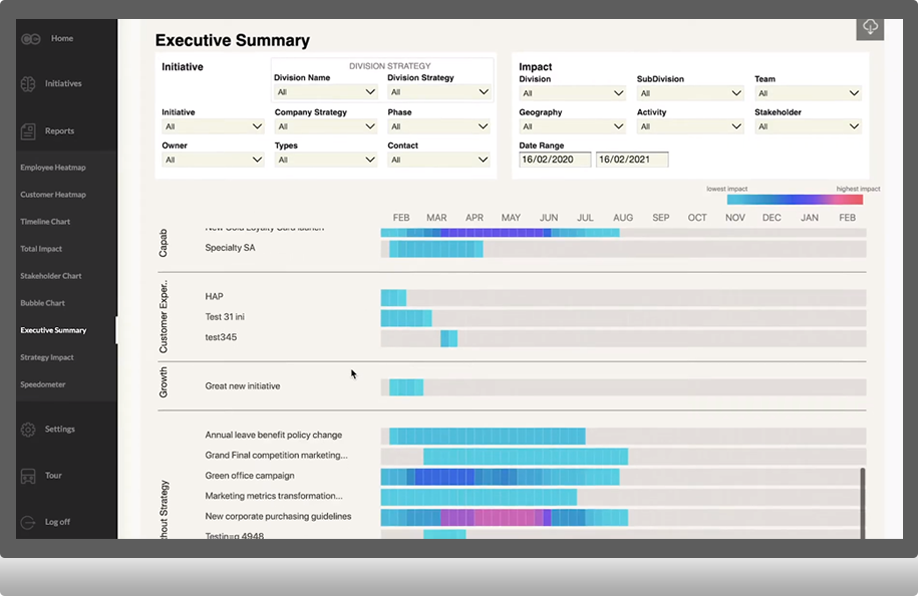
Platforms like The Change Compass support the full saturation measurement recipe by providing the data infrastructure – structured impact collection, portfolio aggregation by employee group, and visualisation of saturation against capacity thresholds – that makes this analysis operationally viable. Rather than assembling the measurement manually from programme-level spreadsheets, change leaders can access the saturation picture in real time and model the saturation implications of proposed portfolio decisions before committing to them.
Common mistakes in change saturation measurement
Several recurring errors undermine change saturation measurement efforts even in organisations that have invested in structured approaches. The first is measuring saturation at the wrong level of granularity. A division-level saturation score conceals the variation between teams within that division – a team experiencing extreme saturation may be averaged out by adjacent teams with much lighter loads, producing a comfortable aggregate that masks a genuine crisis at the team level. Effective saturation measurement requires the resolution to be at the team or role group level, not the business unit level.
The second mistake is measuring saturation at a single point in time rather than tracking it over a rolling period. A team that appears to be within its capacity threshold today may be accumulating load from changes that are about to peak simultaneously in the next quarter. Saturation measurement that shows only the current state rather than the projected trend line provides insufficient warning for the governance decisions that require lead time to implement.
The third mistake is treating the saturation assessment as separate from the portfolio governance process. Saturation data that is produced and then not connected to a decision-making process – where the data sits in a report that no governance body is empowered to act on – is not a management tool. It is a documentation exercise. McKinsey research on change programme failure consistently identifies the absence of in-flight decision authority as a primary cause of poor change outcomes – the data exists but no one has the authority or the process to act on what it shows. Connecting saturation measurement to governance structures with real authority to defer, descope, or resource programmes accordingly is what converts measurement from a reporting activity into a management capability.
Frequently asked questions
What is change saturation and how is it measured?
Change saturation occurs when the cumulative demand of concurrent change programmes on a specific employee group exceeds that group’s adaptive capacity. It is measured by combining three components: the volume of changes affecting the group, the intensity of those changes (the degree of behavioural shift each requires), and the timing concentration (how many significant changes overlap simultaneously). This demand measure is then compared against a capacity baseline to determine whether the group is operating within, at, or above its saturation threshold. Subjective self-report alone is insufficient as a saturation measure due to systematic biases in how saturation is perceived and reported.
How do you establish a capacity baseline for change saturation measurement?
Capacity baselines can be established from published research benchmarks (such as Gartner’s research on change fatigue and sustainable change load), from historical organisational data showing the relationship between past change load levels and adoption outcomes, and from contextual calibration factors such as the current operational pressure on the team, their recent change history, and their access to change support. The most reliable baselines combine all three sources, using the research as a starting point and calibrating it to the specific organisational context.
What decisions should change saturation data inform?
At the portfolio governance level, saturation data should inform decisions about programme sequencing (deferring changes to groups at or near saturation), descoping (reducing impact intensity for overloaded groups), and resourcing (allocating additional change support to high-saturation teams). At the programme level, it should inform stakeholder engagement prioritisation, communication design, and the structure of transition support. Saturation measurement that is not connected to a governance process with authority to act on its findings is a reporting activity rather than a management tool.
Why is team-level granularity important in change saturation measurement?
Business unit or division-level saturation scores conceal the variation between teams within those units. A team experiencing extreme saturation may be averaged out by adjacent teams with much lighter loads, producing an apparently comfortable aggregate score that masks a genuine crisis at the team level. Effective saturation measurement requires team or role group-level granularity to surface the concentrated saturation patterns that require targeted management responses and that business unit aggregates systematically obscure.
Measuring change is no longer a nice to have. It’s a must-have for a lot of organisations. A lot of stakeholders are now demanding to see and understand what is happening in the world of change. With the enhanced volume of change and therefore the increased investment made by the organisations, it’s no wonder.
Why are stakeholders demanding to see change data?
When we look across the room amongst the various disciplines, data forms an integral part of any function. Finance – tick. HR – tick, yes pretty much all aspects of people are tracked and reported. Operations – tick, as we have all types of performance KPIs and efficiency indicators. Technology – tick, since every part of technology can easily be measured and reported. Marketing – tick, as marketing outcomes are tied to revenue and customer sentiments.
With Covid it is even more the case that data is integral. We can no longer ‘walk the factory’ to sense what is happening. To see what is happening and what is going to happen stakeholders revert to data. In our virtual working environment, stakeholders require a constant dashboard of data to track how things are progressing.
Why is measuring change not an activity?
In the past it used to be that measuring change is only something you do in a project when you want to see if stakeholders are ready for the change. No more. Most organisations have a multitude of changes running concurrently. There is no choice to select 1 or 2 changes to roll out. With significant business challenges, most organisations are finding that running with multiple changes is the norm.
With multiple changes, increased stakeholder demands and appetite, measuring change is no longer just an activity. Measuring change takes a set of structured routines. It requires effective governance design. It takes experience and analytical expertise. Most of all, it is not a once-off event, it is a continual building of organisational muscle and capability. We are heading into the world of change analytics capability.
What is change analytics capability and how do I attain this?
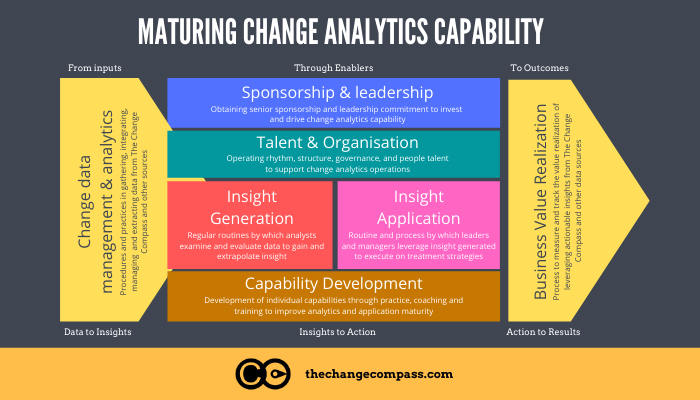
Here are 7 core components of building and maturing change analytics capability:
1. Establishing change data management procedures and practices
This is about setting up the right steps in place so that change data can be identified, collected, and documented. This includes identifying the types of change data you would like to collect and how to go about collecting them. It will be easier to start with the core set of data required and then build from these as needed. This will reduce the risk of overwhelming your stakeholders.
After the right metrics and collection channels have been identified then it’s about building the regular routines to collect and document the metrics.
2. Sponsorship and leadership of change analytics
To really reap the value of change analytics you will need to gain the blessing and sponsorship of your leaders. Well, at least in time. In the beginning, you may need some time to come up with compelling data that tell the story that you want them to before you show your leaders. Eventually, without strong leadership buy-in, change data will not be effectively leveraged to make business decisions.
Getting your leaders’ blessing isn’t just a verbal exercise. It means that they are signing-up to regularly review, discuss and utilise change data to realise business value.
3. Build talent and organisation to support change analytics
Think about the various stakeholders and what you need them to understand in terms of change data. The way you educate stakeholders will be different to how you educate operations managers or the PMO. Plot out how you plan to help them get familiar with change data. Do you need particular roles to support data analysis? Is it a Change Analyst who is focused on the regular upkeep and consolidation of change data? What roles do you need other team members to play?
4. Insight generation
With a full set of change data infront of you, it’s now time to dive into them to generate insights. What is the data telling you? How do they support other data sources to form a clear picture of what is happening in the workforce? Is the data accurate and updated? Generating insights from the data takes skills and experience. It takes the ability to integrate different sources of data outside of change data themselves.
5. Insight application
This is about setting up the right routines and processes so that any insights generated may be discussed and applied. It could be through various governance forums, leadership or planning meetings that insights are shared and socialised. An integral part of this step is applying the insight by making business decisions. For example, do we delay the initiative roll out or invest more to support leaders? Are there reasons for us to speed up roll out to support the workforce?
6. Change analytics capability development
Change analytics is a capability.
With good change data emerging, you also need to have the right people with the right skills to collect, process and interpret the data. You may also want to think about which teams need what analytical skills. Do you have people in the team who are sufficiently analytical and data-oriented? Do they know how to interpret the data to form trends and predictions?
You may want to think about organising capability sessions or training to strengthen data analysis skills. Are there members in the different governance bodies that need support to be more confident in using change data?
7. Realising business value through change analytics
The last part of the equation is realising business value through change analytics. This is about tracking and documenting the value realised through using change analytics. It could include incidents where the business decision made has lead to significant risk reduction or operations protection. It could be enhanced leadership confidence mitigating risks in negative customer experience. Tracking value generated is critical to make clear to stakeholders the value of the overall investment.
If you found this article useful please share.
Do you have questions on measuring change for your organisation? Ping us on our chat.
A 2025 Gartner report found that fewer than 25% of organisations have moved beyond basic reporting when it comes to their change management data. Most change teams still rely on spreadsheets, survey snapshots, and anecdotal updates to communicate progress. Yet the same organisations invest heavily in analytics for marketing, finance, and operations. The gap is striking, and it is costing organisations real money in failed adoption, duplicated effort, and invisible change saturation.
Building a genuine change analytics capability is not about buying a dashboard tool and hoping people use it. It is about developing the people, processes, and data foundations that allow your change function to move from reactive reporting to predictive insight. This guide walks through a practical, stage-by-stage approach to building that capability, drawn from patterns observed across enterprise change teams in financial services, government, and large-scale technology transformations.
Why most change teams stall at the reporting stage
There is a critical difference between reporting and analytics, and most change functions confuse the two. Reporting tells you what happened: how many people attended the training, how many communications were sent, what the survey scores were. Analytics tells you what it means: which teams are at risk of adoption failure, where change saturation is building to dangerous levels, and which initiatives are competing for the same audience at the same time.
The reason most teams stall is structural, not technical. They lack three things simultaneously:
A data model that connects change activities to business outcomes rather than tracking them in isolation
An analytical mindset in the team, where practitioners ask “what does this pattern mean?” rather than “what number do the stakeholders want to see?”
A governance structure that makes data collection systematic rather than project-by-project
Until all three are in place, even sophisticated tools produce shallow outputs. A heat map without a data model behind it is just a coloured spreadsheet. A survey without an analytical framework is just a snapshot that tells you nothing about trajectory.
The four stages of change analytics maturity
Based on work across dozens of enterprise change functions, a clear maturity progression emerges. Understanding where your organisation sits on this continuum is the first step toward building capability intentionally rather than haphazardly.
Stage 1: Ad hoc reporting
At this stage, each project or initiative tracks its own metrics in its own way. There is no consistency in what gets measured, how it is collected, or how it is reported. Change managers produce PowerPoint slides with status updates, traffic-light ratings, and anecdotal commentary. The data is retrospective and rarely influences decisions.
You know you are here if your change reporting could be summarised as “things are on track” or “things are at risk” with little quantitative evidence behind either statement.
Stage 2: Standardised measurement
The team has agreed on a common set of metrics and a consistent approach to collecting them. This might include standardised impact assessments, consistent survey instruments, or a shared taxonomy for categorising change types. Data is still largely backward-looking, but it is now comparable across initiatives.
The hallmark of this stage is the ability to answer: “How does initiative A compare to initiative B in terms of employee impact?” If you cannot answer that question with data, you are still in Stage 1.
Stage 3: Integrated analytics
At this stage, change data is connected to other enterprise data sources. You can overlay change impact data with HR data (attrition, engagement scores, absenteeism), project data (timelines, milestones, budget), and operational data (productivity metrics, error rates, customer satisfaction). This is where the real analytical power begins.
A 2023 McKinsey analysis of organisational performance found that companies integrating people analytics with operational data were 2.5 times more likely to outperform peers on financial metrics. The same principle applies to change analytics: integration is what turns reporting into insight.
Stage 4: Predictive and prescriptive capability
The most mature change functions use their data not just to explain what happened, but to predict what will happen. They can model the likely impact of adding a new initiative to an already saturated portfolio. They can identify which business units are approaching adoption fatigue before it manifests in survey scores. They can quantify the productivity cost of overlapping go-lives and present scenario-based alternatives to the portfolio steering committee.
Reaching Stage 4 typically requires 18 to 24 months of sustained investment in data infrastructure, team capability, and stakeholder education. But even partial progress from Stage 1 to Stage 2 delivers measurable improvements in decision quality.
Building the foundation: your change data model
Before investing in tools or training, you need a data model that defines what you will measure, how entities relate to each other, and what questions the data should answer. A robust change data model typically includes five core entities:
Initiatives: the programmes, projects, and BAU changes flowing through the organisation, with attributes for type, size, timing, and strategic alignment
Impacts: the specific changes each initiative imposes on people, categorised by type (process, technology, role, policy, behaviour), intensity, and timing
Audiences: the teams, business units, roles, and locations affected by each impact, with enough granularity to identify overlap and accumulation
Interventions: the change activities delivered (training, communications, coaching, support), linked to specific impacts and audiences
Outcomes: adoption metrics, readiness scores, business performance indicators, and qualitative feedback that track whether the change is landing
The relationships between these entities are what make the model powerful. When you can trace a line from a strategic initiative through its individual impacts to the specific teams affected, and then through the interventions delivered to the adoption outcomes achieved, you have a data model capable of supporting real analytics.
Most organisations attempt to build this model in spreadsheets, which works at small scale but collapses under the weight of a real enterprise portfolio. A Prosci study on organisational change capability identified that teams using purpose-built change management platforms were significantly more likely to sustain their analytics capability over time compared to those relying on generic tools.
Developing analytical skills in your change team
A data model without people who can interpret it is useless. And here is the uncomfortable truth: most change practitioners were not trained in data analysis. Their backgrounds are in communications, psychology, HR, or project management. Asking them to suddenly think in terms of correlation, trend analysis, and statistical significance is unrealistic without deliberate investment.
The good news is that you do not need data scientists. You need practitioners who develop what might be called “analytical fluency”: the ability to look at change data and ask the right questions, spot meaningful patterns, and translate findings into stakeholder language.
Practical steps to build this fluency include:
Data storytelling workshops: Teach the team to construct narratives from data rather than presenting raw numbers. A chart showing change saturation by business unit is data. A narrative explaining why the operations team is at risk of adoption failure because three major initiatives overlap in Q3, and what to do about it, is insight.
Paired analysis sessions: Pair a change practitioner with someone from the data or business intelligence team for regular analysis sessions. The change practitioner brings domain knowledge; the analyst brings technical skill. Over time, both learn from each other.
Hypothesis-driven reviews: Replace status update meetings with hypothesis-driven discussions. Instead of “here is what happened this month,” start with “we hypothesised that the new process rollout would see higher adoption in teams with dedicated change champions. Here is what the data shows.”
Benchmark libraries: Build an internal library of benchmarks from past initiatives. How long does adoption typically take for a technology change versus a process change? What survey scores at the three-month mark predict successful adoption at twelve months? These benchmarks become the foundation for predictive capability.
A 2024 HR Grapevine analysis on people analytics maturity found that the biggest barrier to analytics adoption was not technology but the gap between available data and the ability of HR and change professionals to use it meaningfully. Investing in skill development pays off faster than investing in tools.
Embedding change analytics into governance and decision-making
The final, and often most difficult, step is making sure that change analytics actually influences decisions. Too many organisations build the capability, produce the reports, and then watch as steering committees ignore the data and make politically driven decisions anyway.
Embedding analytics into governance requires three structural changes:
First, change data must be a standing agenda item in portfolio governance meetings. Not an optional appendix, not an “if we have time” discussion, but a required input to every major decision about initiative timing, sequencing, and resourcing. When the portfolio steering committee debates whether to bring forward a new initiative, the change analytics view of current saturation, team capacity, and cumulative impact should be presented alongside the financial business case.
Second, define trigger thresholds that mandate action. Establish clear thresholds: if change saturation in a business unit exceeds a defined level, new initiatives targeting that unit require additional justification and mitigation plans. If adoption metrics fall below a target at a defined milestone, the initiative enters a remediation process. These triggers take analytics out of the advisory space and into the operational space.
Third, report outcomes, not just activities. Senior leaders quickly tune out reports about how many training sessions were delivered or how many communications were sent. They engage when you show them the relationship between change interventions and business outcomes: the correlation between structured change support and faster time-to-competency, or the measurable productivity impact of overlapping go-lives on frontline teams.
According to Gartner’s 2026 change management trends report, organisations that embed data-driven decision-making into their change governance frameworks see 40% higher success rates in complex transformation programmes compared to those relying on qualitative assessment alone.
How digital change tools accelerate analytics capability
Building a change analytics capability does not require starting from scratch. Purpose-built digital change management platforms like The Change Compass provide the data model, collection mechanisms, and visualisation layers that would take months to build manually. They standardise how impacts are assessed, connect initiatives to affected audiences, and generate portfolio-level views that make saturation and overlap immediately visible. For teams moving from Stage 1 to Stage 2, a dedicated platform can compress the journey from years to months by removing the infrastructure burden and letting the team focus on developing their analytical skills.
Where to start this week
If you are reading this and recognising your organisation in Stage 1, here is a practical starting point. Do not try to build everything at once. Pick one initiative currently in flight and apply a structured approach: map its impacts by audience, measure adoption using consistent criteria, and present the findings as a narrative to your steering committee. Use that single case to demonstrate the difference between reporting and analytics. Once stakeholders see what is possible, the conversation about investing in broader capability becomes much easier.
The organisations that build genuine change analytics capability do not do it by accident. They invest deliberately in data models, in their people’s analytical skills, and in governance structures that make data a required input to decisions. The payoff is a change function that can see around corners, anticipate problems before they escalate, and demonstrate its value in the language that senior leaders actually care about: business outcomes.
Frequently asked questions
What is change analytics capability?
Change analytics capability is an organisation’s ability to systematically collect, analyse, and act on data related to change initiatives. It goes beyond basic reporting to include trend analysis, predictive modelling, and data-driven decision-making about how change is planned, sequenced, and delivered across the enterprise.
How long does it take to build change analytics capability?
Moving from ad hoc reporting to standardised measurement typically takes three to six months with focused effort. Reaching integrated analytics, where change data connects to HR and operational data, usually requires 12 to 18 months. Full predictive capability can take two years or more, depending on data infrastructure and team skill levels.
Do I need a data scientist on my change team?
Not necessarily. What you need is analytical fluency: the ability to interpret data patterns, construct hypotheses, and translate findings into actionable recommendations. Pairing change practitioners with existing business intelligence or data teams is often more effective than hiring dedicated data scientists into the change function.
What tools do I need for change analytics?
The most important tool is a consistent data model, not software. That said, purpose-built change management platforms significantly reduce the effort required to collect, structure, and visualise change data. Generic tools like spreadsheets work at small scale but become unmanageable for enterprise portfolios with dozens of concurrent initiatives.
How do I convince senior leaders to invest in change analytics?
Start with a single compelling example. Take one initiative where you can show the relationship between change data and a business outcome, such as how structured adoption support reduced time-to-competency by a measurable amount, or how overlapping go-lives correlated with a spike in customer complaints. One concrete case study is more persuasive than any slide deck about the theoretical value of analytics.
Change Management outcome is the holy grail, and virtually all organisations are undergoing change. Now more than ever, companies are challenged with multiple layers of driving change simultaneously. What is applicable in this situation is not about a particular methodology of implementing a change program. It is all about implementing simultaneous changes, at the same time. There is no luxury of just focusing on one change at a time, the result of competitive, industry, and environmental challenges.
As change practitioners we work closely with our colleagues in Operations to get ready for, implement, and fully embed changes. So how do our colleagues in operations view and manage change initiatives?
Operations as a function is focused on managing performance and delivery to ensure that the business runs smoothly, with little disruptions, and that performance measures are achieved. Operations is focused on resource management, efficiency, and achieving the various operational indicators whether it’s customer satisfaction, turn-around time, average handling time, or cost target.
When times are hectic and a lot is going on with multiple change initiatives, the key focus for Operations is on managing people’s capacity. Key questions would be “Do we have sufficient time to cater for the various changes?”, and “Will we exceed our change saturation level?”. This is a critical question to answer since the business still needs to run and deliver services without negative change disruptions.
From an Operations planning perspective ‘change capacity‘ is often reduced to the time element, especially those impacting frontline staff.
For example:
What are the times required to reschedule the call centre consultants off the phone to attend training?
How much time is required in the team meeting agenda to outline the changes that are being rolled out?
What is the time involvement of change champions?
Though these are all critical questions clear answers will help Operations plan better to face multiple changes. However, this is not adequate. There is more to planning for multiple changes than just focusing on the time element.
Using the lego analogy to manage multiple changes
We all know LEGO as kids. To build a car we start one brick at a time and see how we go. We experiment with different colours, shapes, and sizes. We make do with the bricks we have and use our imagination to come up with what a car would look like. Sometimes we get stuck and we may need to tweak our bricks a little, or sometimes start from scratch.
It is the same as implementing change initiatives. In order to take people along the journey, we implement a series of activities and interventions so that our impacted stakeholders are aware, ready, committed, and embed the change. The design on the change journey is the process of determining what LEGO bricks to choose. There is no shortcut. It is not possible to build a building without each necessary brick to raise the building up. In implementing change, we also need to lay out each step in engaging our stakeholders.
McKinsey studies over decades have told us that one of the most critical factors to focus on in ensuring change outcome success is clear organisation-wide ownership and commitment to change across all levels. This means that when we design each change brick we need to ensure we target every level of impacted stakeholders.
For example:
Team Leaders: How often do we want Team Leaders to talk about the changes to their teams before the rollout? What content do we want them to use? Do they know how to translate the message in a way that resonates? Do we want them to tell compelling stories that talk to the what, why, and how of the change?
Managers: How are managers made accountable? What metrics are they accountable for? What mediums do we want them to use to engage their teams? What are the consequences of not achieving the outcomes?
Senior Managers: Through what mediums do we expect senior managers to engage their teams about the changes? How do we ensure that they are personally accountable for the success of the change? How are they involved to ensure they own the change?
Looking at the above you can see that for complex change there may need to be a lot of bricks in place to ensure the change outcome is successful!
Going back to the issue of facing into multiple changes, how do we play around with the bricks to ensure that multiple changes are successful? The same way that we play with LEGO bricks!
Look at the colours of the bricks. Do certain colours belong together? When we look across different initiatives, are there similar or common behaviours that can be better linked together to tell a compelling story? Do they support the same strategy? Can there be a joint campaign for these changes?
Is the overall LEGO structure going to be intact? What are the impacts of the various changes happening at the same time in terms of focus, performance and change outcome? Have we exceeded the likely ‘mental capacity’ for people to stay focused on a core set of changes at any one time? Will the pieced-together structure collapse due to having too many elements?
Look at the sizes of the LEGO structures. During implementation when we have both larger and smaller initiatives being executed at the same time, will the larger ones overshadow the smaller ones? If so what are the risks if any?
Re-jig or re-build parts of the LEGO structure as needed to see what it looks like. In a situation where we want to see what the changes look like before we action it, it makes sense to visualise what would happen if we move timelines or change implementation tactics
Example of data visualisation of ‘re-jigging’ change implementation timeline with The Change Compass using different scenarios.
Just like in building LEGO, for change initiatives we need to be agile and be flexible enough to play with and visualise what the change outcome could look like before pulling the trigger. We also need to be able to tweak as we go and adjust our change approaches as needed. In facing the multitude of changes that the organisation needs to be successful, we also need to be able to play with different implementation scenarios to picture how things will look like. Each brick needs to be carefully laid to reach the overall outcome.
Careful consideration also needs to be how all the bricks connect together – the analogy that the change outcomes across initiatives can be determined by how we’ve pieced together various pieces of LEGO for them to make sense, and result in the ownership and commitment of stakeholders.
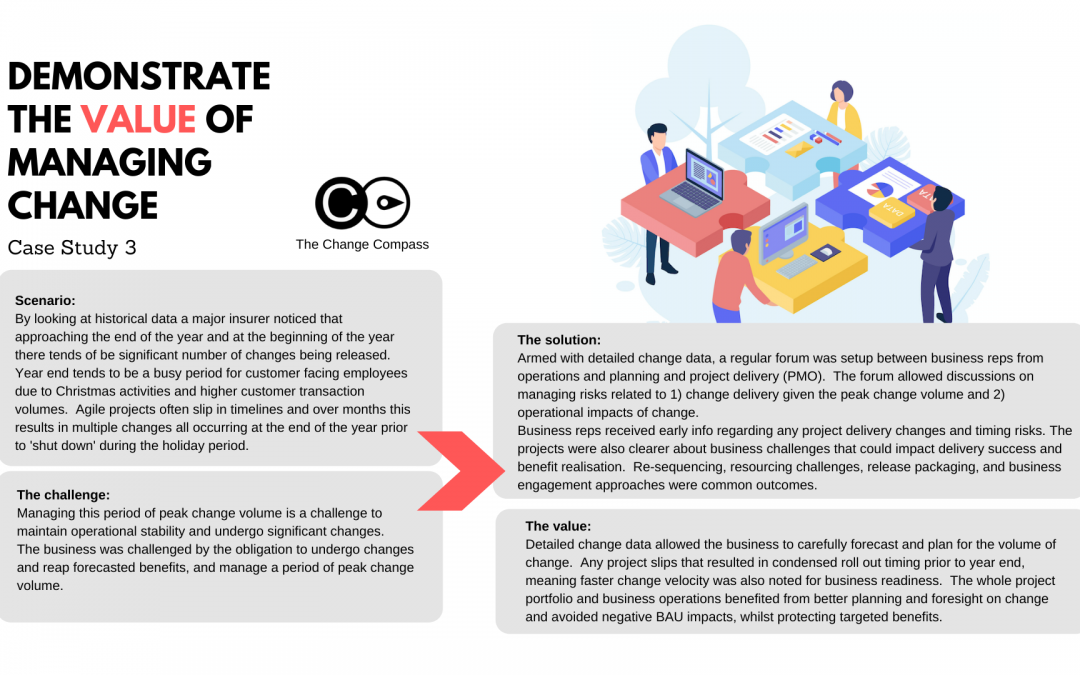
Turning change chaos into competitive advantage: How a leading insurer mastered peak change with The Change Compass
In today’s fast-paced business environment, change is the only constant – especially in highly regulated, customer-facing sectors like insurance. But what if, instead of being a source of risk, organisational change could become your greatest lever for business performance? That’s the journey one major insurer embarked on, and the results are a blueprint for transformation-driven success.
The perfect storm: Why peak change periods are so challenging
Every year, as the calendar ticks towards the December-January holiday season, this insurer encountered a familiar scenario:
Customer-facing employees were under pressure, fielding increased transactions and supporting customers through holidays.
Multiple agile projects, each designed to drive innovation and process improvement, were slipping in timelines – as often happens in complex transformation portfolios.
The result? A flood of change “went live” simultaneously just before the company-wide shutdown.
For business leaders, this created a daunting balancing act: realising the benefits of innovation, while not overwhelming frontline teams or sacrificing operational stability. Missed deadlines or last-minute rollouts could lead to service disruptions, employee burnout, lost revenue, and eroded customer trust.
The breakthrough: Data-powered collaboration
So how did this insurer escape the costly cycle of end-of-year chaos? With The Change Compass, they turned data into their superpower.
The organisation established a regular, cross-functional forum that brought together operations, planning, and project delivery (PMO). But this wasn’t just another meeting – this was a command centre built around live, detailed change data.
Key transformations in approach:
Shared Early Warning System:
Project delays, resource bottlenecks, and clustered change activity were visible weeks or months in advance, not discovered at the last minute.
Intelligent Risk Management:
The team could scenario-plan, not just react, to delivery risks and operational pinch points.
Business-Driven Dialogue:
Operations leaders voiced customer realities and BAU needs, shaping project timelines for true business readiness.
Real-world results: From fire-fighting to future-proofing
Thanks to this new level of insight and collaboration, the insurer fundamentally changed how it managed periods of peak change. Here’s what set them apart:
1. Proactive Forecasting and Portfolio Planning
The company moved from “gut feel” to data-backed change forecasts, mapping exactly when and where change would impact operations.
No more scrambling: resource plans, communications, and business readiness activities were optimised for actual risks and opportunities.
2. Collaborative Course Correction
Instead of viewing project slippage as a crisis, the PMO could re-sequence initiatives, redesign release packages, or reallocate teams before risks materialised.
The forum fostered joint problem-solving – turning silos into a unified change-fighting force.
3. Protecting Business Value
With fewer surprises and less disruption, business units delivered on promised benefits even during high-change windows.
Change velocity was matched by business readiness, preserving customer experience and employee morale – even during intense periods.
Key value metrics achieved
Savings from BAU cost spike of $1+Mil per annum from change peak periods
Protection from productivity dips of 30-45% from change disruptions
Prevention of customer churn of $1+Mil per annum from frontline operations disruptions
Additional 30-50% gain in change benefits realised through well-coordinated portfolio deployment
Why this matters: Making change your strategic weapon
The lesson is clear: Change doesn’t have to feel risky, unpredictable, or exhausting. With The Change Compass:
You gain clarity – see the full picture of what’s changing, when, and how it affects your people and customers.
You empower teams – from PMO to frontline operations, everyone acts with foresight and confidence, not crisis mode.
You realise more value – initiatives deliver lasting outcomes, not headaches or half-finished results.
This is more than a software platform – it’s a new operating model for change-centric businesses.
Going Beyond “Surviving Change” to Leading Your Market
Imagine if your organisation could:
Anticipate and neutralise risks long before they disrupt business
Execute more strategic projects, faster – without burning out staff or diluting customer experience
Align every level of the business around a shared, data-driven roadmap for change
That’s what The Change Compass unlocks. It’s already helping leading insurers and other organisations turn the “messiness” of change into disciplined, high-impact action – and giving them a real edge on competitors still stuck in fire-fighting mode.
Ready to step into change leadership using data?
If you’re tired of peak periods bringing more anxiety than opportunity, it’s time to see what’s possible when you combine collaboration, smart forums, and powerful change analytics.
Try The Change Compass and:
Put yourself in the driver’s seat for every change, no matter how complex.
Rally your teams around a data-powered playbook for business performance.
Experience smoother, smarter transformation—365 days a year.
Don’t just survive the next wave of change – lead it with data-backed confidence, outperform your industry, and empower your teams. The Change Compass is ready to help you turn every challenge into achievement.