Every change management team can describe what they did. Very few can demonstrate what difference it made. This measurement gap is not just an inconvenience; it is the single biggest reason change management struggles to secure resources, retain executive attention, and prove its value as a strategic function.
The data makes the case unequivocally. Prosci’s benchmarking research across 2,600 practitioners found that 88% of projects with excellent change management met or exceeded their objectives, compared to just 13% with poor change management. Gartner’s 2025 research found that organisations achieving healthy change adoption report two times higher year-over-year revenue growth. The correlation between effective change management and business performance is not in question. What is in question is whether your organisation can measure it.
This guide provides a practical framework for measuring change management success, from selecting the right KPIs to designing dashboards that influence executive decisions.
The measurement problem: activities versus outcomes
The most common mistake in measuring change management success is confusing activity with impact. Counting the number of communications sent, training sessions delivered, or stakeholder meetings held tells you nothing about whether anyone changed their behaviour. Yet these activity metrics dominate most change management reports.
Why activity metrics persist
Activity metrics are easy to collect, which is precisely why teams default to them. They also feel productive to report. But they create a dangerous illusion: a team that has delivered 40 training sessions and sent 200 communications can appear highly effective while the change itself is failing.
The shift to outcome measurement
Measuring change management success requires tracking what actually changed as a result of your interventions, not just what interventions you delivered. This means measuring whether people are using new systems, following new processes, demonstrating new behaviours, and whether those behavioural changes are producing the business outcomes the initiative was designed to achieve.
Prosci’s research on change management metrics reinforces this point: of organisations that measured compliance and overall performance, 76% met or exceeded project objectives. Among those that did not measure, only 24% achieved the same result.
A three-tier metrics framework for change management success
Effective measurement organises metrics into three tiers, each serving a different purpose and measured at a different point in the change lifecycle.
Tier 1: Leading indicators (pre-change and early implementation)
Leading indicators tell you whether the conditions for successful adoption are being established. They are predictive: if leading indicators are weak, adoption will almost certainly fall short.
Key leading indicators include:
Awareness levels: Percentage of affected stakeholders who can articulate what is changing and why
Sponsor engagement score: Frequency and quality of visible sponsorship behaviours (rated by direct reports, not self-assessed)
Readiness assessment results: Composite scores from structured readiness evaluations across impacted groups
Training effectiveness: Post-training knowledge assessment scores (not just completion rates)
Sentiment indicators: Employee pulse survey results on confidence, concern levels, and perceived support
Tier 2: Adoption indicators (during and post-implementation)
Adoption indicators measure whether the target population is actually using, following, or demonstrating what the change requires. This is where most measurement programmes either succeed or fail.
Key adoption indicators include:
System usage rates: Login frequency, feature utilisation, and transaction volumes in new systems
Process compliance: Percentage of transactions following the new process versus the old one
Behavioural observation data: Manager-reported or peer-reported evidence of new behaviours in practice
Error and rework rates: Declining error rates indicate proficiency is building; stable or rising rates indicate adoption gaps
Support ticket trends: Decreasing support requests over time suggest growing self-sufficiency
Impact indicators connect change adoption to the business outcomes the initiative was designed to deliver. This is where change management proves its strategic value.
Key impact indicators include:
Business outcome metrics: Revenue, cost savings, productivity gains, or customer satisfaction improvements attributable to the change
Sustained adoption rates: Usage and compliance levels 90 and 180 days post-implementation (not just at go-live)
Employee experience scores: Engagement, wellbeing, and voluntary turnover in heavily impacted groups
Speed to proficiency: Time from go-live to target performance levels
Return on change investment: Ratio of realised benefits to total change management investment
Leading versus lagging indicators: a comparison
Understanding the distinction between leading and lagging indicators is essential for designing a measurement approach that is both predictive and evaluative.
| Dimension | Leading indicators | Lagging indicators | |———–|——————-|——————-| | Timing | Measured before and during change | Measured after implementation | | Purpose | Predict likelihood of success | Confirm whether success occurred | | Action value | High, can course-correct in real time | Lower, confirms outcomes retrospectively | | Examples | Awareness scores, sponsor engagement, training effectiveness | Adoption rates, business outcomes, ROI | | Risk if ignored | You discover problems too late to fix them | You cannot prove value to stakeholders | | Data sources | Surveys, assessments, observations | System data, financial reports, performance metrics |
The most effective measurement programmes balance both: leading indicators to steer decisions during implementation, and lagging indicators to demonstrate value after the fact. For a deeper exploration of measurement methodology, see our ultimate guide to measuring change management outcomes.
Seven KPIs every change management team should track
While the specific metrics will vary by initiative, these seven KPIs provide a solid foundation for measuring change management success across most organisational changes.
1. Stakeholder awareness rate
Definition: Percentage of impacted stakeholders who can correctly describe what is changing, why, and how it affects their role. How to measure: Short pulse surveys (3-5 questions) administered at key milestones. Target: 80%+ awareness before go-live.
2. Active sponsor engagement score
Definition: A composite score measuring the frequency and visibility of sponsor behaviours, including communication, participation in change events, and removal of barriers. How to measure: Monthly assessment by the change team using a standardised rubric, validated by team feedback. Target: 7/10 or above on a standardised scale.
3. Training proficiency rate
Definition: Percentage of trained users who demonstrate competency in post-training assessments (not just attendance). How to measure: Knowledge checks, simulations, or practical demonstrations administered after training. Target: 85%+ pass rate on proficiency assessments.
4. Adoption rate
Definition: Percentage of the target population actively using the new system, process, or behaviour as designed. How to measure: System analytics, process audits, or structured observations. Target: 70%+ within 30 days of go-live, 90%+ within 90 days.
5. Time to proficiency
Definition: Average number of days from go-live until users reach target performance levels. How to measure: Track performance metrics (speed, accuracy, volume) from go-live and identify when they reach pre-defined thresholds. Target: Varies by change complexity; benchmark against organisational norms.
6. Change saturation index
Definition: Number of concurrent changes impacting each stakeholder group, weighted by degree of disruption. How to measure: Portfolio-level change impact assessment mapping all initiatives against affected groups. Target: No group exceeds 2-3 significant concurrent changes.
7. Benefit realisation rate
Definition: Percentage of projected business benefits actually realised within the defined timeframe. How to measure: Compare actual business outcomes against the benefits case approved at project initiation. Target: 80%+ of projected benefits realised within 12 months.
Common measurement traps to avoid
Even well-intentioned measurement programmes can go wrong. Watch for these patterns:
Measuring too late. Waiting until post-implementation to assess adoption means you have no opportunity to course-correct. By the time the data confirms a problem, the project team has moved on. Build measurement into every phase, starting with leading indicators well before go-live.
Activity metrics masquerading as outcomes. “We delivered 40 training sessions” is not a success metric. “85% of trained users passed the proficiency assessment” is. Always ask: does this metric tell me whether anything actually changed?
Vanity metrics. High email open rates and training attendance figures look good in reports but tell you nothing about whether behaviour changed. Focus on metrics that are uncomfortable to report when they are low, because those are the ones that matter.
Single-point-in-time measurement. Adoption at go-live is not the same as sustained adoption. Many changes show strong initial compliance that erodes within 90 days. Measure at 30, 90, and 180 days post-implementation to track sustainability.
Ignoring the portfolio view. Measuring success for each initiative independently can mask portfolio-level problems. A team that successfully adopted one change may have done so at the expense of another. Measure change management success at both the initiative and portfolio level.
How digital analytics platforms support measurement
WTW’s 2023 global study of 600 organisations found that companies taking a data-driven, proactive approach to change management drove nearly three times more revenue than those with below-average change effectiveness. The implication is clear: measurement is not just a reporting exercise; it is a competitive advantage.
Digital change management platforms such as The Change Compass enable organisations to track adoption metrics across the full change portfolio in real time, aggregate leading and lagging indicators into decision-ready dashboards, and identify measurement gaps before they become blind spots. For organisations managing multiple concurrent changes, these platforms replace manual spreadsheet tracking with continuous, portfolio-wide measurement intelligence.
To measure change management success effectively, stop counting what you did and start tracking what changed. Build a three-tier measurement framework that captures leading indicators early enough to steer decisions, adoption indicators during implementation to confirm behavioural change, and impact indicators after implementation to prove business value. The organisations that measure change management success rigorously do not just deliver better projects; they build the evidence base that secures ongoing investment in change capability.
Frequently asked questions
What are the most important KPIs for change management? The most critical KPIs are adoption rate (percentage of the target population using the new system or process as intended), sponsor engagement score, time to proficiency, and benefit realisation rate. These four metrics collectively measure whether the change was adopted, supported, efficient, and valuable to the business.
How do you measure change management ROI? Change management ROI compares the realised business benefits of a change initiative against the total investment in change management activities. Calculate it by quantifying the financial value of benefits achieved (cost savings, revenue gains, productivity improvements) and dividing by the total cost of change management resources, tools, and time. Express as a ratio or percentage.
What is the difference between leading and lagging indicators in change management? Leading indicators are predictive metrics measured before and during implementation, such as awareness levels, sponsor engagement, and training proficiency. Lagging indicators are retrospective metrics measured after implementation, such as adoption rates, sustained usage, and business outcome improvements. Both are essential for a complete measurement picture.
How soon after implementation should you measure change adoption? Measure at three intervals: 30 days post-implementation for initial adoption and early usage patterns, 90 days for sustained adoption and proficiency development, and 180 days for embedded behaviour change and benefit realisation. Single-point measurement at go-live is insufficient because it captures compliance, not true adoption.
Why do most organisations struggle to measure change management success? The most common barriers are reliance on activity metrics rather than outcome metrics, lack of pre-defined baselines against which to measure progress, absence of portfolio-level measurement capability, and insufficient integration between change management data and business performance data. Addressing these gaps requires both a measurement framework and the tooling to execute it at scale.
How do you build a change management measurement dashboard? An effective dashboard organises metrics into the three tiers (leading, adoption, impact), displays them against targets and baselines, and updates in near-real time. Include traffic-light indicators for at-risk metrics, trend lines showing trajectory over time, and portfolio-level aggregation across all active initiatives. Design it for the audience: executives want outcomes and ROI; project teams want adoption trends and risk indicators.
Suggested title: How to measure change management success: KPIs, metrics, and frameworks for 2026
Suggested meta description: Discover a 3-tier framework for measuring change management success with 7 essential KPIs. Move from activity tracking to outcome measurement.
Every large organisation generates significant volumes of change management data. Readiness assessments, impact analyses, stakeholder surveys, adoption trackers, change plans, training records. Most of it is created at the project level, used briefly, and then archived when the project closes. The insight it could generate, about what kinds of change land well, which stakeholder groups are consistently resistant, how cumulative load affects adoption, which interventions work in your culture, largely disappears.
This disposal of valuable data is one of the most common and least-discussed limitations of how organisations currently approach change management. When change data is managed tactically, it serves only the project that created it. When it is managed strategically, it becomes an organisational asset that improves the quality of change decisions across the portfolio, year on year.
Capgemini Invent’s 2023 change management study, surveying 1,175 professionals globally, found that high data maturity in change programmes correlates with a 27% improvement in change success rates, and that data-driven leadership adds a further 23% lift. The research is unambiguous: how you manage change management data is a meaningful predictor of transformation outcomes.
This article is about making that shift, from tactical, project-level data management to strategic change data management that builds cumulative intelligence about how change works in your organisation.
The four common failure modes of change data management
Most organisations do not set out to manage change data poorly. The failure modes are structural, rooted in how change management work is organised rather than individual capability gaps.
Data collection is ad hoc and project-specific. When each project team designs their own impact assessment templates, readiness survey questions, and adoption tracking approaches, the data produced is genuinely useful within that project and largely useless outside it. There is no consistent taxonomy, no standard scales, and no common definitions. When you try to ask a cross-portfolio question , “which of our business units consistently shows lower adoption rates?” , the data cannot answer it because it was never designed to be aggregated.
Data lacks factual grounding. A significant proportion of change data is perception-based, reflecting what change managers think about stakeholder readiness or impact severity rather than what the evidence shows. Heat maps built on subjective ratings, readiness assessments scored by the project team rather than the affected employees, and impact analyses that reflect project plan assumptions rather than actual operational context all share this weakness. The data is not wrong, exactly, but its evidential basis is thin and rarely documented. When challenged by senior stakeholders, it is difficult to defend.
Visualisation obscures rather than reveals. The way change data is visualised has a substantial effect on whether it drives decisions. A heat map that shows everything as amber is not a useful risk management tool; it has simply translated uncertainty into colour. Visualisations that use the wrong chart type for the underlying data pattern, or that present too many variables at once, or that aggregate data in ways that mask important distribution effects, are actively misleading even when the underlying data is sound.
Data is not retained as an asset. When a programme closes, its change data typically closes with it. The lessons embedded in three years of readiness assessments, adoption surveys, and stakeholder feedback are lost. The next programme team starts from scratch, repeating the same diagnostic work, making the same assumptions, and potentially encountering the same predictable resistance that a prior team navigated successfully. This waste is invisible because no one tracks the cost of reinventing the wheel, but it is substantial.
What strategic change management data management actually means
Strategic change management data management is the practice of designing, collecting, governing, and preserving change data as a reusable organisational asset rather than a project-level administrative product. It has five characteristics that distinguish it from tactical data management.
Consistent taxonomy and definitions
A strategic approach starts with agreement on what you are measuring and how. What does ‘high impact’ mean in your organisation’s context? How is change readiness defined and at what granularity? What are the stages of adoption your organisation recognises, and what observable behaviours characterise each stage? These definitions need to be documented, agreed by change leadership, and applied consistently across every programme in the portfolio.
This sounds straightforward but is often contentious, because standardisation requires programme teams to give up some flexibility in how they approach impact assessment and readiness measurement. The benefit, however, is that every new dataset generated becomes immediately comparable with every prior dataset, and portfolio-level analytics become possible.
Portfolio-level collection and aggregation
Individual programme data is useful to the programme team. Portfolio-level data, aggregated across all active and historical programmes, is useful to the change function leadership, to HR, to business unit heads, and to the executive team. Strategic change data management designs data collection with portfolio aggregation in mind from the outset, not as an afterthought.
The questions that portfolio-level change data can answer are categorically more strategic than those accessible from project-level data. Which business units are accumulating unsustainable change load this quarter? Which change types consistently generate higher resistance in your culture? Which combinations of interventions correlate with faster adoption in your organisation specifically? These are the questions that allow a change function to operate proactively rather than reactively.
Fact-based data quality standards
Strategic change data management requires documented standards for what constitutes adequate evidence for different data types. Stakeholder impact ratings should be supported by operational analysis, not solely by project team estimation. Readiness assessments should include both leader perceptions and employee-level indicators, because they frequently diverge. Adoption metrics should triangulate system usage data, survey data, and direct observation rather than relying on a single source.
This does not mean perfection is required before data can be used. It means being explicit about the evidential basis of data and the uncertainty that attaches to it. A readiness rating of 65% that is based on a 40-respondent employee survey is meaningful. The same rating based on a change manager’s estimate without respondent data should be labelled and treated differently.
Retention and longitudinal analysis
One of the most underexploited opportunities in change management is longitudinal analysis of your organisation’s own change history. If your organisation has been running significant change programmes for five or more years, and if that data has been retained in a structured format, you have the basis for genuinely organisation-specific benchmarks.
What percentage of employees in your operations function were typically at target adoption six months after a technology rollout in the past? What does the readiness trajectory typically look like for a business unit facing a structural reorganisation? These organisation-specific patterns are more useful for planning purposes than generic research benchmarks, because they reflect your culture, your leadership style, and your workforce characteristics.
A governance structure for change data
Strategic change data management requires governance: clear ownership, defined data standards, review cycles, and access controls. Without governance, standards erode over time as programme teams revert to their preferred approaches, data quality degrades, and the portfolio view becomes unreliable.
Governance for change data does not need to be elaborate. A data steward role within the change function, clear standards documentation, a quarterly review of data quality across the portfolio, and a defined retention policy are sufficient for most large organisations. The key is that someone is accountable for the quality of the organisational change data asset, not just the quality of their own programme’s data.
AI and automation: what they add to strategic change data management
The intersection of artificial intelligence and change management data is generating genuine capability improvements, particularly in the speed of synthesis and the detection of patterns that manual analysis would miss.
Capgemini’s concept of Intelligent Data-Driven Change Management (IDCM) combines human emotional intelligence with algorithmic insights to support change decisions. In practical terms, this means AI that can monitor multiple data streams simultaneously (survey results, system usage, engagement metrics, communication analytics) and surface signals that warrant human attention, rather than requiring change managers to manually synthesise all of this information.
Key AI applications in strategic change data management include:
Natural language processing of stakeholder feedback and open survey responses, identifying sentiment patterns and emerging concerns at scale without manual qualitative coding
Anomaly detection in adoption curves, flagging when a stakeholder group’s trajectory deviates significantly from expected patterns
Predictive modelling of adoption outcomes based on historical programme data, adjusted for current programme characteristics and context
Automated generation of executive summaries from portfolio data, reducing the reporting burden on change teams while improving reporting consistency
It is important to be clear about what AI does not replace. It does not replace the judgment required to understand why a stakeholder group is resistant, the relationship-building required to address that resistance, or the strategic thinking required to sequence programmes effectively. AI in change management is most valuable as a signal amplifier, drawing human attention to where it is most needed. The strategic framework within which those signals are interpreted remains a human responsibility.
Building a change data ecosystem
For organisations ready to move beyond ad-hoc data management, a change data ecosystem is the infrastructure that makes strategic change data management operational.
A change data ecosystem has three layers. The collection layer is where data enters the system: programme impact assessments, readiness surveys, adoption tracking, training completion, and communication analytics. The aggregation layer is where programme-level data is normalised, consolidated, and stored in a format that enables cross-programme analysis. The decision layer is where the data is used: executive dashboards, portfolio risk views, programme intervention decisions, and historical benchmarks.
Platforms like The Change Compass are purpose-built for this architecture, specifically for the challenge of visualising cumulative change load and adoption status across a complex change portfolio. The value of purpose-built change management software, compared to using general-purpose business intelligence tools, is that the data models and analytical frameworks are pre-configured for change management use cases. You are not building the methodology from scratch; you are applying it.
The shift from reporting to decision intelligence
The ultimate destination of strategic change management data management is decision intelligence: a state where change data actively informs decisions about sequencing, resourcing, intervention design, and programme prioritisation in real time rather than retrospectively.
This virtuous cycle is what mature change functions are beginning to achieve. They use data to improve programmes, which generates better data, which improves the next generation of programmes. The cumulative knowledge advantage this creates over time is significant and durable.
Getting there requires investment in the governance, tooling, and cultural change described in this article. But the starting point is simpler than it might appear. Pick one consistent definition. Apply it across your active programmes. Retain the data when those programmes close. Review what the combined data tells you at the end of the year. You will have begun the shift from tactical to strategic change data management, and the first cycle of learning will show you exactly why it matters.
Frequently asked questions
What is strategic change management data?
Strategic change management data is change-related information that is designed, collected, and governed as an organisational asset rather than a project-level administrative record. It includes readiness assessments, adoption metrics, impact analyses, and stakeholder data that are standardised across programmes and retained for portfolio-level analysis and longitudinal learning.
Why is change management data difficult to manage strategically?
The primary challenge is that change work is traditionally organised at the project level, where data serves only the immediate programme. Creating strategic value from change data requires cross-programme standardisation, governance ownership, and retention infrastructure, none of which emerge naturally from project-centric delivery structures.
How does data maturity affect change management outcomes?
Capgemini Invent’s research found that organisations with high data maturity in their change programmes achieve 27% higher success rates. The mechanism is that mature data management enables faster, more targeted interventions, better portfolio decisions, and more credible reporting to executive stakeholders, all of which directly improve adoption outcomes.
What role does AI play in change management data?
AI tools in change management primarily serve as pattern recognition and signal amplification tools. They can process large volumes of survey data, monitor multiple data streams simultaneously, and flag anomalies in adoption curves that warrant human attention. They do not replace the judgment, relationship, and strategic capabilities of change practitioners; they help those capabilities operate at a scale that manual analysis cannot support.
How should change data be governed?
Effective governance for change data requires a designated data steward, documented standards for data definitions and collection methods, a quality review cycle (typically quarterly), and a retention policy that specifies how long data from completed programmes is preserved and in what format. Governance does not need to be complex, but it does need to be explicit and owned.
Where should an organisation start in managing change data more strategically?
Start with taxonomy. Agree on consistent definitions for impact rating, readiness scoring, and adoption stages across your active change portfolio. Apply those definitions in your next programme cycle. Retain the data when programmes close. Then, at the end of a 12-month cycle, review the combined dataset and ask what questions it can answer that you could not previously answer. The value of the investment will be visible in the first year.
References
Capgemini Invent. Change Management Study 2023. https://www.capgemini.com/insights/research-library/change-management-study-2023/
Capgemini. Data-Driven Change Management is Crucial for Successful Transformation. https://www.capgemini.com/news/press-releases/data-driven-change-management-is-crucial-for-successful-transformation/
ResearchGate. The Role of Change Management in Enhancing Data-Driven Decision Making: Insights from Business Intelligence Initiatives (2024). https://www.researchgate.net/publication/384017092_The_Role_of_Change_Management_in_Enhancing_Data-Driven_Decision_Making_Insights_from_Business_Intelligence_Initiatives
Prosci. The Correlation Between Change Management and Project Success. https://www.prosci.com/blog/the-correlation-between-change-management-and-project-success
Panorama Consulting. Top Organizational Change Management Trends for 2025. https://www.panorama-consulting.com/top-change-management-trends-for-2025/
Change management professionals often struggle with proving the worth of their services and why they are needed. There are certainly plenty of reasons why change management professionals are required and most experienced project managers and senior leaders would acknowledge this. However, for the less mature organisations that may not have had effective change management experts leading initiatives, the rationale on the additional value of change management may be less clear.
When we look across different project members and project teams, it is easy to argue that without developers, the technical project cannot progress. Without business analysts, we cannot understand and flesh out the core business steps required in the initiative. And of course, we definitely need a project manager for a project. But, what’s the justification for a change manager? Many projects have other project or business representatives do the change work instead.
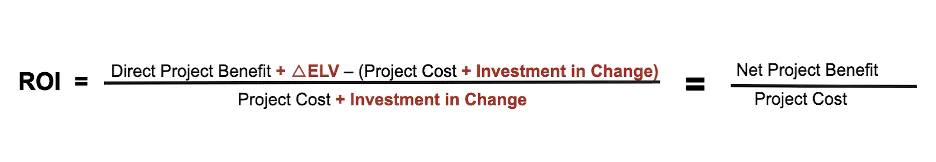
As an attempt to justify in a very direct way, the value of change management, many resort to ROI calculations and aim toward higher ROI. This ROI of change management may seem like a great way to convey and show in a very direct and financial way, the value of change management towards project success. After all, we use ROI for calculating projects, why not use the same for change management as well to value the people side of change?
There are plenty of articles on how to best calculate change management ROI. Here are a couple:
1. PROSCI
Prosci has a good, clear way of calculating change management ROI within a project (though it doesn’t take into account speed of adoption). You simply evaluate to what extent employee adoption is important to the project. Then you take the overall expected project benefits and deduct the part of the expected benefits if there was no adoption. This is termed “people side benefit contribution”.
People Side Benefit Contribution = Expected Project Benefits – Expected Project Benefits (if adoption and usage = 0)
People Side Benefit Coefficient = People Side Benefit Contribution / Expected Project Benefits
2. Rightpoint
Rightpoint has a variation to this calculation. They have added ELV (Employee Lifetime Value) to the calculation.
Using ROI may be useful when the cost of the initiative is the critical focus for the organisation for its strategic investment. However, it is not the only way to convey the overall value of successful change management. In addition, the ROI method limits the value of change management to focus on the cost invested versus the value created. Also, this type of calculation limits the value of change to a project by project perspective.
So, how else do we show the direct financial value of change management? Let’s look to research. It turns out there are plenty of research examples. Here are some:
McKinsey & Company. (2016). The people power of transformations. This study found that transformation initiatives are 5.8 times more successful if CEOs communicate a compelling change story, and 6.3 times more successful when leaders share messages about change efforts with the rest of the organization. Link here.
Korn Ferry. (2018). Engaging hearts and minds: Preparing for a changing world. This study found that calls out change as a key trend found that companies with high levels of employee engagement had 4.5 times higher revenue growth compared to companies with low levels of engagement, noting that all companies are undergoing change. Link here.
IBM. (2016). Making change work … while the world keeps changing. This study found that 76% of successful projects include change management activities at the beginning of their overall project plans, which is 33% more than less successful projects. Link here.
IBM. (2015) Why a business case for change management. The article references a survey carried out in 2010 where companies that apply a value (benefit) realization approach (of which change management is a core component) complete projects at least twice as quickly and under budget by a factor of at least 1.9 times, Compared to those that don’t. Link here.
Towers Watson. (2013). Change and communication ROI. Organizations with highly effective communication and change management practices are more than twice as likely to significantly outperform their peers in total shareholder returns, versus organizations that are not highly effective in either of these areas. Link here.
Prosci. (2020). Best Practices in Change Management 11th Edition. The paper referred to a Prosci study that found that projects with excellent change management practices 6 times more likelihood of meeting project objectives than those that are poor. Link here.
So the value the importance of change management, let’s take a comparison to see the difference in using a ROI calculation of the value of change management versus using findings from the above research findings to demonstrate the derived value.
Let’s take a typical project example. Company A has ….
Annual revenue of $1 billion with 5% profitability
The revenue growth is 1%
Project A costs $1Million and is targeted for $3 million in benefits.
If the expected project benefits without adoption would be $1Million, then, the people-side contribution is …
$2Million / $3Million = $667K.
Let’s contrast this to other calculations using research.
Research findings | Calculation
Korn Ferry study where companies with high levels of employee engagement had 4.5 times higher revenue growth compared to companies with low levels of engagement. Taking a very conservative approach of portioning on 1/3 of employee engagement linked to change, this means 1.5 times higher revenue growth. | Taking a very conservative approach of portioning 1/3 of employee engagement as linked to change, this means 1.5 times higher revenue growth. This means if the revenue growth is 1%, then the additional revenue is $15 Million per year.
You can see that $15 million in value is much higher than the $667K in initiative ROI. From these examples, you can see that the financial value dwarfs that from the ROI calculation. On top of this, these are from research findings, which may have a stronger perceived validity and be easier to be trusted by stakeholders than the ROI calculation.
To point out, it is not an apple-to-apple comparison between the change management ROI from one initiative to the organisational value of change management across initiatives. However, the call out is that:
The financial value of change management does not need to be limited to individual initiatives
The sum may be greater than its parts. Rather than measuring at initiative levels, research findings are looking at organisational-level value
The value of change management may be more than cost, but also other value drivers such as revenue
As change management practitioners we should not shy away from calling out and citing the value of change management. Cost may be one value, but the true benefit of change management is both the top line as well as the bottom line. Directly referring to the research-backed findings also helps to highlight its value size and importance.
To do this, we should also work to deliver organisational value in managing change and not limit ourselves to one initiative. Focus on uplifting change management capability in the forms of leadership styles, change governance, change analytics, and change champion network capability, just to name a few.
Change management is often seen as a ‘soft’ discipline that is more an ‘art’ than science. However, successful change management, like managing a business, relies on having the right data to understand if the journey is going in the right direction toward change adoption. The data can inform whether the objectives will be achieved or not.
Data science has emerged to be one of the most sought-after skills in the marketplace at the moment. This is not a surprise because data is what powers and drives our digital economy. Data has the power to make or break companies. Companies that leverages data can significant improve customer experiences, improve efficiency, improve revenue, etc. In fact all facets of how a company is run can benefit from data science. In this article, we explore practical data science techniques that organizations can use to improve change outcomes and achieve their goals more effectively.
Improved decision making
One of the significant benefits of using data science in change management is the ability to make informed decisions. Data science techniques, such as predictive analytics and statistical analysis, allow organizations to extract insights from data that would be almost impossible to detect or analyse manually. This enables organizations to make data-driven decisions that are supported by empirical evidence rather than intuition or guesswork.
Increased Efficiency
Data science can help streamline the change management process and make it more efficient. By automating repetitive tasks, such as data collection, cleaning, and analysis, organizations can free up resources and focus on more critical aspects of change management. Moreover, data science can provide real-time updates and feedback, making it easier for organizations to track progress, identify bottlenecks, and adjust the change management plan accordingly.
Improved Accuracy
Data science techniques can improve the accuracy of change management efforts by removing bias and subjectivity from decision-making processes. By relying on empirical evidence, data science enables organizations to make decisions based on objective facts rather than personal opinions or biases. This can help reduce the risk of errors and ensure that change management efforts are based on the most accurate and reliable data available.
Better Risk Management
Data science can help organizations identify potential risks and develop contingency plans to mitigate those risks. Predictive analytics can be used to forecast the impact of change management efforts and identify potential risks that may arise during the transition. For example, change impacts across multiple initiatives against seasonal operations workload peaks and troughs.
Enhanced Communication
Data science can help facilitate better communication and collaboration between stakeholders involved in the change management process. By presenting data in a visual format, such as graphs, charts, and maps, data science can make complex information more accessible and understandable to all stakeholders. This can help ensure that everyone involved in the change management process has a clear understanding of the goals, objectives, and progress of the transition.
Key data science approaches in change management
Conduct a Data Audit
Before embarking on any change management initiative, it’s essential to conduct a data audit to ensure that the data being used is accurate, complete, and consistent. For example, data related to the current status or the baseline, before change takes place. A data audit involves identifying data sources, reviewing data quality, and creating a data inventory. This can help organizations identify gaps in data and ensure that data is available to support the change management process. This includes any impacted stakeholder status or operational data.
During a data audit, change managers should ask themselves the following questions:
What data sources from change leaders and key stakeholders do we need to support the change management process?
Is the data we are using accurate and reliable?
Are there any gaps in our data inventory?
What data do we need to collect to support our change management initiatives, including measurable impact data?
Using Predictive Analytics
Predictive analytics is a valuable data science technique that can be used to forecast the impact of change management initiatives. Predictive analytics involves using historical data to build models that can predict the future impact of change management initiatives. This can help organizations identify potential risks and develop proactive strategies to mitigate those risks.
Change managers can use predictive analytics to answer the following questions:
What is the expected impact of our change management initiatives?
What are the potential risks associated with our change management initiatives?
What proactive strategies can we implement to mitigate those risks?
How can we use predictive analytics to optimize the change management process?
Leveraging Business Intelligence
Business intelligence is a data science technique that involves using tools and techniques to transform raw data into actionable insights. Business intelligence tools can help organizations identify trends, patterns, and insights that can inform the change management process. This can help organizations make informed decisions, improve communication, and increase the efficiency of change management initiatives.
Change managers can use business intelligence to answer the following questions:
What insights can we gain from our data?
What trends and patterns are emerging from our data?
How can we use business intelligence to improve communication and collaboration among stakeholders?
How can we use business intelligence to increase the efficiency of change management initiatives?
Using Data Visualization
Data visualization is a valuable data science technique that involves presenting data in a visual format such as graphs, charts, and maps. Data visualization can help organizations communicate complex information more effectively and make it easier for stakeholders to understand the goals, objectives, and progress of change management initiatives. This can improve communication and increase stakeholder engagement in the change management process.
Change managers can use data visualization to answer the following questions:
How can we present our data in a way that is easy to understand?
How can we use data visualization to communicate progress and results to stakeholders?
How can we use data visualization to identify trends and patterns in our data?
How can we use data visualization to increase stakeholder engagement in the change management process?
Monitoring and Evaluating Progress
Monitoring and evaluating progress is a critical part of the change management process. Data science techniques, such as statistical analysis and data mining, can be used to monitor progress and evaluate the effectiveness of change management initiatives. This can help organizations identify areas for improvement, adjust the change management plan, and ensure that change management initiatives are achieving the desired outcomes.
Change managers can use monitoring and evaluation techniques to answer the following questions:
How can we measure the effectiveness of our change management initiatives? (e.g. employee engagement, customer satisfaction, business outcomes, etc.) And what method do we use to collect the data? E.g. surveys or focus groups?
What data do we need to collect to evaluate the change initiative progress?
How can we use statistical analysis and data mining to identify areas for improvement?
How can we use monitoring of ongoing support or continuous improvement?
The outlined approaches are some of the key ways in which we can use data science to manage the change process. Change practitioners should invest in their data science capability and adopt data science techniques to drive effective change management success. Stakeholders will take more notice of change management status and they may also better understand the value of managing change. Most importantly, data helps to achieve change objectives.
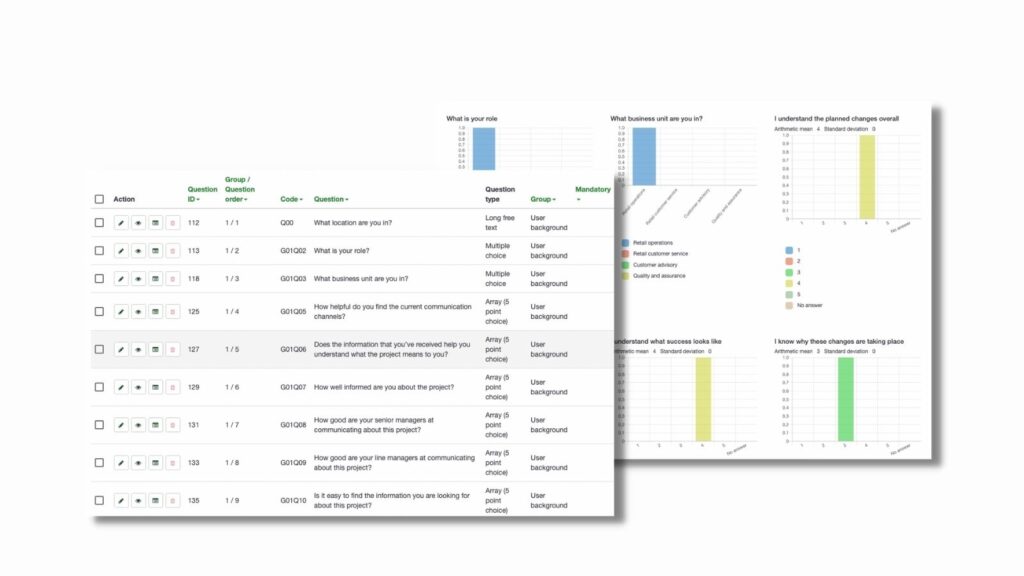
An important part of measuring meaningful change is to be able to design effective communication effectiveness change management surveys that measure the purpose of the survey it has set out to measure the level of understanding of the change. Designing and rolling out change management surveys is a core part of what a change practitioner’s role is. However, there is often little attention paid to how valid and how well designed the survey is. A survey that is not well-designed can be meaningless, or worse, misleading. Without the right understanding from survey results, a project can easily go down the wrong path. This is how this survey can be a powerful tool to ensure smooth transition for the change initiative.
Why do change management surveys need to be valid?
A survey’s validity is the extent to which it measures what it is supposed to measure. Validity is an assessment of its accuracy. This applies whether we are talking about a change readiness survey, a change adoption survey, employee engagement, employee sentiment pulse survey, or a stakeholder opinion survey.
What are the different ways to ensure that a organizational change management survey can maximise its validity and greater success?
Face validity. The first way in which a survey’s validity can be assessed is its face validity. Having good face validity is that in the view of your targeted respondents the questions measure what they aimed to measure. If your survey is measuring stakeholder readiness, then it’s about these stakeholders agreeing that your survey questions measure what they are intended to measure.
Predictive validity. If you really want to ensure that your survey questions are scientifically proven to have high validity, then you may want to search and leverage survey questionnaires that have gone through statistical validation. Predictive validity means that your survey is correlated with those surveys that have high statistical validity. This may not be the most practical for most change management professionals.
Construct validity. This is about to what extent your change survey measures the underlying attitudes and behaviours it is intended to measure. Again, this may require statistical analysis to ensure there is construct validity.
At the most basic level, it is recommended that face validity is tested prior to finalising the survey design.
How do we do this? A simple way to test the face validity is to run your survey by a select number of ‘friendly’ respondents (potentially your change champions) and ask them to rate this, followed by a meeting to review how they interpreted the meaning of the survey questions.
Alternatively, you can also design a smaller pilot group of respondents before rolling the survey out to a larger group. In any case, the outcome is to test that your survey is coming across with the same intent as to how your respondents interpret them.
Techniques to increase survey validity
1. Clarity of question-wording.
This is the most important part of designing an effective and valid survey. This is a critical part of the change management strategy. The question wording should be that any person in your target audience can read it and interpret the question in exactly the same way.
Use simple words that anyone can understand, and avoid jargon where possible unless the term is commonly used by all of your target respondents
Use short questions where possible to avoid any interpretation complexities, and also to avoid the typical short attention spans of respondents. This is also particularly important if your respondents will be completing the survey on mobile phones
Avoid using double-negatives, such as “If the project sponsor can’t improve how she engages with the team, what should she avoid doing?”
2. Avoiding question biases
A common mistake in writing survey questions is to word them in a way that is biased toward one particular opinion which may lead to biased employee feedback. This assumes that the respondents already have a particular point of view and therefore the question may not allow them to select answers that they would like to select.
Some examples of potentially biased survey questions (if these are not follow-on questions from previous questions):
Is the information you received helping you to communicate effectively to your team members through appropriate communication channels?
How do you adequately support the objectives of the project
From what communication mediums do your employees give you feedback about the project
3. Providing all available answer options
Writing an effective employee survey question means thinking through all the options that the respondent may come up with regarding the upcoming change. After doing this, incorporate these options into the answer design. Avoid answer options that are overly simple and may not meet respondent needs in terms of choice options.
4. Ensure your chosen response options are appropriate for the question.
Choosing appropriate response options may not always be straightforward. There are often several considerations, including:
What is the easiest response format for the respondents?
What is the fastest way for respondents to answer, and therefore increase my response rate?
Does the response format make sense for every question in the survey?
For example, if you choose a Likert scale, choosing the number of points in the Likert scale to use is critical.
If you use a 10-point Likert scale, is this going to make it too complicated for the respondent to interpret between 7 and 8 for example?
If you use a 5-point Likert scale, will respondents likely resort to the middle, i.e. 3 out of 5, out of laziness or not wanting to be too controversial? Is it better to use a 6-point scale and force the user not to sit in the middle of the fence with their responses?
If you are using a 3-point Likert scale, for example, High/Medium/Low, is this going to provide sufficient granularity that is required in case there are too many items where users are rating medium, therefore making it hard for you to extract answer comparisons across items?
5. If in doubt leave it out
There is a tendency to cram as many questions in the survey as possible because change practitioners would like to find out as much as possible from the respondents. However, this typically leads to poor outcomes including poor completion rates. So, when in doubt leave the question out and only focus on those questions that are absolutely critical to measure what you are aiming to measure.
6.Open-ended vs close-ended questions
To increase the response rate of change readiness survey questions, it is common practice to use closed-ended questions where the user selects from a prescribed set of answers. This is particularly the case when you are conducting quick pulse surveys to sense-check the sentiments of key stakeholder groups. Whilst this is great to ensure a quick, and painless survey experience for users, relying purely on closed-ended questions may not always give us what we need.
It is always good practice to have at least one open-ended question to allow the respondent to provide other feedback outside of the answer options that are predetermined. This gives your stakeholders the opportunity to provide qualitative feedback in ways you may not have thought of. This may include items that indicate employee resistance, opinions regarding the work environment, new ways of working, or requiring additional support.
Writing an effective and valid change management survey best practices for a specific change initiative is often glanced over as a critical skill. Being aware of the above 6 points will get you a long way in ensuring that your survey addresses areas of concern in a way that aligns with your change management process and strategy and will measure what it is intended to measure. As a result, the survey results will be more bullet-proof to potential criticisms and ensure the results are valid, providing information that can be trusted by your stakeholders.