Why heatmaps are not the best way to make change decisions
by | Change Measurement
Change heatmaps are one of the most commonly used charts when making business decisions on whether there is too much change or not. Yes there are some advantages of using heatmap. However, there are also lots of strong reasons why you should not use change heatmaps, at least solely. Let’s examine some of these reasons and tear apart some of the strong risks of relying on heatmaps to make change planning decisions.
How do you create an effective change management heat map?
To create an effective change management heat map, identify key areas of impact and categorize them based on urgency and importance, including various impact levels. Use a color-coding system to visually represent data, ensuring stakeholders can quickly assess risk levels. Regularly update the map to reflect changes and maintain alignment with organizational goals.
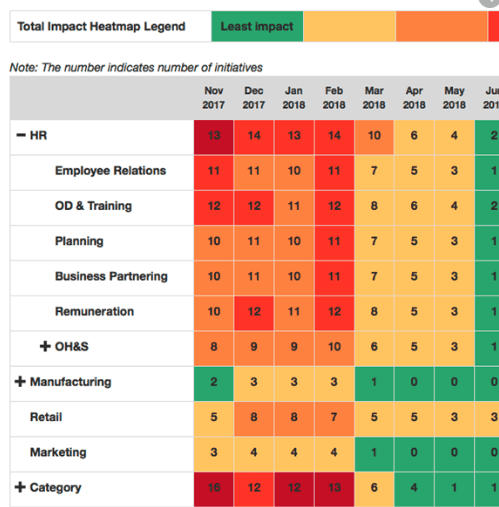
What are some of the common ways of using heatmaps? A lot of organisations use change heat maps to represent how much change there is impacting different parts of the business. There are various versions of this. However, the most common way to depict this is to provide leadership teams with a list of each project against different parts of the business and show the heat levels. This is the less popular format because each project has varying levels of heat and to aggregate the heat level into one singular cell is not a good representation of the stakeholder impact experience.
The more popular way is to plot out the heat levels of different business units across time, employing a gradient scale, with each cell showing heat levels. This is better able to depict how different business units will be experiencing different levels of change across time across the delivery of all projects. The below is one example of a heatmap.
What are some of the advantages of using change heatmaps?
Easy to understand
A lot of stakeholders like this format because it is easier to understand. The deeper the colour is the more ‘change heat level’ there is. Simple! Most stakeholders can intuitively interpret the data without needing explanation.
Visually appealing
People like looking at colourful charts and the heatmap is colourful. Let’s face it … no one likes looking at a series of boring, stale charts that are monotone in colour. Right?
Familiar
Most stakeholders are used to the traffic light view of change heatmaps. In most project settings, the red, amber, green indication of different heat levels are well understood to depict varying levels of high performance heat within a change setting.
However, there is a long list of strong reasons why you should not rely on change heatmaps … or at least not purely.
Why should we not use the change heatmap?
The traffic light method of depicting different volumes of change is misleading.
Firstly, having only 3 categories of different categories of change volume is not adequate within organisations that have lots of change. In practice, if we only use red, amber and green to depicts all varying levels of change then a lot of the time the colours will remain the same, even when there is significant varying levels. So, clearly the variation depicted within 3 colours is much too limiting.
The traffic light method of depicting change is subject to psychological bias
Yes stakeholders are familiar with interpreting traffic light indications. However, within the project context stakeholders interpret green as good, red as alert/bad, and amber as be careful or keep watching. This is absolutely not the right message when interpreting the heatmap.
Each colour should show purely the level of change impact, and not if the change is good or bad. Therefore, at The Change Compass we have stopped using the traffic light system of indicating change heatmap. Instead, we use different shade of the same colour so that the user purely focuses on the colour levels, and not additional psychological biases. Here is an example.
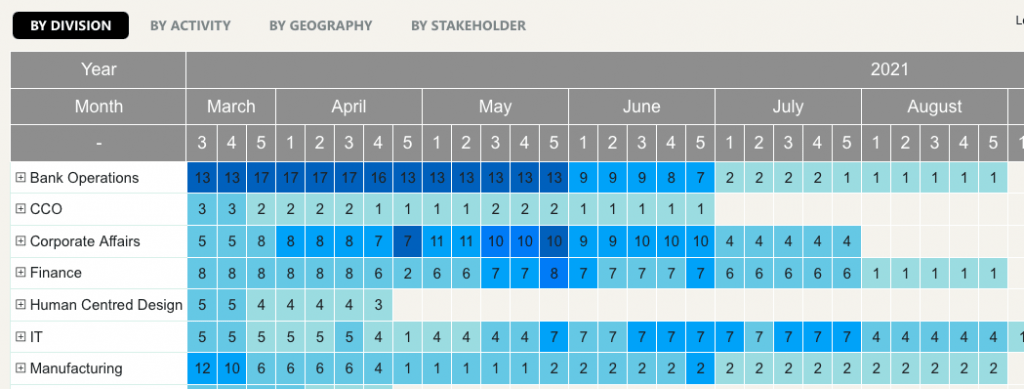
The heatmap is very categorical
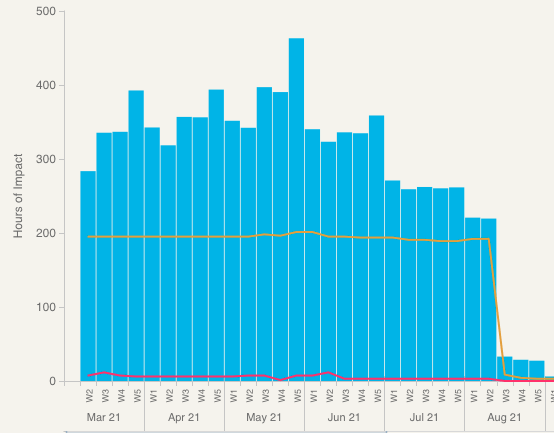
Whether using 3 levels of 5 levels of colours is categorical by definition. We are categorising the varying levels of change into one of these categories. So, by definition the heatmap cannot be granular. It is only designed to provide a high level and broad-sweeping view of change volume. To get a more granular view other charts should be used instead that depict exact volume of the impact within a point in time. For example, a bar chart. Here is one example.
Some of the best reasons not to use heatmaps are due to significant risk
What are these risks?
Risk of personal judgment in deriving heatmaps
A common way to put together change heatmaps is to use ‘personal judgment’ to rate the change impact of projects across time and across business units. This is an easier and faster way to generate heatmaps. However, because the rating is highly subjective, you will easily get challenged by your stakeholders. It may be a rabbit-hole within a stakeholder meeting that you would not want to go down.
Comparing across business units
When stakeholders read a change heatmap the natural tendency is to compare the heat levels across different business units. Department A has more change than department B. It is human nature. However, what the heatmap does not communicate is the varying levels of perceived change saturation across different business units.
Change saturation is affected by varying factors such as leadership quality and change maturity. Therefore, different business units will have different levels of susceptibility for change saturation. The same change volume can be perceived as having exceeded saturation in one business unit. However, for another business unit the same change level can be easily handled and consumed.
So, comparing change volumes across business units needs to be done carefully with the premise that this cannot necessarily be an apple-to-apple comparison.

Isolating the hotspots
Most companies present heatmaps at business unit levels. However, this may not be sufficient because in some cases this may be too broad of a view. It could be that on the surface one business unit has the most volume of change. But maybe its not the whole business unit. It could be just one team that is going to shoulder the bulk of the change volume, versus the whole business unit. Therefore, the ability to drill down and examine which section and which layer of the organisation is most impacted is critical.
Drilling down to find out where the hostpots are is not just a factor of which part of the business unit. It could also be the stakeholder group or type of roles impacted. It could be that only the frontlines are impacted versus the whole business unit. Or that only team managers are impacted, and not so much the frontline teams.
The other factors to examine also include the location of the teams impacted. Are certain locations more impacted than others? Are certain project activities impacting employees more than others? For example, are most employees needing to take time away from their day jobs because of the amount of training required?
Different types of people impacts
Employee heatmaps are mostly what change practioners spend their time on producing. However, there could also be impacts on customers. A lot of organisations are very forth-coming to call out that ‘customer is their number one focus’. However, is there a clear picture of what are all the various customer impacts resulting from change initiatives? There could also be impacts on partners and suppliers that work with the organisation to produce the products and services. Their impacts could also be critical in managing and planning for change.
Does not take into account change velocity
Change heatmaps typically focus on volumes of change. However, this is not the only perspective that needs to be considered. What about the speed in which change is going to be implemented? Will the change feel fast or slow? Is there a lot of change to be implemented within a short period of time? Clearly, having a way to depict the velocity of change can also be a very insightful lense in addition to just the focus on volume.
Teams that may be less change mature could struggle with a fast pace of organizational change if they have not had the previous experience nor the change capability in place. Does the team have the capacity to undergo rapid and fast moving change? Do they have the operating rhythms in place to support this velocity? Having a view to the velocity of change may provide guidance in terms of what business readiness needs to be in place to prepare for change. The below is an example of measuring the comparative speed of change from The Change Compass.
So, in summary you can see that there is more to understanding and planning for change than to rely solely on the change heatmap. Change is multidimensional. Simply using one view to depict it may not be sufficient. The key is to use it to provide a broad high level understanding and then drill down into other change data to understand what the story is and what the risks are the organisation, and to adjust their change strategies accordingly.
Being clear with what the story-line is will help you to determine what data to present to your stakeholders. If you are purely focused on driving discussion on whether to delay the roll out of certain projects due to limited business capacity of a particular business unit, then a bar chart may be more useful. If you are wanting to portray the impacted volume of certain roles, then a line chart portraying the volume of change that these roles will be facing into over time is a better option.
If you are finding it too complicated or manual to derive various change data visualisation or charts, have a chat to us. Digital is the way to go for organisations that would like to become more digital. Businesses are putting their weight on digitising as many parts of the operation as possible, and data collection, including insights from focus groups, is crucial in this process. Change also needs to catch up and digitise itself. This does not mean being data-centric at the expense of the ‘softer side of change’. It means using data to be more impactful and have better conversations to portray what will happen to the organisation and being able to call out critical risks, with adequate confidence.
For more on change measurement go to The Ultimate Guide to Measuring Change.
Click here to read more on building change analytics capability.
- Building Change Portfolio Literacy in Senior Leaders: A Practical Guide
- 7 Common Assumptions About Managing Multiple Changes That Are Wrong
- This is what change maturity looks like, and it wasn’t achieved through capability sessions
- Change Management’s Data Revolution: How to Measure What Matters (Before It’s Too Late)
- What Research Says About Change Portfolio Management: Insights for Leaders


