Change adoption metrics are the usage, proficiency, sustainment and outcome indicators that show whether people are working differently after a change, not merely that the change was delivered to them.
The average organisation uses only 54% of the software licences it pays for, according to Zylo’s 2026 SaaS Management Index, which is the adoption problem in one number: Access is not use. The same gap runs through change programmes. A project can report full training attendance, every account provisioned and a green status, while the new process is used for the easy cases and bypassed for the hard ones.
This article is for change, HR and transformation leaders who already know they should measure adoption and need to decide what, exactly, to put on the page. It argues that credible adoption evidence rests on four families of metric (usage, proficiency, sustainment and outcome), that each family fails in a predictable way when read alone, and that the skill is in reading them together. By the end you will be able to choose a short, defensible metric set for a given initiative and interpret it without overclaiming. If you need the method for collecting this data, see our guide to how to measure change adoption; for the wider framework, start with the ultimate guide to measuring change.
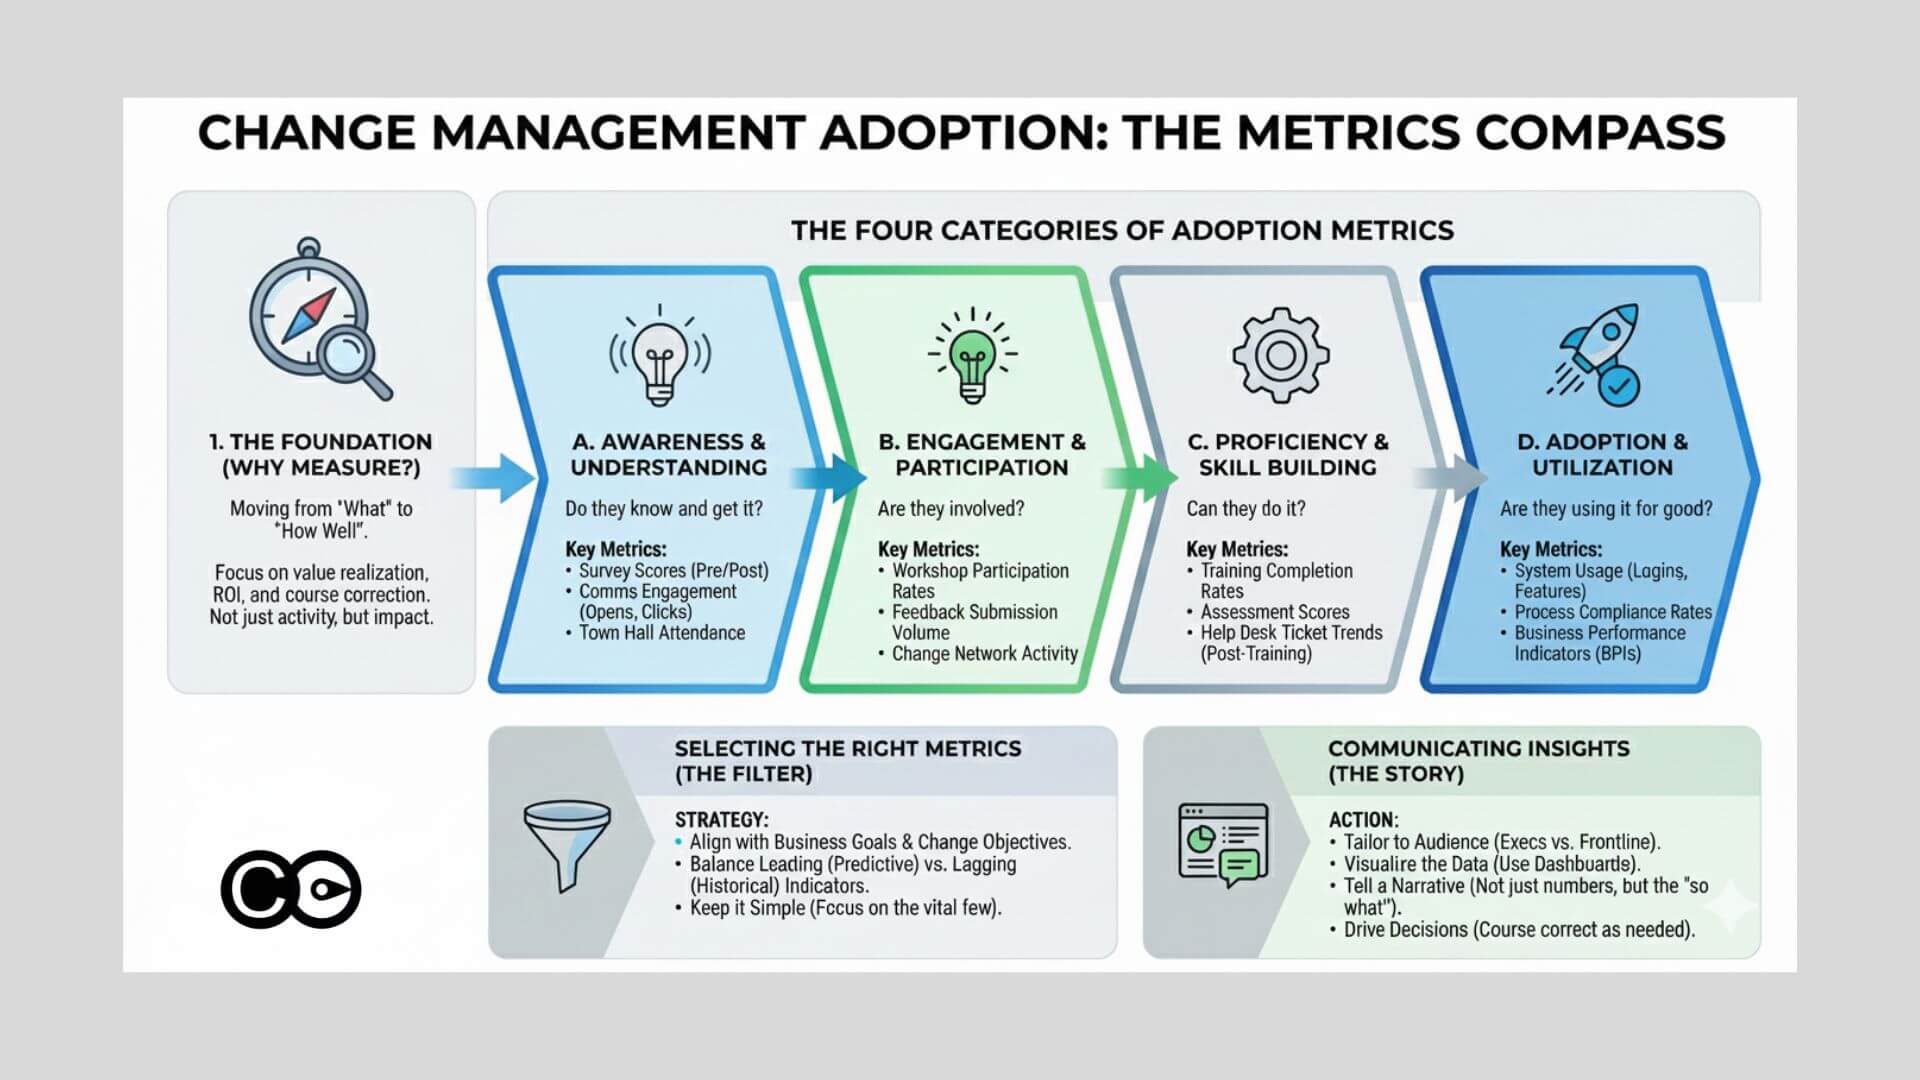
The four families of adoption metric
An adoption metric is any measure of what people do after the change that can be tied to a specific behaviour the change requires, and the strongest sets combine usage, proficiency, sustainment and outcome measures.
Prosci’s research gives practitioners a useful starting taxonomy. It describes speed of adoption, ultimate utilisation and proficiency as the core measures once people have reached the ability stage: How quickly people begin to use the change, how many are using it, and how well they apply it. We add two more families, because a programme that stops at those three cannot answer the questions executives actually ask later.
- Usage: Are the intended people using the change, how often, and how fully? (Speed of adoption and ultimate utilisation.)
- Proficiency and behaviour: Are they doing it correctly, in the way the benefit depends on?
- Sustainment: Does use hold after launch support is withdrawn, or does work drift back?
- Outcome: Is the business result the change was funded for visibly moving?
Each family answers a different question, and each has a blind spot. Usage can be high while proficiency is poor. Proficiency can be strong in the pilot team and absent elsewhere. Sustainment is invisible if you stop measuring at go-live. Outcomes move for many reasons other than adoption. The rest of this article takes each family in turn and then shows how to read them together.
Usage metrics: Reach, frequency and depth
Usage metrics tell you whether the intended population is using the change, how often and how deeply, and the most common error is treating login counts as evidence of any of these.

Gallup’s May 2026 indicator shows how misleading access data can be. Nearly half of US employees (47%) say their organisation has integrated AI tools, yet only 30% use them a few times a week or more and 15% use them daily. Implementation, in Gallup’s words, does not guarantee use. Any programme that reported adoption from provisioning or first-login data would have overstated it by roughly half.
Split usage into three measures, because each exposes a different failure:
- Reach: The share of the intended population who have used the new process or tool at all, by role and by team. This is your speed-of-adoption view when plotted weekly from go-live.
- Frequency: How often the people who use it do so, compared with how often the work requires it. A tool needed daily and used monthly is not adopted.
- Depth: The share of use that happens in the core workflow, measured on the two or three features or steps the benefit depends on, not on every feature.
The depth measure matters most. For a system implementation it might be the percentage of orders created in the new system rather than raised by spreadsheet, or the share of customer records completed to the required standard at first save. For a process change it is the proportion of cases that follow the new sequence end to end. Choose the critical few and ignore the long tail of features.
Read usage by segment, not by average
An enterprise average hides the teams that matter. Report usage by role, location and manager, then look for the lowest quartile. A 78% overall rate that conceals one division at 35% describes a rollout that has succeeded in some places and not started in others, and the response to each is different.
Proficiency and behaviour metrics: Are people doing it right?
Proficiency metrics show whether people perform the new way correctly and consistently, and they are the family most often missing from adoption reports because they require more than system data.
The gap between use and effect shows up clearly in Gallup’s data. Of employees in organisations that have implemented AI, 65% say it has improved their productivity, but only 14% strongly agree it has transformed how work gets done. Most people have used the tool inside their existing workflow, which is adoption of a sort, but not the changed way of working the investment assumed. Usage metrics alone would have called that a success.
Proficiency is measured through observable behaviours (sometimes called micro-behaviours): The small, specific actions that show the change is embedded. Useful examples:
- Error and rework rate: The share of transactions returned, corrected or escalated because the new process was not followed.
- Time to complete a key task against a pre-change baseline, once the learning curve has passed.
- Workaround rate: The proportion of work still routed through the legacy spreadsheet, email or manual step.
- Assessed competency: A short practical check or manager sign-off, rather than a quiz on course content.
- Manager coaching frequency: How often team leaders observe and reinforce the new behaviour. Gallup finds that employees whose managers actively support their team’s AI use are 1.7 times as likely to use it a few times a week or more, and only 36% of employees in AI-integrating organisations strongly agree their manager does.
Behaviour data is cheaper to collect than it sounds if you decide in advance which three or four behaviours the benefit depends on. For a deeper treatment of how behaviours form and hold, see our guide to behaviour change in the workplace.
Sustainment and outcome metrics: Does it last, and does it pay?
Sustainment metrics test whether adoption survives after launch support ends, and outcome metrics test whether the benefit the change was funded for has actually arrived; reporting neither leaves the programme unable to prove its value.
Most of the value in a change is realised, or lost, after the programme team has moved on. BCG’s 2025 analysis of transformation concluded that only about a quarter of transformations successfully create value, which is a reminder that delivery and realisation are different events. Go-live is the start of the measurement window, not the end.
Sustainment indicators
Re-measure the same usage and proficiency indicators at fixed intervals after support ends (30, 90 and 180 days is a workable pattern) and add one specific measure:
- Reversion rate: The share of work, by team, that has returned to the old process or an unapproved workaround.
- Stability of use: Whether each team’s usage is flat or rising without fresh intervention. A decline that begins when champions or project staff withdraw points to a reinforcement gap, not a design flaw.
- Support demand: The trend in help requests per user. A fall followed by a rise often signals a second wave of problems as edge cases appear.
Outcome indicators
Outcome metrics connect adoption to the business case: Cycle time, cost to serve, error cost, compliance incidents, customer satisfaction, or revenue per seller, depending on the change. Their discipline is attribution. Where possible compare adopting teams with lagging ones, or a team before and after it reached a stable usage level, rather than reading a portfolio-wide trend that moves for many reasons. Where you cannot isolate the effect, say so in the report. Our guide on the problem with change management metrics covers the most common ways outcome claims overreach.
Choosing metrics by change type
The right adoption metrics depend on what the change asks people to do, so start from the target behaviour and pick the two or three metrics in each family that evidence it.
A system implementation turns on depth of use in the core workflow. A compliance change turns on observed behaviour and incident trends, because logins say nothing about whether the rule is followed. A restructure has few clean usage measures, so engagement, role clarity and collaboration patterns carry more weight, though these are better described as readiness and outcome indicators than adoption in the strict sense.
| Metric | System implementation | Compliance change | Restructure |
|---|---|---|---|
| Reach and active-use rate | High priority | Moderate | Low |
| Feature or workflow depth | High priority | Low | Low |
| Process compliance rate | Moderate | High priority | Moderate |
| Incident or error rate | Moderate | High priority | Low |
| Manager observation or coaching | Moderate | High priority | High priority |
| Assessed proficiency | Moderate | High priority | Moderate |
| Engagement or clarity pulse | Low | Moderate | High priority |
| Reversion rate | High priority | Moderate | Moderate |
| Productivity vs pre-change baseline | High priority | Moderate | High priority |
How many metrics is enough?
Aim for a core set of 8 to 15 metrics per initiative, grouped under the four families, with only the handful that answer the sponsor’s question reported upward. Include a metric only if you can name the decision it would change and you can collect it reliably at the cadence you need. Mix system data with at least some observation or survey data, because system logs cannot tell you why a team is lagging.
How to read the numbers together
Adoption is established when usage, proficiency and sustainment point the same way, and every divergence between them is a diagnosis waiting to be made.
Read the families as a set and look for the patterns below.
| What you see | Likely meaning | Where to look |
|---|---|---|
| High reach, low depth | People log in but bypass the core workflow | Process design, training on the critical steps |
| High usage, low proficiency | Use without the intended behaviour | Coaching, job aids, manager reinforcement |
| Strong pilot, weak elsewhere | Local conditions, not a general result | Team-level segmentation, champion coverage |
| Good at go-live, decline at 90 days | Reinforcement withdrawn too early | Sustainment plan, manager accountability |
| Good adoption, no outcome movement | Wrong behaviour targeted, or benefit case flawed | Revisit the benefit logic |
Leading and lagging indicators
Treat reach, frequency and early proficiency as leading indicators: They move first and can still be acted on. Treat reversion, incident rates and outcome measures as lagging: They confirm or contradict the story weeks later. Report both, and set thresholds in advance (for example, 70% reach in the target population by week six) so that a number triggers a decision rather than a discussion about whether it is good.
Make the data visible where decisions happen
A metric set earns its keep when managers and sponsors see it regularly. Spreadsheets and BI tools work for a single programme, but they struggle once an organisation runs many changes at once and needs a consistent view by team. Digital change platforms such as Change Compass bring adoption and impact data for multiple initiatives into one view, so leaders can see where adoption is lagging by team without rebuilding the report each month. For the layout of such a view, see our guide to designing a change adoption dashboard.
Where to start next week
Pick one live initiative and write down the two or three behaviours its benefit depends on. For each, name one usage metric, one proficiency metric and a sustainment check at 90 days, then agree with the sponsor what level would count as adopted. That small set will tell you more than a dashboard of twenty indicators, because every number on it is tied to a behaviour and a decision. Retire any existing metric that nobody acts on, and add the outcome measure only once you can say how you will separate the effect of adoption from everything else that moved. Revisit the set after the first reporting cycle: If two metrics always move together, keep the cheaper one. The aim is not a complete picture of the organisation but a trustworthy answer to one question, whether people are working differently and whether it is lasting.
Frequently asked questions
What are the most important change adoption metrics?
The most useful set covers four things: Usage (reach, frequency and depth of use), proficiency (whether people perform the new way correctly), sustainment (whether use holds after launch support ends) and outcome (whether the intended benefit is showing up). Prosci frames the first three as speed of adoption, ultimate utilisation and proficiency. No single metric is enough, because each can look healthy while another is failing.
What is the difference between adoption, utilisation and proficiency?
Adoption is the point at which people start using the change, utilisation is how many of the intended people keep using it and how fully, and proficiency is how well they perform with it. A team can show 95% utilisation and low proficiency if people use the new system but work around its intended process. Measure all three separately.
How many adoption metrics should we track for one initiative?
Most initiatives are well served by a core set of 8 to 15 metrics, grouped under usage, proficiency, sustainment and outcome, with only a handful reported to executives. More than that dilutes attention and turns data collection into a burden. Choose metrics tied to the specific behaviour the change needs, and drop any you cannot act on.
Are system logins a good measure of adoption?
Logins show access, not adoption. Gallup’s May 2026 data shows 47% of US employees say their organisation has integrated AI tools, yet only 30% use them weekly or more. Track feature use in the core workflow, the share of work processed the new way, and proficiency, and treat logins only as a first signal.
How do you know whether adoption has been sustained?
Check the same usage and proficiency measures at 30, 90 and 180 days after launch support ends, and watch the reversion rate: The share of work that returns to the old process or a workaround. Sustained adoption shows as stable or rising use in each team without extra intervention. A drop after support ends usually points to a manager reinforcement or process design gap.
References
- Zylo (2026). License management: Measure license utilization (2026 SaaS Management Index).
- Gallup (2026). Indicator: Artificial Intelligence in the workplace.
- Prosci. Change management success: Defining and measuring it.
- Boston Consulting Group (2025). From Change Management to Change Strategy.
This guide focuses on tracking adoption, what people are actually doing with the change. Three closely related guides on this site each cover a distinct angle, pick the one that matches what you need now:
- If you want proving overall change success to leadership → How to Measure Change Management Success: 5 Metrics That Prove Impact
- If you want a complete measurement framework end-to-end → How to Measure Change Management: Framework, Metrics and Reporting Tools