Key Change Management Metrics Examples You Should Avoid

Key Change Management Metrics Examples You Should Avoid

Successful change management relies on having the right metrics to measure progress, gauge impact, and communicate with stakeholders. Moreover, the right metrics can drive continuous improvement and help directly achieve change outcomes. However, not all metrics are beneficial, and some can mislead or fail to meet stakeholder needs, especially when managing change projects. Let’s check out the top change management metrics to avoid and go through examples to take note.

Understanding the Disconnect: Change Managers vs. Business Stakeholders

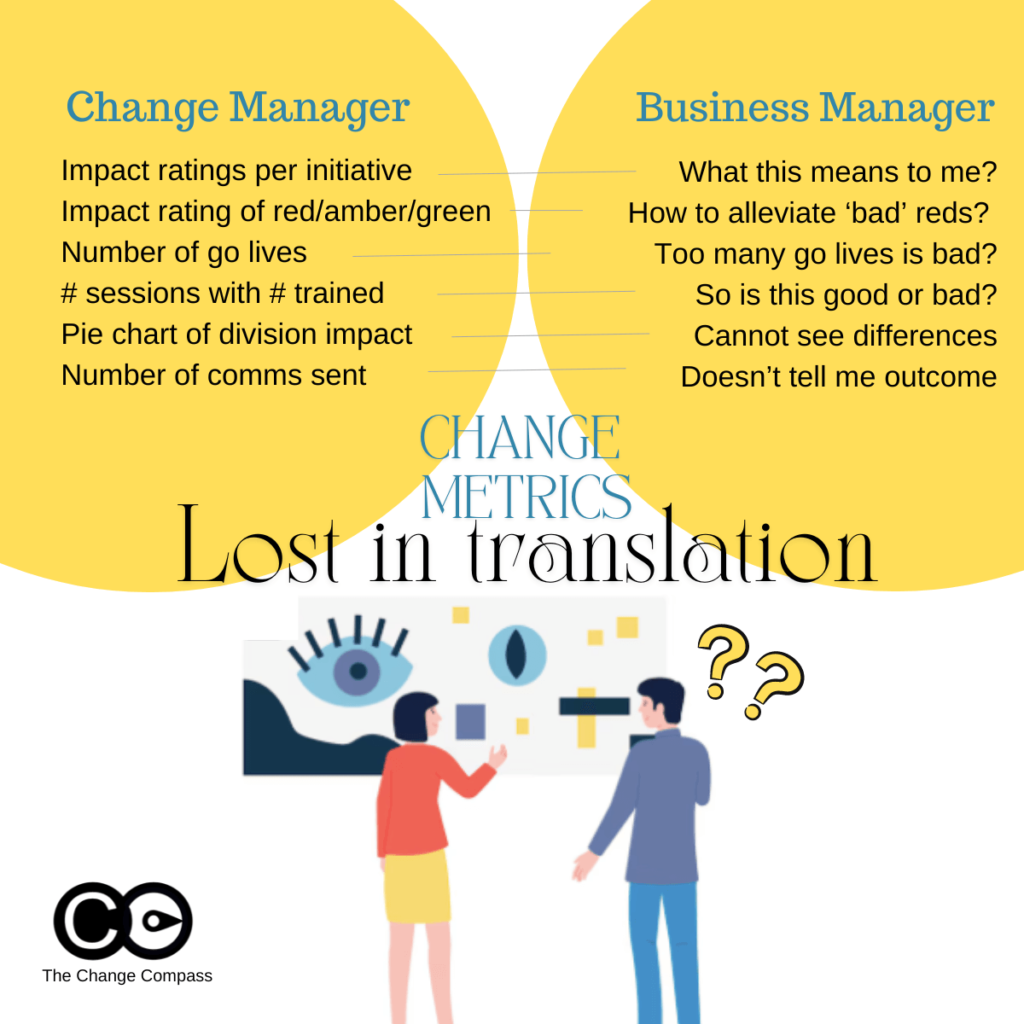
A significant reason certain change management metrics fall short is the differing perspectives between change managers and business stakeholders. Change managers and change practitioners are trained to view metrics through the lens of change management frameworks and methodologies, focusing on detailed assessments and structured approaches as a part of the change management strategy. These include applying ratings and judgments on aspects such as impact levels indicating levels and areas of impact.

In contrast, business stakeholders prioritize business operations, strategic outcomes, and practical implications.  The busy business stakeholder is often looking for practical implications from metrics that can be used to directly drive decision making, meaning “what do I do with this data to improve the ultimate business outcome”.  

Of course, different stakeholders have different data needs, and you need to show the right metric to the right type of stakeholder. For example, operations-focused stakeholders expect fairly detailed metrics and internal historical data to understand what that means in terms of organisation, coordination, capacity, and performance perspectives. Senior managers may prefer higher-level data with a focus on strategic impacts, overall progress, and adoption indicators of change success rate.

This disconnect can lead to the use of metrics that do not resonate with or are misunderstood by stakeholders that disrupt change success.

Change managers may leverage metrics that are derived from the various change management documents such impact assessments, training plan or communications plan.  Metrics are also often chosen for ease of use and ideally are not overly complicated to execute.

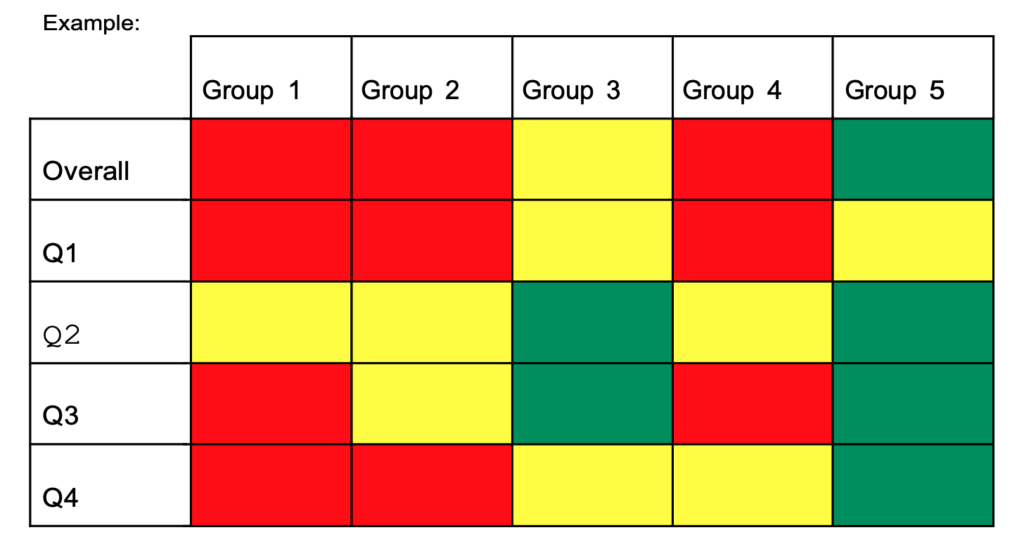
For example, impact assessments typically involve rating stakeholder groups and initiatives on a traffic light system (red, amber, green) based on their impact. While this approach is systematic, it can be problematic for several reasons:

  1. Lack of Sufficient Stakeholder Context: Business stakeholders might not understand the practical implications of these ratings. For instance, an “impact rating per initiative” may not clearly convey what the rating means for day-to-day operations or strategic goals. For example, if an initiative has a red impact rating, stakeholders might not grasp the specific operational changes or strategic adjustments needed, in essence, “what do I do with this?”. So, incorrect usage of data could result in lack of stakeholder engagement.
  2. Misinterpretation of Traffic Light Ratings: The red, amber, green system can be misleading. Stakeholders might interpret red as an indicator of alarm or imminent risk, while green may be seen as a sign that no action is needed.  This is because stakeholders are trained to interpret traffic light ratings this way (from the various project/business updates they’ve attended). In reality, red might simply mean high impact, requiring focused attention, and green might indicate a low impact but still require monitoring. For instance, a red rating might indicate significant process changes that need careful management, not necessarily a negative outcome.
  3. Hard to defend ratings if prompted: Business stakeholders may also want to drill into how the ratings are determined, and based on what basis.  They may expect a logical data-backed reasoning of how each colour scheme is determined.  If a rating is based on an overall ‘personal judgment’ this may be hard to defend infront of a group of stakeholders.
D83d12e7 2df8 4506 86b5 30d118f92907

Examples of Potentially Misleading Metrics

Certain metrics, although straightforward, can be easily misinterpreted and fail to provide a realistic picture of change impacts as a part of effective change management.  Often these are selected because they are easy to report on.  However, easy, make not give you the outcome you are looking for.

  1. Number of Go-Lives: Tracking the number of Go-Lives over time might seem like an effective way to represent change volume. However, the most significant impacts on people given time often occur before or after the Go-Live date. For example, the preparation and training phase before Go-Live and the adoption phase afterward are critical periods that this metric overlooks. A Go-Live date might indicate a milestone but not the challenges, progress or impacts faced during the implementation phase.
  2. Number of Activities Implemented: Similar to Go-Lives, this metric focuses on quantity rather than quality. Simply counting the number of activities does not account for their effectiveness or the actual change they drive within the organisation. For example, reporting that 50 training sessions were conducted does not reveal whether employees found them helpful or if they led to improved performance.
  3. Number of impacts or stakeholders impacted: Again, using a numerical way to indicate progress can be very misleading, or unmeaningful.  This is because it may be ‘interesting’ but with no real action for your stakeholder to take in order to somehow lead to a better overall change outcome.  If metrics do not result in some kind of action, then over time it will not shape your change(s) toward the targeted outcomes.   Or worse, your stakeholders may lose interest and lose confidence in the strategic impact of these metrics.
  4. Another common way to report change metrics is to use the number of impacts or number of stakeholders impacted by the organizational change.  This can be in terms of the following:
  5. Number of divisions impacted
  6. Number of stakeholder groups impacted
  7. Number of employees impacted
  8. Number of initiatives per division/stakeholder

Metrics That May Be Too Operational

Metrics that are overly operational can fail to capture meaningful progress or adoption.  Perhaps if the metric are for reporting within the Change Management team that may be OK.  However, when you are showing metrics to stakeholders, a different set of expectations should be cast. 

If you are presenting metrics to senior managers, you need to ensure that they hit the mark for that audience group.  If the group is more interested in strategic impact, and higher level progress outcomes, you need to tailor accordingly.

Examples of metrics that may be too operational include:

  1. Number of Communications Sent: This metric measures activity but not effectiveness. Sending numerous emails or messages does not guarantee that the message is received, understood, or acted upon by stakeholders. For instance, stakeholders might receive 100 emails, but if the content is unclear, the communication effort is wasted. Or worse, the emails may not even have been read.
  2. Number of Training Sessions Attended: This one is a classic. While training is crucial, the number of sessions attended does not necessarily reflect the attendees’ understanding, engagement, or the practical application of the training. For example, employees might attend training but not apply the new skills if the training is not relevant to their roles for various reasons.
  3. Number of workshops/meetings: Another way of articulating the change management progress in terms of activities is the number of workshops or meetings conducted with stakeholders including focus groups to indicate employee engagement.  Again, this may be good to track within the change management team.  However, presenting this metric to stakeholders may not be appropriate as it may not meet their needs nor indicate change management success. 
  4. Number of changes: This may be a common way to report on changes planned, but it doesn’t really inform the extent of the change. One change can be significantly impactful whilst another does not have major stakeholder impacts and are more system impacts. Listing number of changes may be deceiving or misleading. This kind of data may not get you the level of acceptance targeted.

To read more about reporting to executives or senior managers, check out our Ultimate Guide to Change Management Reports Your Executives Want to See.

The Importance of Effective Data Visualization

The way metrics are presented is just as important as the metrics themselves. Poor visualization can lead to misinterpretation, confusion, and misguided decisions. Here are some common pitfalls to avoid:

Ineffective Use of Pie Charts

Pie charts can be misleading when used to show data points that are not significantly different. For example, using a pie chart to represent the percentage of divisions impacted by a change might not effectively communicate the nuances of the impact if the differences between the divisions are minimal. A pie chart showing 45%, 30%, and 25% might not convey the critical differences in impact levels among divisions.  

Misleading Traffic Light Ratings

Using red, amber, and green to indicate high, medium, and low impacts can send the wrong message. Stakeholders might associate these colours with good and bad outcomes rather than understanding the actual levels of impact.  Stakeholder may be used to interpreting these in the context of their usual project or business updates where red indicated alarm and ‘bad’. This can lead to unnecessary alarm or complacency. For instance, a green rating might suggest no need for action, while in reality, it might require ongoing monitoring.

Overuse of Colours

Using too many colours in charts and graphs can overwhelm stakeholders, making it difficult to discern the key message.  Using colours in data visualisation can be two-edged sword.  Colour can effectively point your stakeholders are the area where you want them to focus on.  But, too many colours can lose your audience. A cluttered visual can obscure the critical data points and lead to misinterpretation. For example, a graph with ten different colours can confuse stakeholders about which data points are most important.
8e98e632 0540 45a7 Acce B1972a737898

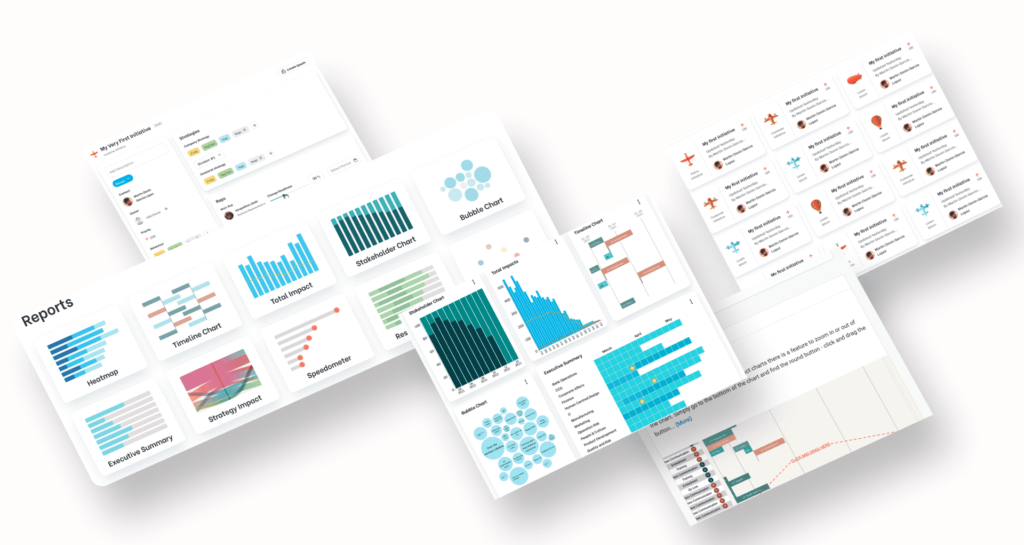
Data visualisation tools are also important. A lot of people use Power BI which works for a foundational level of charts. For tailored charts, specifically designed to to influence stakeholders to clearly see certain angles of risks and opportunities leverage tools such as Change Compass.

Practical Takeaways for Senior Change Managers

To ensure that change management metrics are effective and take into account best practices practices, consider the following practical takeaways:

Align Metrics with Key Stakeholder Perspectives

  1. Understand Stakeholder Priorities: Engage with stakeholders to understand their business goals, priorities and concerns. Tailor your metrics to address these aspects directly. For example, if stakeholders are concerned about operational efficiency, focus on metrics that reflect improvements in this area.
  2. Use Business Language: Frame your metrics in a way that resonates with business stakeholders. Avoid change management jargon and reference, and ensure that the implications of the metrics are clear and actionable. For example, instead of using technical terms, explain how the metrics impact business outcomes.  Think in terms of business activities, milestones, busy periods, and capacity challenges.

Focus on Meaningful Metrics

  1. Measure Outcomes, Not Just Activities: Change leaders should prioritize metrics that reflect the outcomes and impacts of change indicate level of knowledge, rather than just the activities performed as a part of change management KPIs. For example, instead of counting the total number of employees attending change management training sessions, measure the improvement in employee performance or knowledge retention post-training.
  2. Example: Instead of reporting that 100 employees attended training sessions, report that 85% of attendees showed improved performance in their roles after training, or that certain level of competencies were gained. Note that quantifiable metrics have more impact on the audience.
  3. Track Engagement and Adoption: Monitor metrics that indicate the level of engagement and adoption among stakeholders or their perception of the change. This could include surveys, feedback forms, or direct measures of behaviour change and the overall success rate of the change.
  4. Example: Use post-training surveys to measure employee confidence in applying new skills or managerial rating of application of learnt skills rather than employee satisfaction of the training sessions using satisfaction scores. Track the percentage of employees who actively use new tools or processes introduced during the change.
  5. Example: Instead of reporting that 100 employees attended training sessions, report that 85% of attendees showed improved performance in their roles after training, or that certain level of competencies were gained.
  6. Example: Use post-training surveys to measure employee confidence in applying new skills or managerial rating of application of learnt skills. Track the percentage of employees who actively use new tools or processes introduced during the change.

Improve Metric Visualization

  1. Simplify Visuals: Use clear, simple visuals that highlight the key messages. Avoid clutter and ensure that the most important data points stand out.
  2. Example: Use bar charts or line graphs to show trends over time rather than pie charts that can be harder to interpret.
  3. Contextualize Data: Provide context for the data to help stakeholders understand the significance. For example, instead of just showing the number of Go-Lives, explain what each Go-Live entails and its expected impact on operations.  Or better, focus on showing the varying levels of impact on different stakeholders across time within the initiative.
  4. Example: Accompany a Go-Live count with a visual showing the varying impact level of various implementation activities of the changes.
  5. Example: Use bar charts or line graphs to show trends over time rather than pie charts that can be harder to interpret.
  6. Example: Accompany a Go-Live count with a visual showing the varying impact level of various implementation activities of the changes.

To read more about effective data visualisation tips in presenting change data, check out Making impact with change management charts infographic.

Communicate Effectively

  1. Narrative Approach: Combine metrics with a narrative that explains the story behind the numbers as a part of the change management process. This can help stakeholders understand the broader context and implications.
  2. Example: Instead of presenting raw data, provide a summary that explains key trends, successes, and areas needing attention.
  3. Educate your stakeholders: Depending on stakeholder needs you may need to take them on a phased approach to gradually educate them on change management metrics and how you ultimately want them to drive the outcomes.
  4. Example:  You may start the education process to focus on more simplistic and easy-to-understand measures, and as your stakeholders are more change-mature, move to drill into more detailed metrics that explain the ‘why’ and ‘how’ to drive outcome success.
  5. Continuously improvement: Provide regular updates on key metrics and adjust them based on feedback from stakeholders. Continuous communication ensures that everyone remains aligned and informed.
  6. Example: Hold monthly review meetings with stakeholders to discuss the latest metrics, address concerns, and adjust strategies as needed.
  7. Example: Instead of presenting raw data, provide a summary that explains key trends, successes, and areas needing attention.
  8. Example:  You may start the education process to focus on more simplistic and easy-to-understand measures, and as your stakeholders are more change-mature, move to drill into more detailed metrics that explain the ‘why’ and ‘how’ to drive outcome success.
  9. Example: Hold monthly review meetings with stakeholders to discuss the latest metrics, address concerns, and adjust strategies as needed.

D3365dfd A872 4ab2 Bf81 76ac391a1e5a

Examples of Effective Metrics

Employee Adoption and Engagement

  1. Percentage of Employees Adopting New Process/System: This metric measures the rate at which employees are using new processes or systems introduced during the change. High adoption rates indicate successful integration.
  2. Implementation: Use software usage analytics or surveys to track tool adoption rates.
  3. Visualization: A graph showing adoption rates over time.
  4. Employee Feedback Scores: Collect feedback on change initiatives through surveys or stakeholder ratings to measure sentiment/feedback and identify areas for improvement.
  5. Implementation: Conduct regular surveys asking employees about their experience with the change process.  Do note that depending on the change you may expect negative feedback due to the nature of the change itself (vs the way it was implemented).
  6. Visualization: Bar/Line charts comparing feedback scores across different departments or time periods.  Bar/Line charts are the standard go-to for data visualisation.  They are easy to understand and interpret.
  7. Implementation: Use software usage analytics or surveys to track tool adoption rates.
  8. Visualization: A graph showing adoption rates over time.
  9. Implementation: Conduct regular surveys asking employees about their experience with the change implementation process. Do note that depending on the change you may expect negative feedback due to the nature of the change itself (vs the way it was implemented).
  10. Visualization: Bar/Line charts comparing feedback scores across different departments or time periods.  Bar/Line charts are the standard go-to for data visualisation.  They are easy to understand and interpret.

Impact on Business Outcomes

  1. Improvement in Key Performance Indicators (KPIs): Track changes in KPIs that are directly impacted by the change initiatives, such as productivity, customer satisfaction, customer experience, improvement in process inconsistencies or financial performance.
  2. Implementation: Identify relevant KPIs and measure their performance before and after change initiatives.
  3. Visualization: Use line/bar graphs to show trends in KPI performance over time.
  4. Operational Efficiency Metrics: Measure improvements in operational processes, such as reduced cycle times, error rates, or cost savings.
  5. Implementation: Track specific operational metrics relevant to the change initiatives.
  6. Visualization: Bar charts or heatmaps showing improvements in efficiency metrics across different operational areas.
  7. Implementation: Identify relevant KPIs and measure their performance before and after change initiatives.
  8. Visualization: Use line/bar graphs to show trends in KPI performance over time.
  9. Implementation: Track specific operational metrics relevant to the change initiatives.
  10. Visualization: Bar charts or heatmaps showing improvements in efficiency metrics across different operational areas.

To read more about change adoption metrics visit The Comprehensive Guide to Change Management Metrics for Adoption.

Change management effectiveness requires metrics that not only measure progress but also resonate with business stakeholders and accurately reflect the impact of change initiatives. They should provide valuable insights. Avoiding common pitfalls such as relying on easily misinterpreted or overly operational metrics is crucial. By aligning metrics with stakeholder perspectives, focusing on meaningful outcomes, improving visualization, and communicating effectively, senior change and transformation professionals can ensure that their metrics truly support the success of their change initiatives.

The top change management metrics to avoid are those that fail to provide clear, actionable insights to business stakeholders. By understanding and addressing the disconnect between change managers and business stakeholders, and by prioritizing metrics that truly reflect the impact and progress of change, you can drive more effective and successful change management efforts by influencing your stakeholders in your organisation.

As a next step, Chat with us if you would like to discuss more about leveraging AI and technology to generate high-impact change management metrics and data for your stakeholders, both at project and portfolio levels, using data visualisation tools.

Change Management Adoption Metrics: The Complete Tracking Framework (With Dashboard Template)

Change Management Adoption Metrics: The Complete Tracking Framework (With Dashboard Template)

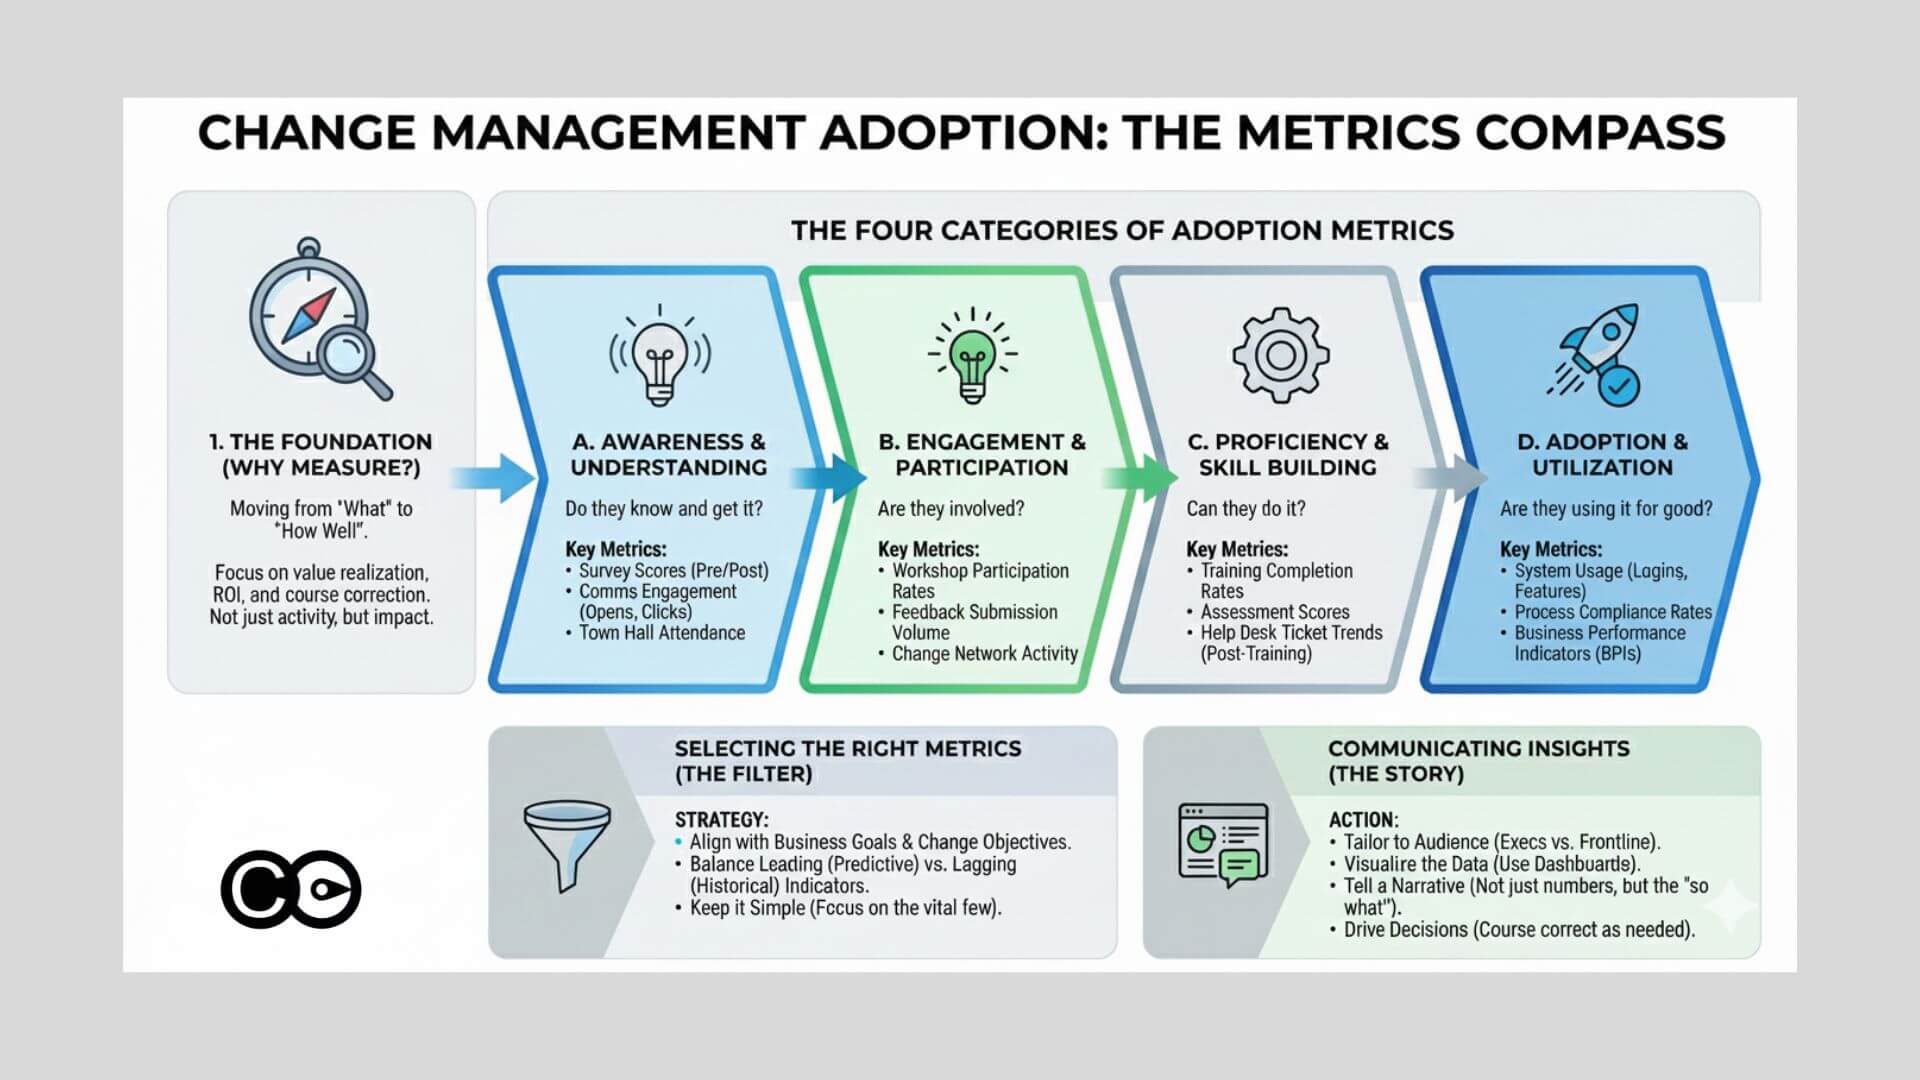
Change adoption metrics are the usage, proficiency, sustainment and outcome indicators that show whether people are working differently after a change, not merely that the change was delivered to them.

The average organisation uses only 54% of the software licences it pays for, according to Zylo’s 2026 SaaS Management Index, which is the adoption problem in one number: Access is not use. The same gap runs through change programmes. A project can report full training attendance, every account provisioned and a green status, while the new process is used for the easy cases and bypassed for the hard ones.

This article is for change, HR and transformation leaders who already know they should measure adoption and need to decide what, exactly, to put on the page. It argues that credible adoption evidence rests on four families of metric (usage, proficiency, sustainment and outcome), that each family fails in a predictable way when read alone, and that the skill is in reading them together. By the end you will be able to choose a short, defensible metric set for a given initiative and interpret it without overclaiming. If you need the method for collecting this data, see our guide to how to measure change adoption; for the wider framework, start with the ultimate guide to measuring change.

The four families of adoption metric

An adoption metric is any measure of what people do after the change that can be tied to a specific behaviour the change requires, and the strongest sets combine usage, proficiency, sustainment and outcome measures.

Prosci’s research gives practitioners a useful starting taxonomy. It describes speed of adoption, ultimate utilisation and proficiency as the core measures once people have reached the ability stage: How quickly people begin to use the change, how many are using it, and how well they apply it. We add two more families, because a programme that stops at those three cannot answer the questions executives actually ask later.

  • Usage: Are the intended people using the change, how often, and how fully? (Speed of adoption and ultimate utilisation.)
  • Proficiency and behaviour: Are they doing it correctly, in the way the benefit depends on?
  • Sustainment: Does use hold after launch support is withdrawn, or does work drift back?
  • Outcome: Is the business result the change was funded for visibly moving?

Each family answers a different question, and each has a blind spot. Usage can be high while proficiency is poor. Proficiency can be strong in the pilot team and absent elsewhere. Sustainment is invisible if you stop measuring at go-live. Outcomes move for many reasons other than adoption. The rest of this article takes each family in turn and then shows how to read them together.

Usage metrics: Reach, frequency and depth

Usage metrics tell you whether the intended population is using the change, how often and how deeply, and the most common error is treating login counts as evidence of any of these.

B2d0b5ea 4fef 45ff Bb76 561f43c53df6

Gallup’s May 2026 indicator shows how misleading access data can be. Nearly half of US employees (47%) say their organisation has integrated AI tools, yet only 30% use them a few times a week or more and 15% use them daily. Implementation, in Gallup’s words, does not guarantee use. Any programme that reported adoption from provisioning or first-login data would have overstated it by roughly half.

Split usage into three measures, because each exposes a different failure:

  • Reach: The share of the intended population who have used the new process or tool at all, by role and by team. This is your speed-of-adoption view when plotted weekly from go-live.
  • Frequency: How often the people who use it do so, compared with how often the work requires it. A tool needed daily and used monthly is not adopted.
  • Depth: The share of use that happens in the core workflow, measured on the two or three features or steps the benefit depends on, not on every feature.

The depth measure matters most. For a system implementation it might be the percentage of orders created in the new system rather than raised by spreadsheet, or the share of customer records completed to the required standard at first save. For a process change it is the proportion of cases that follow the new sequence end to end. Choose the critical few and ignore the long tail of features.

Read usage by segment, not by average

An enterprise average hides the teams that matter. Report usage by role, location and manager, then look for the lowest quartile. A 78% overall rate that conceals one division at 35% describes a rollout that has succeeded in some places and not started in others, and the response to each is different.

Proficiency and behaviour metrics: Are people doing it right?

Proficiency metrics show whether people perform the new way correctly and consistently, and they are the family most often missing from adoption reports because they require more than system data.

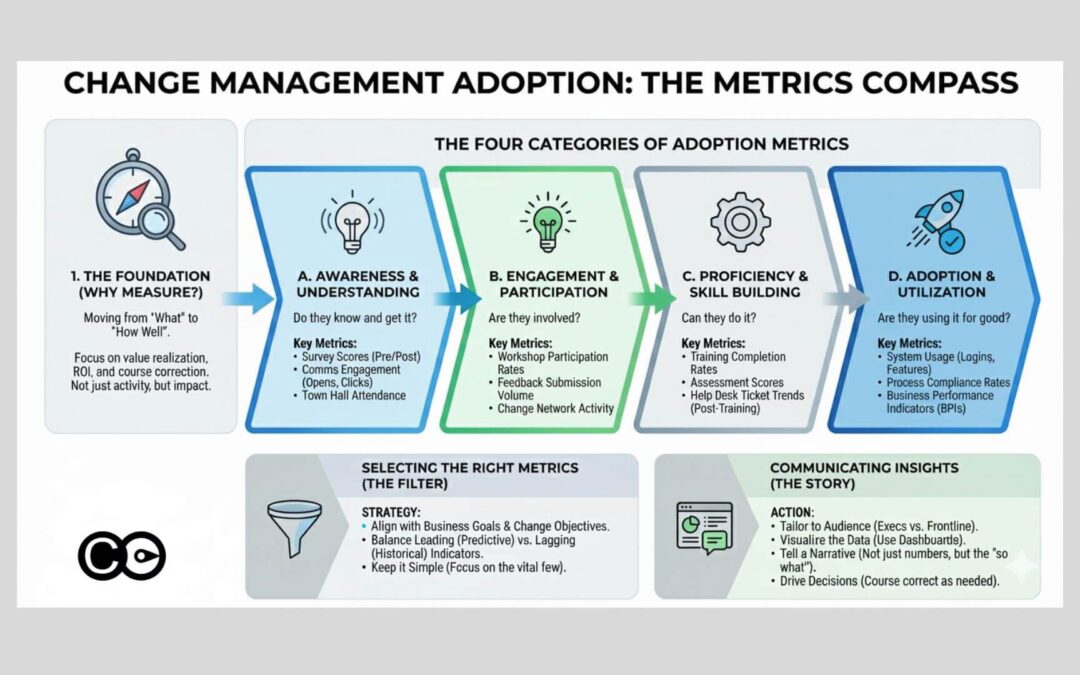
Change management adoption The metrics compass

The gap between use and effect shows up clearly in Gallup’s data. Of employees in organisations that have implemented AI, 65% say it has improved their productivity, but only 14% strongly agree it has transformed how work gets done. Most people have used the tool inside their existing workflow, which is adoption of a sort, but not the changed way of working the investment assumed. Usage metrics alone would have called that a success.

Proficiency is measured through observable behaviours (sometimes called micro-behaviours): The small, specific actions that show the change is embedded. Useful examples:

  • Error and rework rate: The share of transactions returned, corrected or escalated because the new process was not followed.
  • Time to complete a key task against a pre-change baseline, once the learning curve has passed.
  • Workaround rate: The proportion of work still routed through the legacy spreadsheet, email or manual step.
  • Assessed competency: A short practical check or manager sign-off, rather than a quiz on course content.
  • Manager coaching frequency: How often team leaders observe and reinforce the new behaviour. Gallup finds that employees whose managers actively support their team’s AI use are 1.7 times as likely to use it a few times a week or more, and only 36% of employees in AI-integrating organisations strongly agree their manager does.

Behaviour data is cheaper to collect than it sounds if you decide in advance which three or four behaviours the benefit depends on. For a deeper treatment of how behaviours form and hold, see our guide to behaviour change in the workplace.

Sustainment and outcome metrics: Does it last, and does it pay?

Sustainment metrics test whether adoption survives after launch support ends, and outcome metrics test whether the benefit the change was funded for has actually arrived; reporting neither leaves the programme unable to prove its value.

Most of the value in a change is realised, or lost, after the programme team has moved on. BCG’s 2025 analysis of transformation concluded that only about a quarter of transformations successfully create value, which is a reminder that delivery and realisation are different events. Go-live is the start of the measurement window, not the end.

Sustainment indicators

Re-measure the same usage and proficiency indicators at fixed intervals after support ends (30, 90 and 180 days is a workable pattern) and add one specific measure:

  • Reversion rate: The share of work, by team, that has returned to the old process or an unapproved workaround.
  • Stability of use: Whether each team’s usage is flat or rising without fresh intervention. A decline that begins when champions or project staff withdraw points to a reinforcement gap, not a design flaw.
  • Support demand: The trend in help requests per user. A fall followed by a rise often signals a second wave of problems as edge cases appear.

Outcome indicators

Outcome metrics connect adoption to the business case: Cycle time, cost to serve, error cost, compliance incidents, customer satisfaction, or revenue per seller, depending on the change. Their discipline is attribution. Where possible compare adopting teams with lagging ones, or a team before and after it reached a stable usage level, rather than reading a portfolio-wide trend that moves for many reasons. Where you cannot isolate the effect, say so in the report. Our guide on the problem with change management metrics covers the most common ways outcome claims overreach.

Choosing metrics by change type

The right adoption metrics depend on what the change asks people to do, so start from the target behaviour and pick the two or three metrics in each family that evidence it.

A system implementation turns on depth of use in the core workflow. A compliance change turns on observed behaviour and incident trends, because logins say nothing about whether the rule is followed. A restructure has few clean usage measures, so engagement, role clarity and collaboration patterns carry more weight, though these are better described as readiness and outcome indicators than adoption in the strict sense.

MetricSystem implementationCompliance changeRestructure
Reach and active-use rateHigh priorityModerateLow
Feature or workflow depthHigh priorityLowLow
Process compliance rateModerateHigh priorityModerate
Incident or error rateModerateHigh priorityLow
Manager observation or coachingModerateHigh priorityHigh priority
Assessed proficiencyModerateHigh priorityModerate
Engagement or clarity pulseLowModerateHigh priority
Reversion rateHigh priorityModerateModerate
Productivity vs pre-change baselineHigh priorityModerateHigh priority

How many metrics is enough?

Aim for a core set of 8 to 15 metrics per initiative, grouped under the four families, with only the handful that answer the sponsor’s question reported upward. Include a metric only if you can name the decision it would change and you can collect it reliably at the cadence you need. Mix system data with at least some observation or survey data, because system logs cannot tell you why a team is lagging.

How to read the numbers together

Adoption is established when usage, proficiency and sustainment point the same way, and every divergence between them is a diagnosis waiting to be made.

Read the families as a set and look for the patterns below.

What you seeLikely meaningWhere to look
High reach, low depthPeople log in but bypass the core workflowProcess design, training on the critical steps
High usage, low proficiencyUse without the intended behaviourCoaching, job aids, manager reinforcement
Strong pilot, weak elsewhereLocal conditions, not a general resultTeam-level segmentation, champion coverage
Good at go-live, decline at 90 daysReinforcement withdrawn too earlySustainment plan, manager accountability
Good adoption, no outcome movementWrong behaviour targeted, or benefit case flawedRevisit the benefit logic

Leading and lagging indicators

Treat reach, frequency and early proficiency as leading indicators: They move first and can still be acted on. Treat reversion, incident rates and outcome measures as lagging: They confirm or contradict the story weeks later. Report both, and set thresholds in advance (for example, 70% reach in the target population by week six) so that a number triggers a decision rather than a discussion about whether it is good.

Make the data visible where decisions happen

A metric set earns its keep when managers and sponsors see it regularly. Spreadsheets and BI tools work for a single programme, but they struggle once an organisation runs many changes at once and needs a consistent view by team. Digital change platforms such as Change Compass bring adoption and impact data for multiple initiatives into one view, so leaders can see where adoption is lagging by team without rebuilding the report each month. For the layout of such a view, see our guide to designing a change adoption dashboard.

Where to start next week

Pick one live initiative and write down the two or three behaviours its benefit depends on. For each, name one usage metric, one proficiency metric and a sustainment check at 90 days, then agree with the sponsor what level would count as adopted. That small set will tell you more than a dashboard of twenty indicators, because every number on it is tied to a behaviour and a decision. Retire any existing metric that nobody acts on, and add the outcome measure only once you can say how you will separate the effect of adoption from everything else that moved. Revisit the set after the first reporting cycle: If two metrics always move together, keep the cheaper one. The aim is not a complete picture of the organisation but a trustworthy answer to one question, whether people are working differently and whether it is lasting.

Frequently asked questions

What are the most important change adoption metrics?

The most useful set covers four things: Usage (reach, frequency and depth of use), proficiency (whether people perform the new way correctly), sustainment (whether use holds after launch support ends) and outcome (whether the intended benefit is showing up). Prosci frames the first three as speed of adoption, ultimate utilisation and proficiency. No single metric is enough, because each can look healthy while another is failing.

What is the difference between adoption, utilisation and proficiency?

Adoption is the point at which people start using the change, utilisation is how many of the intended people keep using it and how fully, and proficiency is how well they perform with it. A team can show 95% utilisation and low proficiency if people use the new system but work around its intended process. Measure all three separately.

How many adoption metrics should we track for one initiative?

Most initiatives are well served by a core set of 8 to 15 metrics, grouped under usage, proficiency, sustainment and outcome, with only a handful reported to executives. More than that dilutes attention and turns data collection into a burden. Choose metrics tied to the specific behaviour the change needs, and drop any you cannot act on.

Are system logins a good measure of adoption?

Logins show access, not adoption. Gallup’s May 2026 data shows 47% of US employees say their organisation has integrated AI tools, yet only 30% use them weekly or more. Track feature use in the core workflow, the share of work processed the new way, and proficiency, and treat logins only as a first signal.

How do you know whether adoption has been sustained?

Check the same usage and proficiency measures at 30, 90 and 180 days after launch support ends, and watch the reversion rate: The share of work that returns to the old process or a workaround. Sustained adoption shows as stable or rising use in each team without extra intervention. A drop after support ends usually points to a manager reinforcement or process design gap.

References

This guide focuses on tracking adoption, what people are actually doing with the change. Three closely related guides on this site each cover a distinct angle, pick the one that matches what you need now:


Enterprise Change Management Structure: Centralised, Federated, or Hybrid?

Enterprise Change Management Structure: Centralised, Federated, or Hybrid?

An enterprise change management organisational structure defines who owns change capability, who delivers individual change programmes, and how authority and resources flow between them. The three common models are centralised (a single enterprise team owns all change delivery and methodology), federated (a central centre of excellence sets standards while embedded practitioners deliver in each business unit) and hybrid (a small central team plus delivery partners and on-demand specialist resources). The right choice depends on portfolio scale, organisational maturity, and how much variation each business unit needs in how change is delivered. None is universally correct, but the wrong choice creates friction and slowed adoption.

Exploring Organisational Structures for Optimal Enterprise Change Management

Change is an inherent part of every organization’s journey towards growth and adaptability in an ever-evolving business landscape. In the realm of change management, one critical consideration is the organisational structure or design that best facilitates successful enterprise change management. There are plenty of different ways to structure change management practices. Like any type of organisational structures for organisations overall, there is not one way that is the most effective. It depends on the circumstances of the company in concern.

Centralised Change Management Structure

Centralised change management structures consolidate the authority, decision-making, and oversight of strategic change management initiatives within a single, dedicated team or department. In such a structure, the change management team sometimes reports directly to either Strategy or Office of the CEO. This approach provides the change practice significant influence due to its direct linkage with strategy. Reporting Lines: HR, IT, Strategy, and More In addition to the choice between centralised and federated structures, change management specialists (and the senior leaders that they report to) often grapple with determining the optimal reporting lines for their change teams. Several departments within an organisation are typically considered for hosting the change management function: 1. Human Resources (HR or People & Culture) Reporting to HR aligns cultural change management with employee engagement and organisational development, which is essential for enhancing a company’s culture. This can be particularly effective when change initiatives heavily impact the workforce, as HR possesses expertise in people-related matters. 2. Information Technology (IT) With the increasing digitalization of business processes, reporting to IT can ensure that complex technology-driven changes, including the introduction of new technology and digital transformation, as well as improvements in product offerings, are well led and managed across the enterprise. The remit for change practices reporting to IT can range from including just technology changes, to all strategic and funded initiatives, through to all of change management as a function. 3. Strategy or Transformation Office Reporting to the strategy or transformation office closely ties change management to the organization’s overarching strategic goals. This alignment ensures that change initiatives are directly linked to long-term vision and objectives. 4. Operations For a lot of organisations, the Operations function can determine a lot about how the organisation is run. This can include the change management function as well. The advantage of having the change practice reporting to Operation can mean that the operating rhythm of the organisation can be designed with the right change management approaches to support business goals. The way employees are engaged, how they’re involved, and how BAU processes are run, measured, and reported can be designed with change management interventions. Key benefits of a centralised structure include:
  1. Consistency: Centralised control ensures consistent change management practices across the organisation, reducing confusion and increasing effectiveness in terms of setting a common level of practice.  Consistency in terms of language and concepts mean that it is easier for the business to adopt change management principles and practices.
  2. Resource Allocation: Easier resource allocation, as the centralised team can prioritize and allocate resources based on organisational priorities.  With better economy of scale for a larger centralised team, the change group has the opportunity to resource initiatives using different levels of involvement, from sessional, part-time to full-time.
  3. Alignment: Enhanced alignment with the organization’s strategic objectives, as the change management team directly interfaces with top leadership.  This means that effort and focus areas as more likely to be on that which is most strategic and can impact the organisation the most.
  4. Change maturity.  The change practice has the opportunity to focus on building organisation-wide change maturity due to its ability to interface and influence across the organisation.  While other change management structures may also have the ability to focus on building business change maturity, a centralised function has the advantage of having a greater impact level due to its scale.
To read more about developing change maturity visit our article How to implement change process when your business is not change mature, and A New Guide for Improving Change Maturity.
Federated change management structure

Federated Change Management Structure

In contrast, federated change management structures distribute change management responsibilities throughout various business units or departments. Each business unit maintains its own change management team, and these teams collaborate to execute change initiatives. Typically, these teams report to their respective department heads.  This means that there is no formal enterprise change management function. The advantages of a federated structure include:
  1. Local Expertise: Greater understanding of department-specific needs and challenges, leading to tailored change strategies and therefore better change outcomes.  Different business units can have very different cultures and different business needs.  Having change professionals who understand the various intricacies of the business unit means that they’re able to design change approaches that will better meet business requirements.
  2. Ownership and relationship: There may be increased ownership and commitment among departmental staff, as the change teams sits in the same business unit and are ‘one of them’ versus someone sent from a centralised team.  Others in the business unit may be more conducive to advice and support from a colleague in the same broader business unit.  It is also easier to establish a closer working relationship if the change practitioner is always working with the same teams.
  3. Flexibility: Greater adaptability to changes in individual departments, as they can independently address unique issues.  Without any direction from a central team, the business-dedicated team can better flex their service offering to meet the business unit’s particular focus areas.  Whilst, a central team may de-prioritise departmental-level initiatives to be less critical, for a departmental team it is much easier to flex toward their priorities.

Impact on Business Results

The choice of change management structure and reporting lines can significantly impact an organization’s overall business results. Here’s how different structures can yield varying outcomes:

Centralised Structure Outcomes

  1. Efficiency: Centralised structures can excel in efficiency of delivery due to its scale of economy.  Whereas small departmental change teams may structure to flex and resource projects efficiently, larger change practices can avoid this by leveraging its range of practitioners with different levels of skill sets and availability.
  2. Consistency: They ensure a consistent approach to change management, reducing confusion among business stakeholders and employees.  The consistency of standards also mean that there is less risk that initiatives may experienced a change intervention that is less effective due to the centralised capability standards reinforced.
  3. Top-Down Control: Change initiatives are closely aligned with strategic objectives set by top leadership.  This means that any ‘pet projects’ or less prioritised divisional initiatives may not be as likely to be granted change management support.  This does not necessarily mean that those departments won’t focus on those initiatives, it just means that change management resources are more prioritised toward what top leadership deems to be most critical.

Federated Structure Outcomes

  1. Local Engagement: Federated structures promote local ownership and engagement, fostering a sense of responsibility among departmental staff.  Department-specific change practitioners will be more familiar with ‘what works’ at the department level. They are better able to leverage the right engagement channels and have the ability to access management and leadership roles at the department to garner support and drive overall initiative focus and success.
  2. Adaptability: They allow for greater adaptability to unique departmental needs, which can be crucial in complex organisations. For example, the types of change management approaches and interventions that work for Sales organisations will be very different compared to that for call centres or processing centres, especially as employees transition into new roles. The ability for the change practitioner to adapt locally, supported by a strong company culture, can make or break an initiative’s success.
  3. Innovation: Different units can experiment with various change approaches, leading to innovative solutions.  This can be done without the confines of what is the overarching ‘standards and guidelines’ from the centralised change team.
Choosing the right structure for enterprise change management

Comparing the three structural models

The following table summarises the key characteristics, strengths, and watch-outs of each structural approach, to help guide your decision.
Characteristic Centralised Federated Hybrid
Decision-making Central change team leads all decisions Business units lead locally Shared between centre and BUs
Consistency of practice High Variable Moderate to high
Responsiveness to local needs Low High High
Resource efficiency High (no duplication) Lower (distributed resourcing) Moderate
Best suited to Regulated industries, enterprise-wide programmes Diverse business units, decentralised orgs Large complex organisations with varied change types
Key risk Becomes a bottleneck; perceived as disconnected Inconsistent quality; reinventing the wheel Role clarity issues; governance complexity

Choosing the Right Structure

The decision regarding the optimal change management structure should be rooted in the organization’s specific context, culture, and the nature of the changes it is undergoing to establish a new status quo. Experienced change management specialists understand that a “one-size-fits-all” approach does not exist. Instead, they carefully consider the organization’s goals, resources, and capacity for change. Also, it may not need to be either centralised or federated model.  It can be a combination of both.  For examples:
  1. A federated model by reporting lines, however with a strong community of practice that is centralised and that promotes sharing of practices, standards, and even resources.  This ensures that the overall group is connected to each other and new innovative approaches can be shared and proliferated
  2. A centralised model by reporting lines, however with dedicated business-specific change partners that are focused on particular business units so that they are delivering business-focused change solutions.  At the same time, the team still maintains a lot of the advantages of a centralised team.
The organisational structure and reporting lines for a change practice may influence various aspects of its work, however, this may not be the most critical part of how it creates value for the organisation.  Other aspects in which a change practice should focus on in its development include:
  1. Resourcing model.  How to fund change management resources and the service delivery model to support a range of different projects with different needs for seniority, skill set, and even organisational tenure
  2. Change methodology/framework.  Organisations should work on at least a change management framework to set a minimum standard for change delivery.  Using a generic off-the-shelf methodology may be OK, however they may not cater for the particular language and business needs of the organisation.
  3. Change capability and leadership.  Outside of project change delivery, the team should also work on gradually building change capability within the organisation to enhance the ability to drive and support change.  This may not need to be in the form of training, it can also be done through structured development through real change projects.
  4. Change portfolio/Enterprise change management.  Beyond individual change delivery, the change team should also focus on how to deliver and land multiple initiatives at the same time.  Most organisations need to drive change at a faster speed than previously and there is no luxury to only focus on one change at a time.  How the team measures, tracks, and ‘traffic controls’ the multiple initiatives is crucial for its success.
To read more about managing a change portfolio visit our Change Portfolio Management section for a range of articles. Change management structures and reporting lines are not just administrative choices; they can, in some ways, have a profound impact on an organization’s ability to achieve successful change outcomes. Experienced change management specialists must weigh the benefits and drawbacks of centralised and federated structures and align them with the specific needs of their organisation. By doing so, they can maximize their ability to navigate the complexities of change and drive the organisation toward a more agile, resilient, and adaptive future.

Frequently Asked Questions

What is the best organisational structure for a change management function?

There is no single best structure – the right model depends on the size of the organisation, the volume and complexity of its change portfolio, and the maturity of its change management capability. The four most common models are: centralised, federated, centre of excellence, and hybrid approaches combining elements of each.

How many change managers does an enterprise need?

A common rule of thumb for large organisations undergoing significant transformation is one dedicated change manager for every two to three major change initiatives running concurrently. A change portfolio management tool that tracks change impact and capacity can help quantify the actual demand on change management resources and build a more evidence-based staffing case.

Should change managers be embedded in project teams or centralised?

Both approaches have merit. Embedded change managers develop stronger stakeholder relationships. Centralised change managers develop broader organisational perspective and can manage cross-initiative dependencies more effectively. Many mature change functions use a hybrid model.

Behaviour Change in the Workplace: A Practical Guide for Change Leaders

Behaviour Change in the Workplace: A Practical Guide for Change Leaders

Behaviour change in a workplace context is the process by which employees, leaders and teams replace existing routines, decision habits and ways of working with new ones in service of a business goal. It is the most difficult layer of any change initiative, because it requires sustained effort after the technical or process change has been delivered. Effective behaviour change relies on more than communication and training. It depends on a clear specification of the target behaviour, the right environmental cues and incentives, peer norms that reinforce the new way, and reliable feedback loops that confirm the behaviour is producing the intended result.

How to Change Behaviour in the Workplace: A Complete Guide

In almost every change initiative there is an element of behaviour change. For some initiatives, the behaviour change in adopting a new habit required is large and complex whilst for others it can be as small as pressing different buttons and using a different user interface. Effective behaviour change, including incorporating new procedures, is one of the most critical outcomes that the change practitioner can hope to achieve. With the achievement of desired behaviours come the ultimate benefit associated with an initiative. On the other hand, not achieving the behaviour change targeted means that the change has not succeeded.

Given the importance of behaviour change in every initiative this article aims to cover key aspects of how a change practitioner should approach and design the behaviour change. Yet, successfully designing and implementing behaviour change is one of the most challenging tasks for the change practitioner. It is common place that many change practitioners do not have the experience to know how to achieve successful behaviour change.

The definition of behaviour change

So what is behaviour change?

Behaviour change “refer(s) to any transformation or modification of human behaviour”.

This seems like a fairly general definition that is all-encompassing and can include anything ranging from behaviour change in a psychological context or in a social or workplace context.

However, a key part of behaviour change is to recognise that behaviour, by definition, must be observable in some Shape or form. A behaviour can be verbal, non-verbal, or physical behaviour. However, a behaviour cannot be ‘perception’ or ‘thinking’ since these cannot be observed nor displayed necessarily.

Another feature of behaviour change is that the behaviour is to be changed from the current state to a future state. The quantum of the change determines the complexity of the change required and the extent to which a series of change interventions is required to achieve the desired future state. This means, if the behaviour change is easy from the impacted person’s perspective, then the change approach can be fairly light and does not need to be complex. However, if the quantum of the change is large, then a heavy design of change interventions is expected to achieve the outcome.


Be430e87 F926 4699 A479 912f2555a24a


Some examples of behaviour change within a change initiative context includes:

  1. Using a different computer program interface with different layout or keystroke steps in performing tasks
  2. Different process steps required in disclosing financial details in business reporting
  3. Proactive coaching employees through feedback to improve sales effectiveness
  4. Reporting on risk incidents that are not compliant with company standards
  5. Actively establishing rapport with the customer to demonstrate empathy by acknowledging their feelings and demonstrating effective listening
  6. Speak up against bullying behaviours amongst colleagues

The importance of focusing on behaviour change

Inexperienced change practitioners will normally just followed the standard cookie-cutter approach of filling out the various change templates such as stakeholder matrix, change impact assessment, and a change plan. And then proceed to develop a communications plan or a learning plan as a part of experiential learning before executing on implementation.

So what is wrong with this?

As called out previously, in almost every change initiative there is a set of desired behaviours required to achieve the end state of the change initiative. The job of the change practitioner is to figure this out and design a change program around the achievement of these behaviours. Just by filling in templates and carrying out standard change approaches will most likely not achieve the targeted behaviours.

For example, in transitioning users from an old ERP system to a new digital system with a new look and feel, it is critical to identify the core behaviours required in the new state. Is it that in using the new digital system the user has access to a lot more timely data and therefore the behaviour change needs to be around 1) proactively checking for data and derive insights and 2) use these insights and data to make better decisions.

This means that if you were to just focus on communicating the change and train employees on how to use the new digital system, the whole project may not be deemed to be successful. This is because it is simply a project of ‘installation’ of a new system. However, the benefits targeted by the new digital system is about employees gaining more insights through the ability to easily access a range of data previously not available. Employees may know how to use the new system but it does not mean that they will automatically exhibit these desired behaviours.

One of the tricky things about behaviours is the ‘knowing’ vs. ‘doing’ conundrum. Just because someone knows how to do something it does not mean they will necessarily do it. Just because there is a pedestrian path, it does not mean that everyone will always use it. In a similar way, just because someone knows that the company wants him/her to document sales activities, it does not equate that all sales people will document all sales activities. In fact, in practice, we know that spending time on ‘admin’ such as documenting and entering sales activities into a system is often the last thing sales people want to do.

In the next section we will cover how to drive behaviour change.

How to achieve behaviour change


9d55c996 2460 422b A79a 80bab42dcb6d


BJ Fogg model

Dr BJ Fogg is a Stanford professor who founded the Behavior Design Lab at Stanford University. BJ Fogg also wrote the New York Times bestseller ‘Tiny Habits’. What I love about this is that the Fogg model is incredibly simple and practical. It is grounded and backed up by significant empirical research and not just an ‘opinion’.

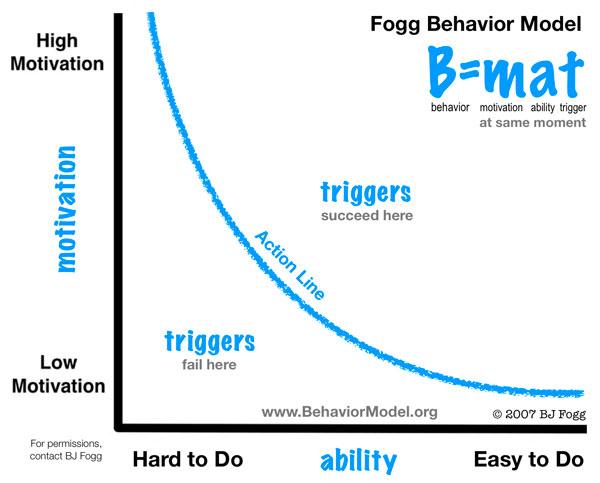
The Fogg model highlights 3 key elements that must converge at the same time for a behaviour to occur.

1. Motivation – Different motivators have different impacts on behaviour

2. Ability – This refers to how easy it is to undertake a behaviour. Some characteristics include time, money, physical effort, brain cycles (or ease of understanding and processing the task at hand), social deviance (the extent to which a behaviour is out of the social norm), and non-routine (behaviour that disrupts an existing routine)

3. Prompt/Trigger – These are reminders of events that prompt a particular behaviour. It could be an alarm, an associated image/event/person/scent, etc that reminds the person of the behaviour.


076b262b 5018 40cf B698 F3447e17ae2b


The power of this model is in its simplicity. You can apply this to any change initiative and the model will guide your thinking on how to design effective behaviour change. When something feels easy to do (low ability), then it will not require a lot of motivation to do it. Alternatively, when something is perceived as very hard to do, then it will require very high motivation to understate the behaviour. The key is to aim above the line. So, either focusing on increasing ability or increasing motivation will result in above the curved line, which means the behaviour taking place.

Example of applying the Fogg model

Case: You are implementing a cost cutting exercise due to the impact of Covid on the organisation. As a result of this exercise, the impacted employees will need to pick up parts of the roles of others who have been let go. The behaviour change required is that impacted employees will need to cover a broader set of tasks and at times have a heavier workload as a result.

Application:

Motivation: The impacted employee’s motivation is currently impacted after seeing their fellow colleagues lose their jobs and hence feeling worried that their jobs may be impacted. This is despite reassurances from senior managers that no more jobs will be cut for the time being. The challenge will be to sufficiently motivate these employees by continuously reassuring them of their job safety and working through the transition of having a broader role responsibility. Appealing to the focus on supporting customers and not letting them down may be a theme to reinforce.

Ability: It is critical to assess to what extent impacted employees are able to carry out new tasks assigned from a skill perspective. Training or coaching may be required. The other area to address is workload concerns. The perception that a heavy workload is required will hinder their likelihood of carrying out the additional responsibilities. Workload prioritisation and protocols are key topics to talk through to reassure employees how workload may eventuate during heavy periods.

Trigger: Different triggers may be designed to remind and reinforce the uptake of new accountabilities. These may include manager 1:1s, team reporting, open visual display of performance indicators, email reminders, colleague reinforcement/coaching, etc.

According to the Fogg model if the new accountabilities are significant it would be best to break these down into smaller behaviour increments vs a ‘big bang’ transition. It could be that there is a gradual transition whereby a period of continuous coaching is required after gradually introducing new sets of tasks for the employee to uptake and practice. After the transition period is completed, the employee then formally uptakes on the full accountabilities.

According to research findings, it is much easier to adopt the new behaviours if the discrete behaviours are broken down to small increment behaviours. Fogg has used lots of different examples of this one of which is doing push-ups. He started by doing 10. Then he would add 1 more every day to the push-up exercise, eventually getting to 100 push-ups. Adding a trigger to the new behaviour is also critical. For example, Fogg gave the example of doing sit-ups first thing in the morning as soon as you get up or doing pushups after going to the toilet. The event of getting up or going to the toilet then becomes a trigger for the new behaviour.


Bdfe1477 613b 4d25 Bd14 Fc94b1e613ef


Cognitive Behavioural approaches to behaviour change.

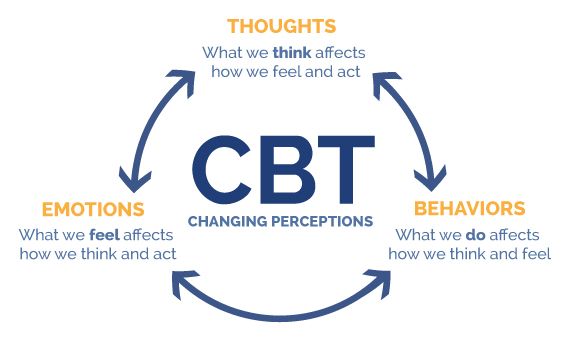
Cognitive behavioural therapy is a widely established clinical approach to changing behaviours in patients suffering from various psychological conditions or disorders. Cognitive approaches are based on the fact that the way one thinks determines one’s reaction and therefore one’s behaviour. For example, self-talk is a mechanism to change one’s opinion or perception. Constantly reinforcing and verbalising positive statements about oneself may improve one’s own perception of oneself. Alternatively, constant negative self-talk leads to negative self-perception.

Behavioural approaches are based on research that started with Pavlov’s research on dogs where he associated bells as a trigger for food. After a period of time, every time the dogs heard the bell they would start salivating, with salivating being the behaviour. This process of associating a trigger with a behavioural reaction is also called ‘conditioning’. The process of conditioning is to ‘re-program’ the subject so that a new behaviour is introduced in reaction to a trigger.

There are many ways in which cognitive behavioural approaches may be applied to changing a person’s behaviour. For example, lets use the previous example of implementing a new system.

Creating or changing impression of the new system

A communications campaign may be devised to create or change the existing impression of the new system. This would be similar to any marketing campaign that associated particular imagery or messages with a feeling or impression. Over a period of repetition, the employees will start to associate positive impressions and key messages with the new system. Any tag-lines that are reinforced by manager briefings or town hall sessions would also act the reinforce the same messages.

As a part of the formal training for the new system, it could be that other than learning the ins and outs of operating the new system, the employee needs to be more proactive in looking at customer information to provide more value-add suggestions to the customer. Practices during the session, along with small nudges and subsequent reinforcements by the team leader or manager, through a corporate social learning platform, would act to build the behaviour change.

The trigger for new behaviours could be any acronyms, diagrams, tag lines, or pictures, and short videos and infographics created as a part of the campaign or training content. It is however important that there is a period of positive reinforcement or else the behaviour may not occur. The reinforcement may take form in terms of manager support, communication messages, prizes, competitions, and reporting on behaviour progress.

This is why post-release embedment is so important as the embedment process focuses on constantly reinforcing the behaviour so that it becomes second nature. Without this, the newly acquired behaviour will not be sustained. This is like exercise. Exercising a few times and your body starting to get the drift of what to do is just the start of the change. Without a period of constant exercising, it will not become a habit.

The other important cognitive behavioural approach to embedding new behaviour is ensuring adequate and effective social support. Some employees may be quite self-sufficient and are able to resolve any system issues themselves. Others may require a lot more hand-holding. This is why there must be change champions in place who can coach and support employees, as highlighted by social learning theory, as an effective way to support the right behaviours and resolve any obstacles in adopting the new system fully.


1797d206 A824 421b A9d4 36959fa99b8b


How to measure behaviours

Measuring behaviours is absolutely critical because without effective measurement it is difficult to ascertain to what extent the desired behaviours have been obtained and sustained. It is the old adage “What gets measured matters”.

So what are some of the ways in which to measure behaviours? These are some common examples.

  1. Manager rating based on observation
  2. Video recording
  3. Phone/call listening
  4. Attendance (e.g. training)
  5. Test
  6. System/digital reporting that tracks behaviour in a system
  7. Employee-wide surveys specifically designed to focus on targeted behaviours

What categories in which to measure behaviours?

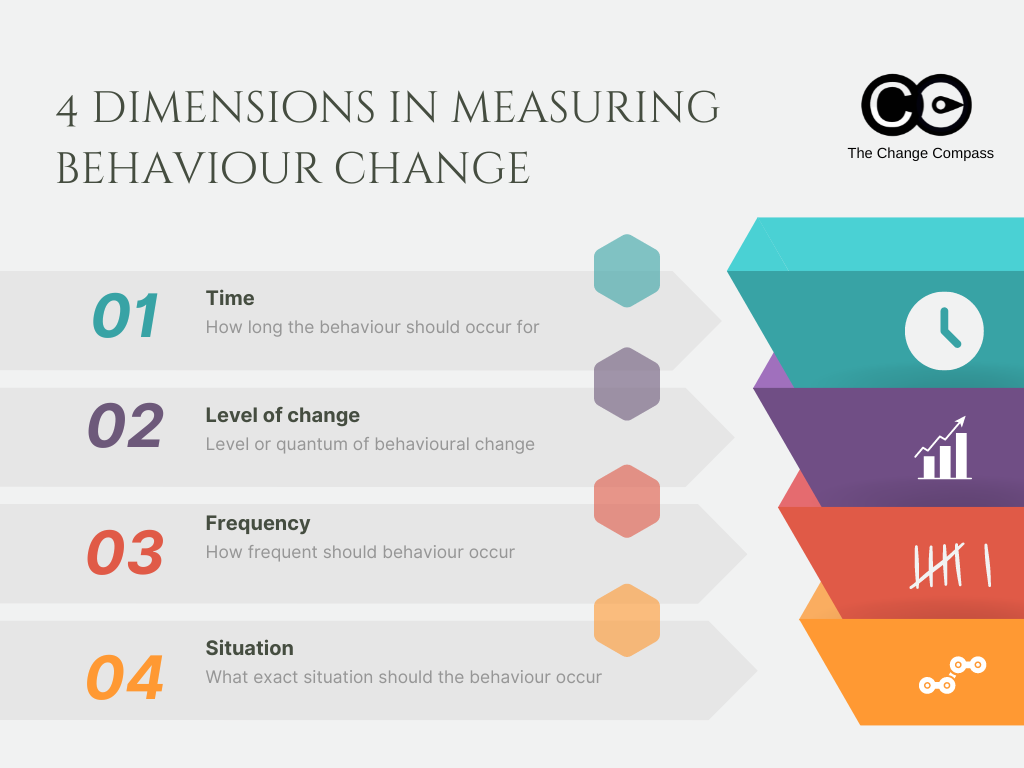
There are many considerations or dimensions in measuring behaviours. The following are some of these:

  1. Time: How long would you want to measure the behaviours to ensure that they have fully embedded and incorporated into business-as-usual. Typical practice is several months after the ‘release’. Tracking reinforces behaviours. This means the longer the tracking mechanism continues – the more likelihood the behaviours will last longer
  2. Level of behaviour change: Is the behaviour being measured black and white in its determination? I.e. is it easy to categories if the behaviour has occurred or not? Or are there different levels of behaviour achievement? E.g. If you are measuring if call centre staff has exhibited behaviour is reviewing customer data and offer suggestions, are there different levels of ‘value add’ behaviours based on customer data, in which case there could be a scale to rate this. Alternatively, it could also be a yes/no type of classification
  3. Frequency: How frequent is the behaviour being displayed? Is it that the goal is to promote the frequency of the desired behaviour? Or are there certain limits expected? For example, if we would like call centre staff to offer value add calls with the customer, are there particular ‘ceilings’ or limited after which it may no longer be valuable for the customer?
  4. Situational considerations: Ranking and classifying behaviours should also always consider situational factors. For example, it could be that the customer was not in the right emotional state to receive value-add suggestions and therefore the behaviour would not be appropriate for that situation. It could also be that the call centre consultant has been suffering from sickness or has been struggling with family difficulties and therefore for a period of time was not performing effectively. As a result, previously acquired behaviours could have dropped temporarily


5407e900 Df3c 4208 81aa 175a201da823


How do we drive full embedment of behaviours?

These are some key call-outs in ensuring that the behaviours you have set out to transition to not only are achieved but are sustained, and to prevent relapse. Pretty much all aspects of change could determine the extent to which behaviours become adopted or not.

1. Executive sponsorship and drive. You will hear a lot of this in literature and articles that with executive sponsorship and drive it is much easier for behaviours to be sustained.

2. Employee community support and reinforcement. This point acts almost as the balancing point of the previous one. With sufficient employee community support and reinforcement, it is possible to drive continual behavioural reinforcement even without strong executive sponsorship.

3. Measurement and reporting. With the right measurement and reporting, employees receive feedback on what their performance has been, and this constant feedback acts as a strong reinforcement feedback loop for managers, training teams, and their direct reports. This is especially the case if everyone can see others’ behavioural performance. It could be by business unit or individual, but ‘naming and shaming’ can work if that is consistent with the organisational cultural values.

4. Early and continuous engagement. This is a change management 101 point. With early and continuous engagement workflow, impacted team members will feel much more engaged with the change. As a result, they will want to exhibit the desired behaviours to make it a success because they feel that they are the ones driving the changes. Alternatively, if the change is perceived as designed and implemented by another party without consultation with the impacted group, there could be resistance or a lack of embedment during the contemplation phase.

5. Culture of continuous improvement. A culture of continuous improvement can also support continual and full embedment of behaviours. If there is a strong culture of analysing the current performance and working on root cause analysis for performance improvement, along with teamwork on appropriate actions to improve performance, then behaviours will be adopted. In this situation, any situational or personal factors or not exhibiting behaviours may be called out and addressed to achieve the targeted outcome.


4b88b6e6 34fe 47a1 Ad67 Fdc16aff3778


Complexity of embedding multiple behaviours across multiple initiatives

Most organisations are implementing multiple initiatives at the same time. This is the norm as organisations stay competitive, stay relevant, and in business. When multiple projects are going on all driving seemingly different behaviours.

How do we embed multiple behaviours?

1. Understand the different behaviours across initiatives. Rather than focusing on every single behaviour driven by every initiative, the key is to capture and record the top few behaviours targeted by each initiative. For large organisations with lots of initiatives, this may seem like an impossible feat. It could be organising 1-2 workshops to capture these behaviours. Do note that different initiatives may be at different stages of the product life cycle and therefore it may not be possible to capture all behaviours at a particular point in time. Having a regular change portfolio meeting where this could be discussed and captured iteratively would be ideal.

The Change Compass has just released a feature to aid the collection of core behaviours across initiatives so that these may be analysed, understood, and linked to aid better implementation alignment. You can tag key target behaviours to each initiative or project. For example, customer-centricity or efficiency. Then you can look through those initiatives impacting one part of the business and the core behaviours being driven across multiple initiatives.

2. Analyse and group the captured behaviours. After compiling the behaviours across initiatives the next step is to group and understand them.

  1. Are there behaviours that are part of the same theme? For example, what are initiatives that are promoting a closer focus on the customer by promoting better listening and empathy skills?
  2. Are there any behaviours that are ‘contradictory’ to other behaviours? Here is a real example. For a bank, one initiative was tasked to retire and close off a particular credit card due to a lack of profitability. However, at the same time, the same team was asked to try and sell more of their business unit head to meet their sales target.


D31410d4 F9e4 4d94 A3e2 E8b3008b0569


3. Examine behaviours that are grouped into the same theme and think of ways to better align and join the dots to improve execution and behaviour embedment. This step is the most crucial step and involves running workshops across initiatives to better align approaches and plan for synergistic implementation of change across initiatives. Key discussion points or opportunities may include:

  1. Aligning key messages and positioning for common behavioural themes. For example, if 2 initiatives are focused on improving customer-centric, how might these better align their communication activities, look and feel of communications collateral, wording, and positioning of behaviours.
  2. Align, cross-leverage and cross-reference learning content. If multiple initiatives are all driving common behaviours, can content be cross-reinforced across multiple initiatives to drive a consistent and aligned user experience? This also ensures that there is no duplication of efforts in covering the same content
  3. Align the sequencing and implementation of change activities. If 2 initiatives are both driving similar behaviours, can the various change activities be better sequenced and aligned to drive a better outcome than 2 separate siloed approaches? For example, can the executive sponsor speak to both initiatives in their town hall address, and can change champions be cross-leveraged to talk about both initiatives to help impacted teams join the dots around the common behaviours?

Successful and fully embedded behavioural change is the epitome of successful change and transformation initiatives. Achieving this is not always easy but having the right focus and adopting a structured approach to design behaviour change will ensure initiative success. Don’t be afraid of experimenting to test different ways in which to drive behaviour change. Keep iterating with different approaches to drive the full adoption of behaviours, which in turn will then ensure the full achievement of initiative benefits.

Read More: A New Guide For Improving Change Management Maturity

Frequently asked questions

What is behaviour change in the workplace?
Workplace behaviour change refers to a sustained shift in how employees perform their roles, interact with systems, or work with others, as a result of an organisational change initiative. The key word is sustained: a behaviour change is not complete when someone adopts a new way of working once, but when that way of working becomes the default, replacing the previous habit reliably over time.

Why is behaviour change so difficult in organisations?
Behaviour change is difficult because it runs up against the force of habit. Research in behavioural neuroscience shows that habitual behaviours are encoded in the basal ganglia, a part of the brain that operates largely outside conscious awareness. Changing ingrained workplace habits requires deliberate repetition, environmental design (making the new behaviour easier than the old one), and consistent reinforcement from managers and peers.

What is the Fogg Behaviour Model and how does it apply to change management?
The Fogg Behaviour Model, developed by BJ Fogg at Stanford University, holds that behaviour occurs when motivation, ability, and a prompt converge at the same moment. In a change management context, this means that training alone (building ability) will not drive behaviour change if motivation is absent or if the cue to act is missing from the work environment. Effective change design addresses all three elements simultaneously.

How long does it take to embed a new behaviour at work?
The popular notion that habits form in 21 days has no scientific basis. Research published in the European Journal of Social Psychology found that it takes an average of 66 days for a new behaviour to become automatic, with a range from 18 to 254 days depending on the complexity of the behaviour and individual factors. For complex workplace behaviours, change teams should plan for reinforcement over a minimum of three to six months post-go-live.

How do you measure whether a behaviour change has been embedded?
The most reliable measures combine observational data (direct observation by managers or coaches using a structured checklist), system-generated data (for tech-enabled changes, usage data reveals whether people are working in the new way), and outcome data (whether the business result the behaviour was designed to achieve is materialising). Self-reported surveys are useful for tracking sentiment and confidence but should not be the sole measure of behaviour change.

How to Manage Change Through Buddhism Change Techniques

How to Manage Change Through Buddhism Change Techniques

How does Buddhism view the concept of change?

Buddhism embraces change as an inherent aspect of life, emphasizing the Pali word for impermanence, anicca. Change is viewed not as a threat, but as an opportunity for growth and enlightenment. By understanding and accepting the transient nature of existence, individuals can cultivate resilience and inner peace, ultimately leading to personal transformation and liberation.

I recently visited my brother and his family in Queensland near the North Eastern tip of Australia. Other than enjoying the nice beaches and tropical surroundings I spend some time with my 2 nephews. One of them is still in secondary school participating in various swimming carnivals over the same weekend. It seemed like yesterday that I had to hold his hand and walk him across the street. And now he is 6 foot three tall and still growing. Like many others undergoing change I reminisced the old days when he was small and cute and cherished the past. Not that the present isn’t great – but a part of us always miss the past and long for some of it to come back.

This made me wonder how generations have undergone change through the ages. Change is a fact of life as we grow and age – life and death. The Kubler-Ross model of the change curve is based on death and grief. This is often utilised to model the experiences that people undergo during change. However, the experience of change is an individual one and one that is dependent on the nature of the change and also how we perceive it. The same change event can be interpreted by one as a positive one and another as a negative one. As a result, for the same change event, for one the Kubler-Ross model of emotional experience can be valid, whilst for another completely the irrelevant.

How do we best deal with the constant changes and the nature of things in our lives? Buddhism, as part of its core Buddhist practice, is steeped in the philosophy that change in life is inevitable, reflecting the teachings of the Buddha as outlined in the sutra. Our thoughts are constantly changing, as are things around us, much like how the monks experience change in their monastic lives. Friends and even family can come and go, so can our belongings, but our attachment to them can lead to suffering. It teaches us that the more we try and hold on to things, the more grief and suffering this will cause us. The more we cling on to the past, the more it will cause us pain. This pain, if not embraced as part of our journey, prevents us from attaining a state of bliss and nirvana that comes from adjusting to the change and the new state of being.

“When we meet real tragedy in life, we can react in two ways–either by losing hope and falling into self-destructive habits, or by using the challenge to find our inner strength.” Dalai Lama.

In Buddhist meditation training, we are taught to be mindful and notice each moment, each sensation, and the dhamma of the environment that we are in. With the ebb and flow of each changing thought or changing moment, we simply notice it, acknowledge it, and apply the same mindfulness to the new state. We notice any feelings we have, acknowledge it as a part of how we react to the situation and move on to continually focus on the new state.

Building change readiness

In the modern organization we are constantly facing a multitude of different changes at the same time. How might we apply the same buddhist philosophy to these changes? We can do this by building awareness within ourselves and our employees that changes are constant, like life itself.

  1. Draw attention to the various changes in an open and matter of fact way.
  2. Build broader consensus of the environment that we are in.
  3. Establish expectation that there will continue to be ongoing changes.
  4. As needed establish routines and operating rhythms to bring the information about the changes to everyone (mindfulness of changes) and acknowledge the environment and challenges that the organization is facing.
  5. Investigate and analyse what channels are required to bring the changes to light so that everyone is well aware and ready for the changes.

“If you want others to be happy, practice compassion. If you want to be happy, practice compassion.” Dalai Lama.

At the same time we need to highlight and prepare employees for the new changes. And as the changes happen, make these explicit. Acknowledge any reactions to the change, address these head on and reference back to what is happening currently. Show compassion for those impacted by the change by being open and supportive. In corporate lives we often only focus on profit and bottom line. Being profitable and financial successful can create good for the organization and its people. However, we can also do a better job at being compassionate about people’s work lives. We can do this by HOW we implement changes. Are we open about what the change is? Or do we hide behind corporate jargon? Do we continuously engage with impacted parties so that they have an optimal change experience?

To build capability for constant changes, we need to consider how leaders message and story-tell the journey of the changes employees have faced, past, present and what the future holds. Link this to the theme of constant change.

Build employee resilience through mindfulness of change. Just like the theme of life and death, draw out the need for constant evolvement within the organization to stay current and relevant.

——————————-

If you enjoyed this article please share this with your contacts.