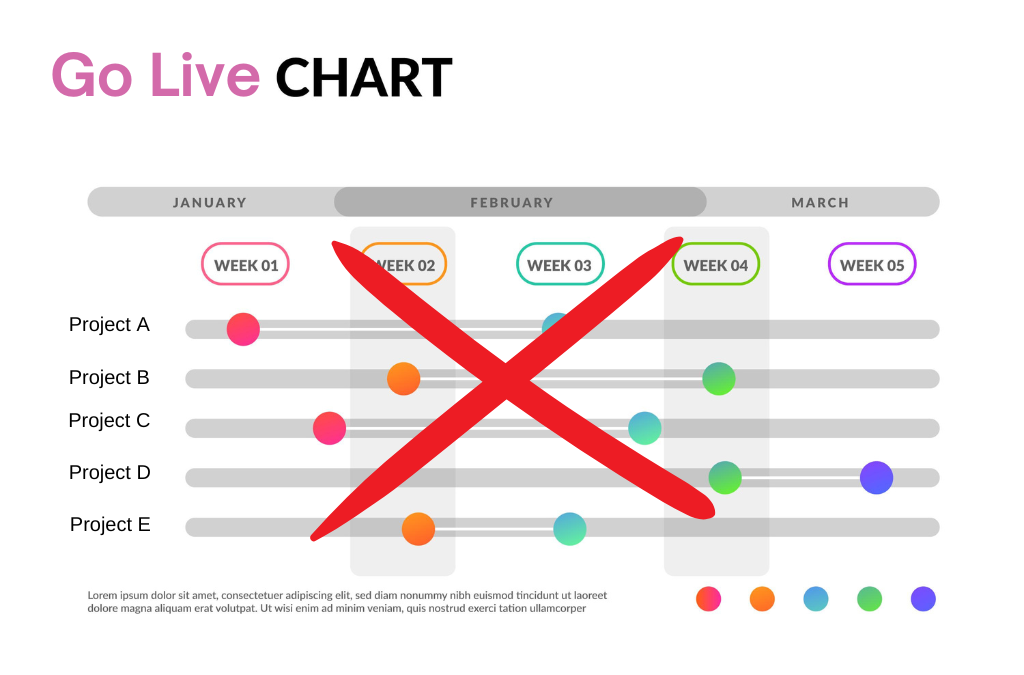
In the world of change management, Go Lives are often seen as significant milestones. For many project teams, these events represent the culmination of months or even years of hard work, signaling that a new system, process, or initiative is officially being launched. It’s common for stakeholders to view Go Lives as a key indicator of the success of a change initiative. However, while Go Lives are undeniably important, relying on them as the primary measure of change impact can be misleading and potentially harmful to the overall change effort.
Go Lives are just one piece of the puzzle. Focusing too heavily on these milestones can lead to an incomplete understanding of the change process, neglecting crucial activities that occur both before and after Go Live. Let’s outline the risks associated with using Go Lives to report on change management impacts and offers best practices for a more holistic approach.
Go Lives: A Double-Edged Sword
Go Lives are naturally a focal point for project teams. They represent a clear, tangible goal, and the success of a Go Live can boost morale, validate the efforts of the team, and provide a sense of accomplishment. From a project delivery perspective, Go Lives are critical. They signal that the project has reached a level of maturity where it is ready to be released to the broader organization. In terms of resourcing and business readiness, Go Lives ensure that everything is in place for the new system or process to function as intended.
However, the very attributes that make Go Lives attractive can also make them problematic as indicators of change impact. The simplicity and clarity of a Go Live event can lead stakeholders to overestimate its significance, from a impacted business perspective. The focus on Go Lives can overshadow the complex and often subtle changes that occur before and after the event. While a successful Go Live is necessary for change, it is not sufficient to guarantee that the change will be successful in the long term.
The Pre-Go Live Journey: Laying the Foundation for Change
A significant portion of the change management journey occurs long before the Go Live date. During this pre-Go Live phase, various engagement and readiness activities take place that are critical to shaping the overall impact of the change. These activities include town hall meetings, where leaders communicate the vision and rationale behind the change, and briefing sessions that provide detailed information about what the change will entail.
Training and learning sessions are also a crucial component of the pre-Go Live phase. These sessions help employees acquire the necessary skills and knowledge to adapt to the new system or process. Discussions, feedback loops, and iterative improvements based on stakeholder input further refine the change initiative, ensuring it is better aligned with the needs of the organization.
These pre-Go Live activities are where much of the groundwork for successful change is laid. They build awareness, generate buy-in, and prepare employees for what is to come. Without these efforts, the Go Live event would likely be met with confusion, resistance, or outright failure. Therefore, it is essential to recognize that the impact of change is already being felt during this phase, even if it is not yet fully visible.
Post-Go Live Reality: The Real Work Begins
While the Go Live event marks a significant milestone, it is by no means the end of the change journey. In fact, for many employees, Go Live is just the beginning. It is in the post-Go Live phase that the true impact of the change becomes apparent. This is when employees start using the new system or process in their daily work, and the real test of the change’s effectiveness begins.
During this phase, the focus shifts from preparation to adoption. Employees must not only apply what they have learned but also adapt to any unforeseen challenges that arise. This period can be fraught with difficulties, as initial enthusiasm can give way to frustration if the change does not meet expectations or if adequate support is not provided.
Moreover, the post-Go Live phase is when the long-term sustainability of the change is determined. Continuous reinforcement, feedback, and support are needed to ensure that the change sticks and becomes embedded in the organization’s culture. Without these ongoing efforts, the change initiative may falter, even if the Go Live event was deemed a success.
The Risk of Misleading Stakeholders
One of the most significant dangers of focusing too heavily on Go Lives is the risk of misleading stakeholders. When stakeholders are led to believe that the Go Live event is the primary indicator of change impact, they may not fully appreciate the importance of the activities that occur before and after this milestone. This narrow focus can lead to a number of issues.
Firstly, stakeholders may prioritize the Go Live date to the exclusion of other critical activities. This can result in insufficient attention being paid to pre-Go Live engagement and readiness efforts or to post-Go Live adoption and support. As a consequence, the overall change initiative may suffer, as the necessary foundations for successful change have not been properly established.
Secondly, stakeholders may develop unrealistic expectations about the impact of the change. If they believe that the Go Live event will immediately deliver all the promised benefits, they may be disappointed when these benefits take longer to materialize. This can erode confidence in the change initiative and reduce support for future changes.
Finally, a narrow focus on Go Lives can create a false sense of security. If the Go Live event is successful, stakeholders may assume that the change is fully implemented and no further action is required. This can lead to complacency and a lack of ongoing support, which are essential for ensuring the long-term success of the change.
Best Practices for Reporting Change Management Impact
To avoid the pitfalls associated with relying on Go Lives as indicators of change impact, change management practitioners should adopt a more holistic approach to reporting. This involves considering the full scope of the change journey, from the earliest engagement activities to the ongoing support provided after Go Live. Here are some best practices for reporting on change management impact:
Integrate Pre-Go Live Metrics:
Track and report on engagement activities, such as attendance at town hall meetings, participation in training sessions, and feedback from employees.
Monitor changes in employee sentiment and readiness levels throughout the pre-Go Live phase.
Report on aggregate pan-initiative change initiative impost on business units, pre-Go Live
Emphasize Post-Go Live Support:
Develop metrics to measure the effectiveness of post-Go Live support, such as the number of help desk inquiries, employee satisfaction with the new system, and the rate of adoption.
Highlight the importance of continuous feedback loops to identify and address any issues that arise after Go Live.
Communicate the need for ongoing reinforcement and support to stakeholders, emphasizing that change is an ongoing process
Report on post-Go Live adoption time impost expected across initiatives
Provide a Balanced View of Change Impact:
Ensure that stakeholders understand that Go Live is just one part of the change journey and that significant impacts occur both before and after this event.
Use a combination of quantitative and qualitative data to provide a comprehensive view of change impact.
Regularly update stakeholders on progress throughout the entire change journey, not just at the time of Go Live.
Manage Expectations:
Clearly communicate to stakeholders that the full impact of the change may not be immediately visible at the time of Go Live.
Set realistic expectations about the timeline for realizing the benefits of the change.
Prepare stakeholders for potential challenges in the post-Go Live phase and emphasize the importance of ongoing support.
While Go Lives are important milestones in the change management process, they should not be used as the sole indicator of change impact. The journey to successful change is complex, involving critical activities before, during, and after the Go Live event. By adopting a more holistic approach to reporting on change management impact, practitioners can provide stakeholders with a more accurate understanding of the change journey, manage expectations more effectively, and ensure the long-term success of the change initiative.
The key takeaway is that change management is not just about delivering a project; it’s about guiding an organization through a journey of transformation. Go Lives are just one step in this journey, and it is the responsibility of leaders to ensure that every step is given the attention it deserves.
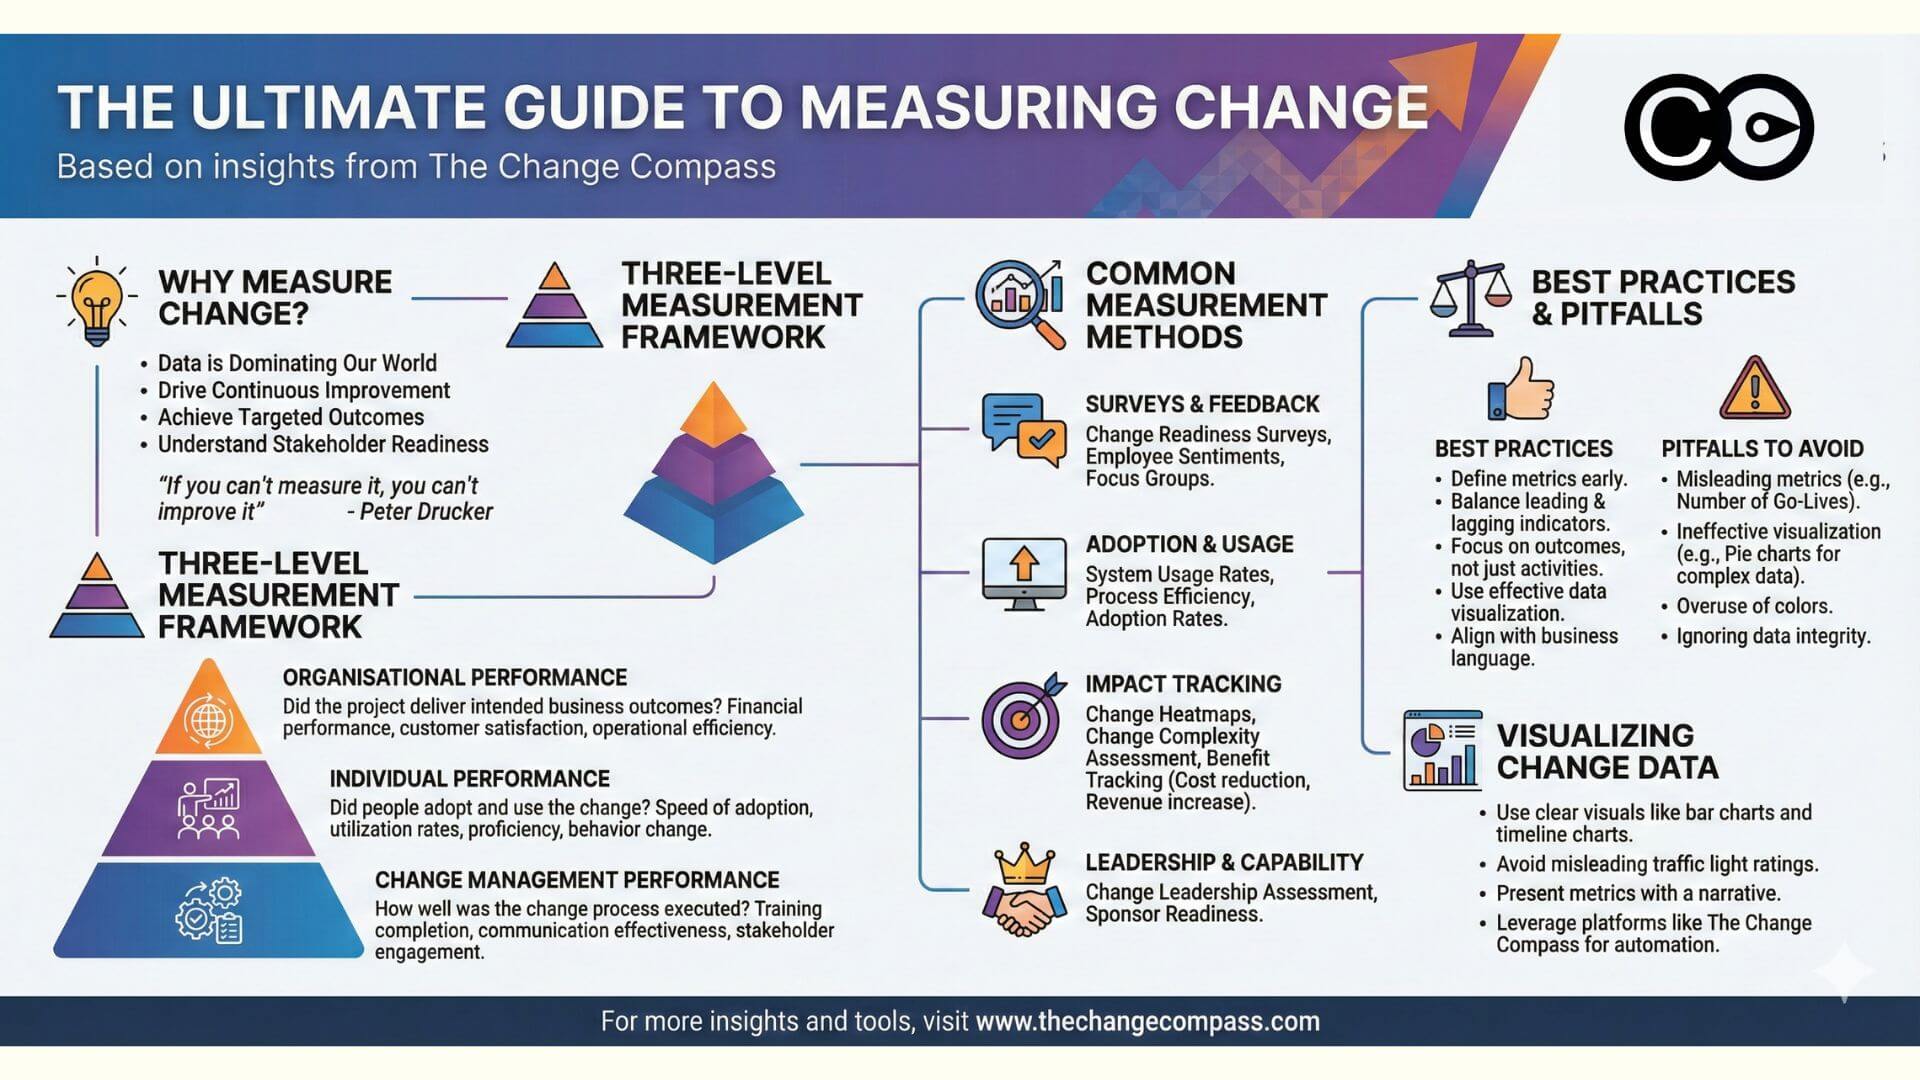
Measuring change management is the practice of capturing whether an organisation’s change activities are landing as intended across a portfolio of initiatives. It covers three distinct layers: project-level metrics that show whether individual initiatives are on track, business-level metrics that show whether outcomes promised in the business case are being achieved, and enterprise-level metrics that show whether the organisation as a whole is becoming more capable of absorbing change. A complete framework reports on all three. Without measurement at each layer, change management becomes a series of activities with no defensible link to business value.
Change measurement translates organisational impact into quantifiable data through surveys, analytics dashboards, and AI-powered tools. Organisations that measure change readiness and adoption rates are 78% more likely to meet project objectives. This guide covers six project-level methods, seven business-level measures, and three enterprise-level frameworks across the Plan-Execute-Realise lifecycle.
A lot of change practitioners are extremely comfortable with saying that change management is about attitudes, behaviours, and feelings and therefore we cannot measure them. This metaphor that change management is ‘soft’ extends into areas such as leadership and employee engagement whereby it may not be easy to measure and track things. However, is it really that because something is harder to measure and less black and white that there is less merit in measuring these?
“If you can’t measure it you can’t improve it” Peter Drucker
The ‘why’ behind a lot of industry change in our day and age comes from the fact that data is now dominating our world. Data is a central part of everything that is changing in our world. Since we are now more reliant on the internet for information, the data that can be collected through our digital interactions around our lives are now driving change. Home assistant Alexa from Amazon can recognize our voices and tell us what we want to know. We can be identified through street cameras. Our Google usage leads to better-targeted advertisements and product promotions. Our Facebook usage leads to a deep understanding of our preferences and lifestyles, and therefore we become targetted by advertisements for what we may find value in (according to Facebook data and algorithms).
So if our world is surrounded by data, why are we not measuring it in managing change? To answer this question let’s look at what we are or are not measuring.
These are some of the common ways in which change is often measured in projects:
Project methods intro
1. Change readiness surveys – What do readiness surveys actually measure?
Change readiness surveys are 5-10 question pulse assessments (Likert + open text) sent via SurveyMonkey/Microsoft Forms at pre-launch, mid-execution, and post-launch. They benchmark stakeholder preparedness, with 92% accuracy when combined with behavioural observations. Top organisations survey quarterly.
Change readiness surveys are usually online surveys sent by a project owner to understand how stakeholder groups are feeling about the change at different points in time throughout the project. It can be in the form on a Likert scale or free text. Most results are summarized into a quantitative scale of the degree in which the group is ready for change. A simple SurveyMonkey could be set up to measure stakeholder readiness for change. ChangeTracking (now part of Accenture) is a comprehensive online tool that measures the change journey and readiness of stakeholder groups throughout the initiative.
2. Training evaluation surveys – How do you prove training ROI?
These evaluations are normally based on participant satisfaction across various categories such as content, instructor effectiveness, usefulness, etc. In a face-to-face training format, these surveys are normally paper-based so as to increase the completion rate. For online or virtual training, ratings may be completed by the user at the conclusion or after the session.
3. Communications metrics – Which comms metrics matter most?
One way in which communications may be measured is the ‘hit rate’ or the number of users/audience that views the article/material/page. This may be easily tracked using Google Analytics that not only tracks number of views per page but also viewership by the time of day/week as well as audience demographic information as such gender and geographical locations.
4. Employee sentiments/culture surveys – What reveals change resistance early?
There are some organisations that measure employee sentiments or culture over the year and often there are questions that are linked to change. These surveys tend to be short and based on a Likert scale with less open-ended questions for qualitative feedback. Since these surveys are often sent across the entire organisation they are a ‘catch-all’ yardstick and may not be specific to particular initiatives.
5. Change heatmaps – When do heatmaps fail (and what works better)?
Some organisations devise change heatmaps on excel spreadsheets to try and map out the extent to which different business units are impacted by change. This artifact speaks to the amount of change and often leads to discussions concerning the capacity that the business has to ‘handle/digest’ change. The problem with most heatmaps is that they are usually categorized and rated by the creator of the artifact (or a limited number of people making judgments), and therefore subject to bias. Data that is based on 1 person’s opinions also tend not to have as much weight in a decision-making forum.
6. Change benefit tracking – How do you track post-launch ROI?
In addition to typical change management measures, there are various initiatives-specific measures that focus on the actual outcome and benefit of the change with the goal of determining to what extent the change has taken place. Some example of this includes:
System usage rates
Cost reduction
Revenue increase
Transaction speed
Process efficiency
Speed of decision making
Customer satisfaction rate
Employee productivity rate
Incidents of process violation
Non-initiative based change management measures
There are two other measures that are used within an organisational vs. initiative-specific context, change leadership assessment and change maturity assessment. In the next section, we will discuss these two areas.
Change leadership assessment
David Miller from Changefirst wrote about 3 types of change leaders.:
1. The sponsor whose role is to drive the initiative to success from the beginning to the end. This involves possessing competencies in rallying and motivating people, building a strong network of sponsors and communicating clearly to various stakeholder groups.
2. The influencer whose role is to leverage their network and influence to market and garner the traction required to make the initiative successful. Four types of influencers as identified by Changefirst includes:
a) Advocates who are great at promoting and advocating the benefits of the change
b) Connectors who are able to link and leverage people across a part of the organisation to support the change
c) Controllers who have control over access to information and people and these could include administrators and operations staff
d) Experts who are viewed by others in the organisation as being technically credible
3. The change agent is someone who is tasked with supporting the overall change in various ways, including any promotional activities, gaging different parts of the organisation on the change and be able to influence, up, down and sideways across the organisation to drive a successful change outcome.
Whilst there isn’t one industry standard tool for assessing change leadership competencies and capabilities. There are various change leadership assessment tools offered by Changefirst as well as other various smaller consulting firms. One of the most comprehensive change leadership assessment tools is by ChangeTracking is the Change Capacity Assessment which is a self-assessment with the broad categories being Goal Attainment, Flexibility, Decision Making, and Relationship Building.
Some of the key competencies critical in change leadership have been called out by Pagon & Banutal (2008), and include:
Goal attainment
Assessing organisational culture and climate
Change implementation
Motivating and influencing others
Adaptability
Stakeholder management
Collaboration
Build organisational capacity and capability for change
Maneuvering around organisational politics
Change maturity assessment
Organisations are increasingly realising that managing change initiative by initiative is no longer going to cut it as it does not enable organisational learning and growth. Initiatives come and go and those who rely on contractor change managers often find that their ability to manage change as an organisation does not mature much across initiatives.
Change maturity assessment is focused on building change capability across the organisation across different dimensions, whether it be project change management or change leadership. The goal of conducting a change maturity assessment is to identify areas in which there may be a capability gap and therefore enable structured planning to close this gap.
There are 2 major change maturity assessment models available in the market. The first is by Prosci and the second is by the Change Management Institute. To read more about change maturity assessment read out article A New Guide for Improving Change Management Maturity, where we outline how to improve change maturity throughout different business units across the organisation.
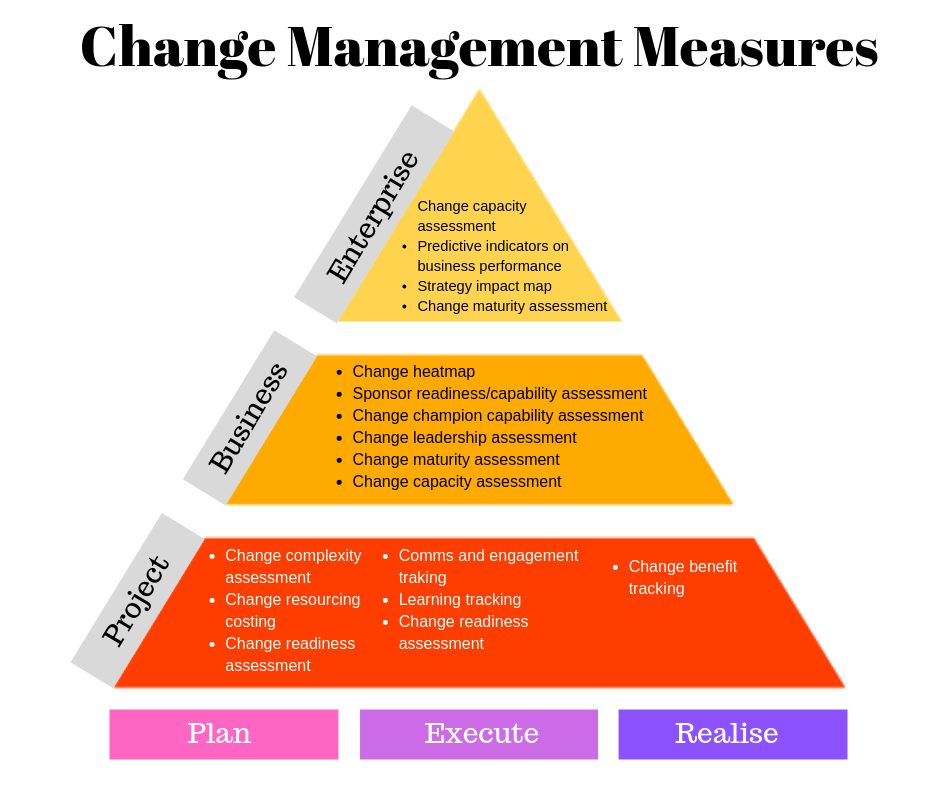
A comprehensive model of Change Management Measures
In this diagram various change management measures are represented along two axes, one being the different phases of the initiative lifecycle, and the other being different organisational levels of project, business and enterprise in which change management measures fall into.
Project level measures
‘Plan’ phase
In this phase of the project, the team is discovering and scoping what the project involves and what the change is. As a result, the details are not known clearly at the commencement of the phase. Later in the phase the scope becomes much clearer and the team starts to plan what activities are required to implement the change.
The change complexity assessment evaluates how complex the project is. It looks at how many people could be impacted, what the size of the impact could be, how many business units are impacted, whether multiple systems and processes are impacted, etc.
Change resourcing costing. At the planning phase of the project cost required for the change management stream of the work is required. This includes such as any contractors, communication campaigns, learning cost, travel, and administration cost, just to name a few.
Change readiness assessment is usually conducted prior to the change and during the change. Usually, the same set of questions is asked of various stakeholder groups to assess their readiness for change.
‘Execute’ phase
The execute phase is one of the most critical parts of the project. Activities are in full flight and the project is busy iterating and re-iterating changes to ensure successful execution to achieve project goals.
Communication and engagement tracking. Effective engagement of stakeholders in the change is absolutely critical. Stakeholder interviews, surveys, communication readership rates are all ways in which engagement may be tracked.
Learning tracking. Measuring learning is critical since it tracks to what extent the new competencies and skills have been acquired through learning interventions. Typical measurements include course tests or quizzes in addition to course evaluations. On the job performance may also be used to track learning outcomes and to what extent learning has been applied in the work setting.
Change readiness assessment continues to be critical to track during the execution phase of the project
‘Realise’ phase
In this phase of the project the change has ‘gone live’ and most project activities have been completed. It is anticipated in this phase that the ‘change’ occurs and that the benefits can then be tracked and measured.
Change benefit tracking measures and tracks the extent to which the targeted benefits and outcomes have been achieved. Some of these measures may be ‘hard’ quantitative measures whilst others may be ‘soft’ measures that are more behavioural.
Business level measures
Business level measures are those that measure to what extent the business has the right ability, capacity, and readiness for the change.
Change heatmaps can help to visualize which part of the business is most impacted by 1 project or multiple projects. The power of the change heatmap is in visualizing which part of the business is the most impacted, and to compare the relative impacts across businesses. As the number of change initiatives increase so would the complexity of the change. When facing this situation organisations need to graduate from relying on excel spreadsheets to using more sophisticated data visualization tools to aid data-based decision making. To read more about change heatmaps and why this is not the only way to understand business change impact, go to The Death of the Change Heatmap.
Sponsor readiness/capability assessment can be a critical tool to help identify any capability gaps in the sponsor so that effort may be taken to support the sponsor. A strong and effective sponsor can make or break a change initiative. Early engagement and support of the sponsor are critical. Both Prosci, as well as Changefirst, have sponsor competency assessment offerings.
Change champion capability assessment. Change champion or change agent are critical ‘nodes’ in which to drive and support change within the organisational network. A lot of change champions are appointed only for one particular initiative. Having a business-focus change champion network means that their capability can be developed over time, and they can support multiple initiatives and not just one. Assessing and supporting change champion capability would also directly translate to better change outcomes.
Change leadership and change maturity assessment – refer to the previous section
Change capacity assessment.
In an environment where there is significant change happening concurrently, careful planning and sequencing of change in balance with existing capacity are critical. There are several aspects of change capacity that should be called out in the measurement process:
Different parts of the business can have different capacity for change. Those parts of the business with better change capability, and perhaps with better change leadership, are often able to receive and digest more changes than other businesses that do not possess the same level of capability.
Some businesses are much more time-sensitive and therefore their change capacity needs to be measured with more granularity. For example, call centre staff capacity is often measured in terms of minutes. Therefore, to effectively plan for their change capacity, the impacts of change needs to be quantified and articulated in a precise, time-bound context so that effective resourcing can be planned in advance.
The change tolerance or change saturation level for business needs careful measurement in combination with operational feedback to determine. For example, it could be that last month a part of the business experienced significant change impact across several initiatives happening at the same time. The operational indicators were that there was some impact on customer satisfaction, productivity, and there were negative sentiments reported by staff that there was too much change to handle. This could mean that the change tolerance level may have been exceeded. With the right measurement of change impact levels for that part of the business, next time this level of change is seen, previous lessons may be utilized to plan for this volume of change. Utilise measurement and data visualization tools such as the Change Compass to track change capacity.
Enterprise level change measures
At an enterprise level, many of the business unit level measures are still applicable. However, the focus is comparing across different business units to sense-make what each part of the business is going through and if the overall picture is aligned with the intentions and the strategic direction of the organisation. For example, typical questions include:
Is it surprising that one part of the business is undergoing significant change whilst another is not?
Is there a reason that one business unit is focused on a few very large changes whilst for other business units there is a larger set of changes each with smaller impacts?
Is the overall pace of change optimum according to strategic intent? Does it need to speed up or slow down?
What is the process to govern, report and make decisions on enterprise level change, prioritization, sequencing and benefit realization?
Is there one business unit that is able to manage change more effectively, faster with greater outcomes? How can other business units leverage any internal best practices?
As mentioned in the Change Management Measures diagram, some enterprise level change measures include:
Change capacity assessment – Does one business unit’s change capacity limits mean that we are not able to execute on a critical strategy within the allocated time? How do we create more capacity? Ways in which to create more capacity could include more resources such as staff, or initiative funding, more time is given, or more talent to lead initiatives
Change maturity assessment – At an enterprise level, the concern is with the overall change maturity of the organisation. How do we implement enterprise level interventions to build change maturity through programs, networks, and exchanges, such as:
Enterprise change capability programs
Enterprise change analytics and measurement tools
Enterprise change methodology
Enterprise network of change champions
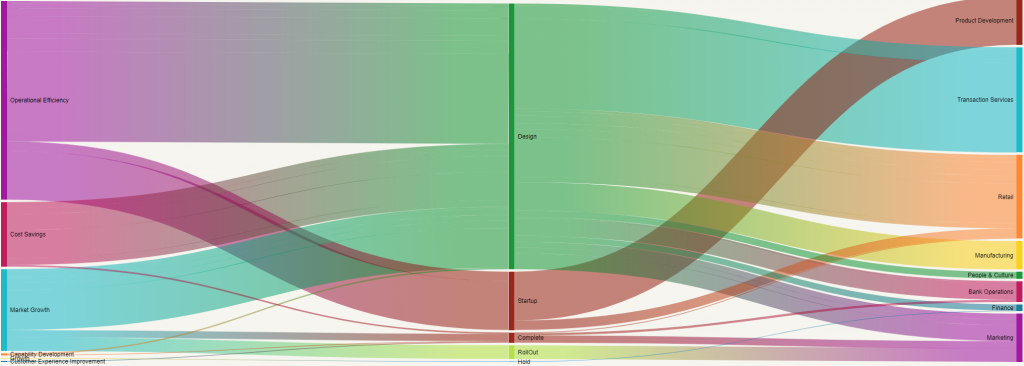
Strategy impact map – Change management need not be focused only on project execution or business unit capability. It can also demonstrate value at an enterprise level by focusing on strategy execution (which by definition is change). The way in which different strategies exert impact on various business units may be visualized to help stakeholder understand which initiatives within which strategic intent impact which business units. To illustrate this please refer to the below diagram which is an example of a strategy impact map. In this diagram, each of the organisation’s strategy is displayed with different initiatives branching out of each strategy. The width of each initiative correlates with the level of impact that the initiative has on the business over a pre-determined period of time. Therefore, the width of each strategy also indicates the overall relative impact on the business.
This data visualization artifact can be valuable for business leaders and strategic planning functions as it depicts visually how the implementation of various strategies is impacting business units. This helps planners to better understand strategy implementation impacts, potential risks and opportunities, and balancing change pace with strategy goals at various points in time.
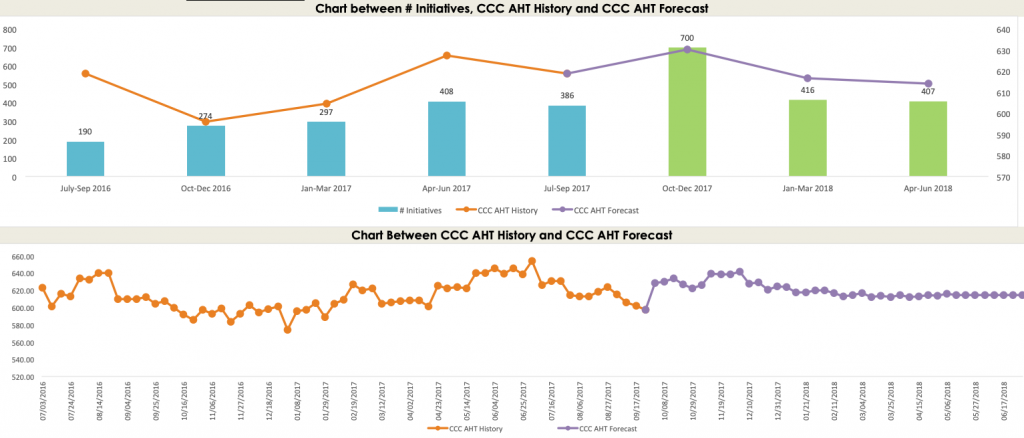
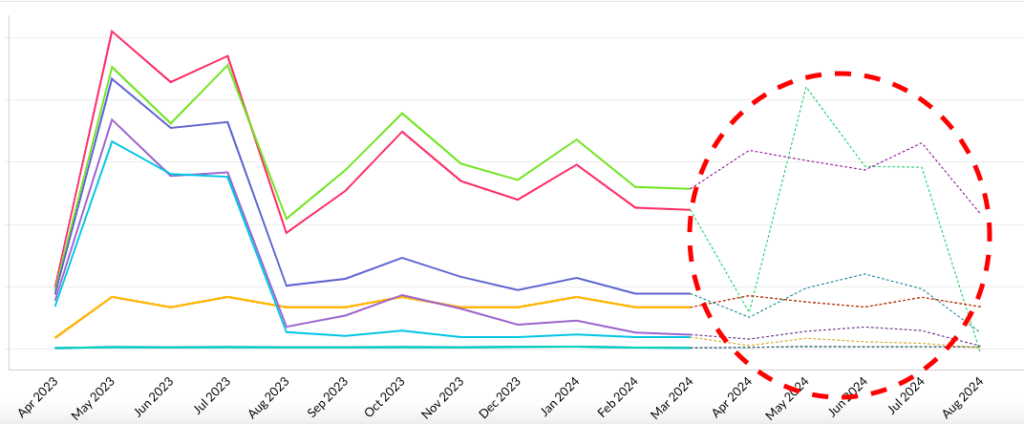
Predictive indicators on business performance – We started this article talking about how data is all around us and we also need to better manage change using data. With quantitative data on change impact, it is possible to ascertain any correlations with operational business indicators such as customer satisfaction, service availability, etc. For those business indicators where there is a significant correlation, it is possible to hence use predictive reporting to forecast performance indicator trends, given planned change impacts.
In the below graph you can see an example of this whereby using historical data it is possible to establish correlations and therefore forecast future impact on business indicators. This example is focused on the customer contact centre (CCC) and key business indicator of average handling time (AHT) is utilized as an illustration.
This type of predictive performance forecasting is extremely valuable for organisations undergoing significant change and would like to understand how change may impact their business performance. By demonstrating the impact on business indicators, this puts the importance of managing change at the front and centre of the decision-making table. At The Change Compass, we are developing this type of measurement and reporting function. This is the frontier for change management – to be established as a key business-driving function (versus a standard back-office function).
Change can be measured and this article has outlined various operational and strategic ways in which change measurement can demonstrate significant value. Most corporate functions cannot exist without data and analytics. For example, Human Resources relies on people and pay data. Marketing cannot function without measurement of channel and campaign effectiveness. For Information Technology, pretty much everything is measured from system usage, to cost, to efficiency. It is time we start utilizing data to better visualize change to better plan and make business decisions.
References:
Miller, David (2011) Successful Change. How to implement change through people. Changefirst Ltd.
Pagon & Banutal (2008) Leadership Competencies for Successful Change Management. Study Report. University of Maribor.
Frequently Asked Questions (FAQ)
What are the most important change management metrics to track? Focus on adoption rates, readiness scores, communication engagement, and benefit realisation metrics tailored to project phases and business capacity.
How do you measure change readiness effectively? Combine pulse surveys with behavioural indicators and sponsor assessments. Balance frequency with depth for actionable insights. Read “Beyond the Survey: A Strategic Lens on Change Readiness Assessment.”
Why replace change heatmaps with other visuals? Heatmaps introduce subjectivity bias. Timeline charts and capacity dashboards provide clearer decision-making data. See “The Death of the Change Heatmap.”
What role does AI play in change measurement? AI enables real-time sentiment analysis, predictive capacity planning, and automated risk detection across initiatives. Platforms integrate natural language queries for instant insights.
How many change metrics should organisations track? Target 8-15 core metrics aligned with strategic objectives across project, business, and enterprise levels to maintain focus and actionability.
What enterprise-level change metrics matter most? Strategy impact mapping, cross-business capacity analysis, and predictive performance forecasting linking change volume to operational outcomes.
How to Measure Change Management Effectively: A 5-Step Framework
Measuring change management effectively requires a framework that covers the full lifecycle of the change – from pre-change baseline through to sustained adoption tracking. The five steps below reflect the approach used by experienced change practitioners and data-driven change teams.
Step 1 – Establish a Change Measurement Framework: Define what you are measuring and why before selecting metrics. A change measurement framework should cover three levels: activity metrics (what the change team is doing), readiness metrics (how prepared people are), and adoption metrics (whether people have actually changed their behaviour).
Step 2 – Set a Baseline Before the Change: Measure the current state before the change is implemented. Without a baseline, it is impossible to demonstrate the impact of the change management effort or to identify where readiness is lowest.
Step 3 – Track Readiness at Key Milestones: Conduct readiness assessments at defined milestones – typically at the start of the programme, 30-60 days before go-live, and at go-live. Readiness assessments should cover awareness, understanding, capability, and commitment for each affected stakeholder group.
Step 4 – Measure Adoption After Go-Live: Track adoption metrics in the weeks and months after go-live. Key indicators include system usage rates, process compliance, error rates, workaround behaviour, and performance recovery back to baseline.
Step 5 – Report and Act on Measurement Data: Use measurement data to drive decisions – not just to report status. When adoption is lagging in a specific group, use the data to identify the barrier and target an intervention.
This guide focuses on the complete measurement framework, design, run, and report change measurement end-to-end. Three closely related guides on this site each cover a distinct angle, pick the one that matches what you need now:
Every change management team can describe what they did. Very few can demonstrate what difference it made. This measurement gap is not just an inconvenience; it is the single biggest reason change management struggles to secure resources, retain executive attention, and prove its value as a strategic function.
The data makes the case unequivocally. Prosci’s benchmarking research across 2,600 practitioners found that 88% of projects with excellent change management met or exceeded their objectives, compared to just 13% with poor change management. Gartner’s 2025 research found that organisations achieving healthy change adoption report two times higher year-over-year revenue growth. The correlation between effective change management and business performance is not in question. What is in question is whether your organisation can measure it.
This guide provides a practical framework for measuring change management success, from selecting the right KPIs to designing dashboards that influence executive decisions.
The measurement problem: activities versus outcomes
The most common mistake in measuring change management success is confusing activity with impact. Counting the number of communications sent, training sessions delivered, or stakeholder meetings held tells you nothing about whether anyone changed their behaviour. Yet these activity metrics dominate most change management reports.
Why activity metrics persist
Activity metrics are easy to collect, which is precisely why teams default to them. They also feel productive to report. But they create a dangerous illusion: a team that has delivered 40 training sessions and sent 200 communications can appear highly effective while the change itself is failing.
The shift to outcome measurement
Measuring change management success requires tracking what actually changed as a result of your interventions, not just what interventions you delivered. This means measuring whether people are using new systems, following new processes, demonstrating new behaviours, and whether those behavioural changes are producing the business outcomes the initiative was designed to achieve.
Prosci’s research on change management metrics reinforces this point: of organisations that measured compliance and overall performance, 76% met or exceeded project objectives. Among those that did not measure, only 24% achieved the same result.
A three-tier metrics framework for change management success
Effective measurement organises metrics into three tiers, each serving a different purpose and measured at a different point in the change lifecycle.
Tier 1: Leading indicators (pre-change and early implementation)
Leading indicators tell you whether the conditions for successful adoption are being established. They are predictive: if leading indicators are weak, adoption will almost certainly fall short.
Key leading indicators include:
Awareness levels: Percentage of affected stakeholders who can articulate what is changing and why
Sponsor engagement score: Frequency and quality of visible sponsorship behaviours (rated by direct reports, not self-assessed)
Readiness assessment results: Composite scores from structured readiness evaluations across impacted groups
Training effectiveness: Post-training knowledge assessment scores (not just completion rates)
Sentiment indicators: Employee pulse survey results on confidence, concern levels, and perceived support
Tier 2: Adoption indicators (during and post-implementation)
Adoption indicators measure whether the target population is actually using, following, or demonstrating what the change requires. This is where most measurement programmes either succeed or fail.
Key adoption indicators include:
System usage rates: Login frequency, feature utilisation, and transaction volumes in new systems
Process compliance: Percentage of transactions following the new process versus the old one
Behavioural observation data: Manager-reported or peer-reported evidence of new behaviours in practice
Error and rework rates: Declining error rates indicate proficiency is building; stable or rising rates indicate adoption gaps
Support ticket trends: Decreasing support requests over time suggest growing self-sufficiency
Impact indicators connect change adoption to the business outcomes the initiative was designed to deliver. This is where change management proves its strategic value.
Key impact indicators include:
Business outcome metrics: Revenue, cost savings, productivity gains, or customer satisfaction improvements attributable to the change
Sustained adoption rates: Usage and compliance levels 90 and 180 days post-implementation (not just at go-live)
Employee experience scores: Engagement, wellbeing, and voluntary turnover in heavily impacted groups
Speed to proficiency: Time from go-live to target performance levels
Return on change investment: Ratio of realised benefits to total change management investment
Leading versus lagging indicators: a comparison
Understanding the distinction between leading and lagging indicators is essential for designing a measurement approach that is both predictive and evaluative.
| Dimension | Leading indicators | Lagging indicators | |———–|——————-|——————-| | Timing | Measured before and during change | Measured after implementation | | Purpose | Predict likelihood of success | Confirm whether success occurred | | Action value | High, can course-correct in real time | Lower, confirms outcomes retrospectively | | Examples | Awareness scores, sponsor engagement, training effectiveness | Adoption rates, business outcomes, ROI | | Risk if ignored | You discover problems too late to fix them | You cannot prove value to stakeholders | | Data sources | Surveys, assessments, observations | System data, financial reports, performance metrics |
The most effective measurement programmes balance both: leading indicators to steer decisions during implementation, and lagging indicators to demonstrate value after the fact. For a deeper exploration of measurement methodology, see our ultimate guide to measuring change management outcomes.
Seven KPIs every change management team should track
While the specific metrics will vary by initiative, these seven KPIs provide a solid foundation for measuring change management success across most organisational changes.
1. Stakeholder awareness rate
Definition: Percentage of impacted stakeholders who can correctly describe what is changing, why, and how it affects their role. How to measure: Short pulse surveys (3-5 questions) administered at key milestones. Target: 80%+ awareness before go-live.
2. Active sponsor engagement score
Definition: A composite score measuring the frequency and visibility of sponsor behaviours, including communication, participation in change events, and removal of barriers. How to measure: Monthly assessment by the change team using a standardised rubric, validated by team feedback. Target: 7/10 or above on a standardised scale.
3. Training proficiency rate
Definition: Percentage of trained users who demonstrate competency in post-training assessments (not just attendance). How to measure: Knowledge checks, simulations, or practical demonstrations administered after training. Target: 85%+ pass rate on proficiency assessments.
4. Adoption rate
Definition: Percentage of the target population actively using the new system, process, or behaviour as designed. How to measure: System analytics, process audits, or structured observations. Target: 70%+ within 30 days of go-live, 90%+ within 90 days.
5. Time to proficiency
Definition: Average number of days from go-live until users reach target performance levels. How to measure: Track performance metrics (speed, accuracy, volume) from go-live and identify when they reach pre-defined thresholds. Target: Varies by change complexity; benchmark against organisational norms.
6. Change saturation index
Definition: Number of concurrent changes impacting each stakeholder group, weighted by degree of disruption. How to measure: Portfolio-level change impact assessment mapping all initiatives against affected groups. Target: No group exceeds 2-3 significant concurrent changes.
7. Benefit realisation rate
Definition: Percentage of projected business benefits actually realised within the defined timeframe. How to measure: Compare actual business outcomes against the benefits case approved at project initiation. Target: 80%+ of projected benefits realised within 12 months.
Common measurement traps to avoid
Even well-intentioned measurement programmes can go wrong. Watch for these patterns:
Measuring too late. Waiting until post-implementation to assess adoption means you have no opportunity to course-correct. By the time the data confirms a problem, the project team has moved on. Build measurement into every phase, starting with leading indicators well before go-live.
Activity metrics masquerading as outcomes. “We delivered 40 training sessions” is not a success metric. “85% of trained users passed the proficiency assessment” is. Always ask: does this metric tell me whether anything actually changed?
Vanity metrics. High email open rates and training attendance figures look good in reports but tell you nothing about whether behaviour changed. Focus on metrics that are uncomfortable to report when they are low, because those are the ones that matter.
Single-point-in-time measurement. Adoption at go-live is not the same as sustained adoption. Many changes show strong initial compliance that erodes within 90 days. Measure at 30, 90, and 180 days post-implementation to track sustainability.
Ignoring the portfolio view. Measuring success for each initiative independently can mask portfolio-level problems. A team that successfully adopted one change may have done so at the expense of another. Measure change management success at both the initiative and portfolio level.
How digital analytics platforms support measurement
WTW’s 2023 global study of 600 organisations found that companies taking a data-driven, proactive approach to change management drove nearly three times more revenue than those with below-average change effectiveness. The implication is clear: measurement is not just a reporting exercise; it is a competitive advantage.
Digital change management platforms such as The Change Compass enable organisations to track adoption metrics across the full change portfolio in real time, aggregate leading and lagging indicators into decision-ready dashboards, and identify measurement gaps before they become blind spots. For organisations managing multiple concurrent changes, these platforms replace manual spreadsheet tracking with continuous, portfolio-wide measurement intelligence.
To measure change management success effectively, stop counting what you did and start tracking what changed. Build a three-tier measurement framework that captures leading indicators early enough to steer decisions, adoption indicators during implementation to confirm behavioural change, and impact indicators after implementation to prove business value. The organisations that measure change management success rigorously do not just deliver better projects; they build the evidence base that secures ongoing investment in change capability.
Frequently asked questions
What are the most important KPIs for change management? The most critical KPIs are adoption rate (percentage of the target population using the new system or process as intended), sponsor engagement score, time to proficiency, and benefit realisation rate. These four metrics collectively measure whether the change was adopted, supported, efficient, and valuable to the business.
How do you measure change management ROI? Change management ROI compares the realised business benefits of a change initiative against the total investment in change management activities. Calculate it by quantifying the financial value of benefits achieved (cost savings, revenue gains, productivity improvements) and dividing by the total cost of change management resources, tools, and time. Express as a ratio or percentage.
What is the difference between leading and lagging indicators in change management? Leading indicators are predictive metrics measured before and during implementation, such as awareness levels, sponsor engagement, and training proficiency. Lagging indicators are retrospective metrics measured after implementation, such as adoption rates, sustained usage, and business outcome improvements. Both are essential for a complete measurement picture.
How soon after implementation should you measure change adoption? Measure at three intervals: 30 days post-implementation for initial adoption and early usage patterns, 90 days for sustained adoption and proficiency development, and 180 days for embedded behaviour change and benefit realisation. Single-point measurement at go-live is insufficient because it captures compliance, not true adoption.
Why do most organisations struggle to measure change management success? The most common barriers are reliance on activity metrics rather than outcome metrics, lack of pre-defined baselines against which to measure progress, absence of portfolio-level measurement capability, and insufficient integration between change management data and business performance data. Addressing these gaps requires both a measurement framework and the tooling to execute it at scale.
How do you build a change management measurement dashboard? An effective dashboard organises metrics into the three tiers (leading, adoption, impact), displays them against targets and baselines, and updates in near-real time. Include traffic-light indicators for at-risk metrics, trend lines showing trajectory over time, and portfolio-level aggregation across all active initiatives. Design it for the audience: executives want outcomes and ROI; project teams want adoption trends and risk indicators.
Suggested title: How to measure change management success: KPIs, metrics, and frameworks for 2026
Suggested meta description: Discover a 3-tier framework for measuring change management success with 7 essential KPIs. Move from activity tracking to outcome measurement.
Change management is often seen as a ‘soft’ discipline that is more an ‘art’ than science. However, successful change management, like managing a business, relies on having the right data to understand if the journey is going in the right direction toward change adoption. The data can inform whether the objectives will be achieved or not.
Data science has emerged to be one of the most sought-after skills in the marketplace at the moment. This is not a surprise because data is what powers and drives our digital economy. Data has the power to make or break companies. Companies that leverages data can significant improve customer experiences, improve efficiency, improve revenue, etc. In fact all facets of how a company is run can benefit from data science. In this article, we explore practical data science techniques that organizations can use to improve change outcomes and achieve their goals more effectively.
Improved decision making
One of the significant benefits of using data science in change management is the ability to make informed decisions. Data science techniques, such as predictive analytics and statistical analysis, allow organizations to extract insights from data that would be almost impossible to detect or analyse manually. This enables organizations to make data-driven decisions that are supported by empirical evidence rather than intuition or guesswork.
Increased Efficiency
Data science can help streamline the change management process and make it more efficient. By automating repetitive tasks, such as data collection, cleaning, and analysis, organizations can free up resources and focus on more critical aspects of change management. Moreover, data science can provide real-time updates and feedback, making it easier for organizations to track progress, identify bottlenecks, and adjust the change management plan accordingly.
Improved Accuracy
Data science techniques can improve the accuracy of change management efforts by removing bias and subjectivity from decision-making processes. By relying on empirical evidence, data science enables organizations to make decisions based on objective facts rather than personal opinions or biases. This can help reduce the risk of errors and ensure that change management efforts are based on the most accurate and reliable data available.
Better Risk Management
Data science can help organizations identify potential risks and develop contingency plans to mitigate those risks. Predictive analytics can be used to forecast the impact of change management efforts and identify potential risks that may arise during the transition. For example, change impacts across multiple initiatives against seasonal operations workload peaks and troughs.
Enhanced Communication
Data science can help facilitate better communication and collaboration between stakeholders involved in the change management process. By presenting data in a visual format, such as graphs, charts, and maps, data science can make complex information more accessible and understandable to all stakeholders. This can help ensure that everyone involved in the change management process has a clear understanding of the goals, objectives, and progress of the transition.
Key data science approaches in change management
Conduct a Data Audit
Before embarking on any change management initiative, it’s essential to conduct a data audit to ensure that the data being used is accurate, complete, and consistent. For example, data related to the current status or the baseline, before change takes place. A data audit involves identifying data sources, reviewing data quality, and creating a data inventory. This can help organizations identify gaps in data and ensure that data is available to support the change management process. This includes any impacted stakeholder status or operational data.
During a data audit, change managers should ask themselves the following questions:
What data sources from change leaders and key stakeholders do we need to support the change management process?
Is the data we are using accurate and reliable?
Are there any gaps in our data inventory?
What data do we need to collect to support our change management initiatives, including measurable impact data?
Using Predictive Analytics
Predictive analytics is a valuable data science technique that can be used to forecast the impact of change management initiatives. Predictive analytics involves using historical data to build models that can predict the future impact of change management initiatives. This can help organizations identify potential risks and develop proactive strategies to mitigate those risks.
Change managers can use predictive analytics to answer the following questions:
What is the expected impact of our change management initiatives?
What are the potential risks associated with our change management initiatives?
What proactive strategies can we implement to mitigate those risks?
How can we use predictive analytics to optimize the change management process?
Leveraging Business Intelligence
Business intelligence is a data science technique that involves using tools and techniques to transform raw data into actionable insights. Business intelligence tools can help organizations identify trends, patterns, and insights that can inform the change management process. This can help organizations make informed decisions, improve communication, and increase the efficiency of change management initiatives.
Change managers can use business intelligence to answer the following questions:
What insights can we gain from our data?
What trends and patterns are emerging from our data?
How can we use business intelligence to improve communication and collaboration among stakeholders?
How can we use business intelligence to increase the efficiency of change management initiatives?
Using Data Visualization
Data visualization is a valuable data science technique that involves presenting data in a visual format such as graphs, charts, and maps. Data visualization can help organizations communicate complex information more effectively and make it easier for stakeholders to understand the goals, objectives, and progress of change management initiatives. This can improve communication and increase stakeholder engagement in the change management process.
Change managers can use data visualization to answer the following questions:
How can we present our data in a way that is easy to understand?
How can we use data visualization to communicate progress and results to stakeholders?
How can we use data visualization to identify trends and patterns in our data?
How can we use data visualization to increase stakeholder engagement in the change management process?
Monitoring and Evaluating Progress
Monitoring and evaluating progress is a critical part of the change management process. Data science techniques, such as statistical analysis and data mining, can be used to monitor progress and evaluate the effectiveness of change management initiatives. This can help organizations identify areas for improvement, adjust the change management plan, and ensure that change management initiatives are achieving the desired outcomes.
Change managers can use monitoring and evaluation techniques to answer the following questions:
How can we measure the effectiveness of our change management initiatives? (e.g. employee engagement, customer satisfaction, business outcomes, etc.) And what method do we use to collect the data? E.g. surveys or focus groups?
What data do we need to collect to evaluate the change initiative progress?
How can we use statistical analysis and data mining to identify areas for improvement?
How can we use monitoring of ongoing support or continuous improvement?
The outlined approaches are some of the key ways in which we can use data science to manage the change process. Change practitioners should invest in their data science capability and adopt data science techniques to drive effective change management success. Stakeholders will take more notice of change management status and they may also better understand the value of managing change. Most importantly, data helps to achieve change objectives.
A 2025 Gartner report found that fewer than 25% of organisations have moved beyond basic reporting when it comes to their change management data. Most change teams still rely on spreadsheets, survey snapshots, and anecdotal updates to communicate progress. Yet the same organisations invest heavily in analytics for marketing, finance, and operations. The gap is striking, and it is costing organisations real money in failed adoption, duplicated effort, and invisible change saturation.
Building a genuine change analytics capability is not about buying a dashboard tool and hoping people use it. It is about developing the people, processes, and data foundations that allow your change function to move from reactive reporting to predictive insight. This guide walks through a practical, stage-by-stage approach to building that capability, drawn from patterns observed across enterprise change teams in financial services, government, and large-scale technology transformations.
Why most change teams stall at the reporting stage
There is a critical difference between reporting and analytics, and most change functions confuse the two. Reporting tells you what happened: how many people attended the training, how many communications were sent, what the survey scores were. Analytics tells you what it means: which teams are at risk of adoption failure, where change saturation is building to dangerous levels, and which initiatives are competing for the same audience at the same time.
The reason most teams stall is structural, not technical. They lack three things simultaneously:
A data model that connects change activities to business outcomes rather than tracking them in isolation
An analytical mindset in the team, where practitioners ask “what does this pattern mean?” rather than “what number do the stakeholders want to see?”
A governance structure that makes data collection systematic rather than project-by-project
Until all three are in place, even sophisticated tools produce shallow outputs. A heat map without a data model behind it is just a coloured spreadsheet. A survey without an analytical framework is just a snapshot that tells you nothing about trajectory.
The four stages of change analytics maturity
Based on work across dozens of enterprise change functions, a clear maturity progression emerges. Understanding where your organisation sits on this continuum is the first step toward building capability intentionally rather than haphazardly.
Stage 1: Ad hoc reporting
At this stage, each project or initiative tracks its own metrics in its own way. There is no consistency in what gets measured, how it is collected, or how it is reported. Change managers produce PowerPoint slides with status updates, traffic-light ratings, and anecdotal commentary. The data is retrospective and rarely influences decisions.
You know you are here if your change reporting could be summarised as “things are on track” or “things are at risk” with little quantitative evidence behind either statement.
Stage 2: Standardised measurement
The team has agreed on a common set of metrics and a consistent approach to collecting them. This might include standardised impact assessments, consistent survey instruments, or a shared taxonomy for categorising change types. Data is still largely backward-looking, but it is now comparable across initiatives.
The hallmark of this stage is the ability to answer: “How does initiative A compare to initiative B in terms of employee impact?” If you cannot answer that question with data, you are still in Stage 1.
Stage 3: Integrated analytics
At this stage, change data is connected to other enterprise data sources. You can overlay change impact data with HR data (attrition, engagement scores, absenteeism), project data (timelines, milestones, budget), and operational data (productivity metrics, error rates, customer satisfaction). This is where the real analytical power begins.
A 2023 McKinsey analysis of organisational performance found that companies integrating people analytics with operational data were 2.5 times more likely to outperform peers on financial metrics. The same principle applies to change analytics: integration is what turns reporting into insight.
Stage 4: Predictive and prescriptive capability
The most mature change functions use their data not just to explain what happened, but to predict what will happen. They can model the likely impact of adding a new initiative to an already saturated portfolio. They can identify which business units are approaching adoption fatigue before it manifests in survey scores. They can quantify the productivity cost of overlapping go-lives and present scenario-based alternatives to the portfolio steering committee.
Reaching Stage 4 typically requires 18 to 24 months of sustained investment in data infrastructure, team capability, and stakeholder education. But even partial progress from Stage 1 to Stage 2 delivers measurable improvements in decision quality.
Building the foundation: your change data model
Before investing in tools or training, you need a data model that defines what you will measure, how entities relate to each other, and what questions the data should answer. A robust change data model typically includes five core entities:
Initiatives: the programmes, projects, and BAU changes flowing through the organisation, with attributes for type, size, timing, and strategic alignment
Impacts: the specific changes each initiative imposes on people, categorised by type (process, technology, role, policy, behaviour), intensity, and timing
Audiences: the teams, business units, roles, and locations affected by each impact, with enough granularity to identify overlap and accumulation
Interventions: the change activities delivered (training, communications, coaching, support), linked to specific impacts and audiences
Outcomes: adoption metrics, readiness scores, business performance indicators, and qualitative feedback that track whether the change is landing
The relationships between these entities are what make the model powerful. When you can trace a line from a strategic initiative through its individual impacts to the specific teams affected, and then through the interventions delivered to the adoption outcomes achieved, you have a data model capable of supporting real analytics.
Most organisations attempt to build this model in spreadsheets, which works at small scale but collapses under the weight of a real enterprise portfolio. A Prosci study on organisational change capability identified that teams using purpose-built change management platforms were significantly more likely to sustain their analytics capability over time compared to those relying on generic tools.
Developing analytical skills in your change team
A data model without people who can interpret it is useless. And here is the uncomfortable truth: most change practitioners were not trained in data analysis. Their backgrounds are in communications, psychology, HR, or project management. Asking them to suddenly think in terms of correlation, trend analysis, and statistical significance is unrealistic without deliberate investment.
The good news is that you do not need data scientists. You need practitioners who develop what might be called “analytical fluency”: the ability to look at change data and ask the right questions, spot meaningful patterns, and translate findings into stakeholder language.
Practical steps to build this fluency include:
Data storytelling workshops: Teach the team to construct narratives from data rather than presenting raw numbers. A chart showing change saturation by business unit is data. A narrative explaining why the operations team is at risk of adoption failure because three major initiatives overlap in Q3, and what to do about it, is insight.
Paired analysis sessions: Pair a change practitioner with someone from the data or business intelligence team for regular analysis sessions. The change practitioner brings domain knowledge; the analyst brings technical skill. Over time, both learn from each other.
Hypothesis-driven reviews: Replace status update meetings with hypothesis-driven discussions. Instead of “here is what happened this month,” start with “we hypothesised that the new process rollout would see higher adoption in teams with dedicated change champions. Here is what the data shows.”
Benchmark libraries: Build an internal library of benchmarks from past initiatives. How long does adoption typically take for a technology change versus a process change? What survey scores at the three-month mark predict successful adoption at twelve months? These benchmarks become the foundation for predictive capability.
A 2024 HR Grapevine analysis on people analytics maturity found that the biggest barrier to analytics adoption was not technology but the gap between available data and the ability of HR and change professionals to use it meaningfully. Investing in skill development pays off faster than investing in tools.
Embedding change analytics into governance and decision-making
The final, and often most difficult, step is making sure that change analytics actually influences decisions. Too many organisations build the capability, produce the reports, and then watch as steering committees ignore the data and make politically driven decisions anyway.
Embedding analytics into governance requires three structural changes:
First, change data must be a standing agenda item in portfolio governance meetings. Not an optional appendix, not an “if we have time” discussion, but a required input to every major decision about initiative timing, sequencing, and resourcing. When the portfolio steering committee debates whether to bring forward a new initiative, the change analytics view of current saturation, team capacity, and cumulative impact should be presented alongside the financial business case.
Second, define trigger thresholds that mandate action. Establish clear thresholds: if change saturation in a business unit exceeds a defined level, new initiatives targeting that unit require additional justification and mitigation plans. If adoption metrics fall below a target at a defined milestone, the initiative enters a remediation process. These triggers take analytics out of the advisory space and into the operational space.
Third, report outcomes, not just activities. Senior leaders quickly tune out reports about how many training sessions were delivered or how many communications were sent. They engage when you show them the relationship between change interventions and business outcomes: the correlation between structured change support and faster time-to-competency, or the measurable productivity impact of overlapping go-lives on frontline teams.
According to Gartner’s 2026 change management trends report, organisations that embed data-driven decision-making into their change governance frameworks see 40% higher success rates in complex transformation programmes compared to those relying on qualitative assessment alone.
How digital change tools accelerate analytics capability
Building a change analytics capability does not require starting from scratch. Purpose-built digital change management platforms like The Change Compass provide the data model, collection mechanisms, and visualisation layers that would take months to build manually. They standardise how impacts are assessed, connect initiatives to affected audiences, and generate portfolio-level views that make saturation and overlap immediately visible. For teams moving from Stage 1 to Stage 2, a dedicated platform can compress the journey from years to months by removing the infrastructure burden and letting the team focus on developing their analytical skills.
Where to start this week
If you are reading this and recognising your organisation in Stage 1, here is a practical starting point. Do not try to build everything at once. Pick one initiative currently in flight and apply a structured approach: map its impacts by audience, measure adoption using consistent criteria, and present the findings as a narrative to your steering committee. Use that single case to demonstrate the difference between reporting and analytics. Once stakeholders see what is possible, the conversation about investing in broader capability becomes much easier.
The organisations that build genuine change analytics capability do not do it by accident. They invest deliberately in data models, in their people’s analytical skills, and in governance structures that make data a required input to decisions. The payoff is a change function that can see around corners, anticipate problems before they escalate, and demonstrate its value in the language that senior leaders actually care about: business outcomes.
Frequently asked questions
What is change analytics capability?
Change analytics capability is an organisation’s ability to systematically collect, analyse, and act on data related to change initiatives. It goes beyond basic reporting to include trend analysis, predictive modelling, and data-driven decision-making about how change is planned, sequenced, and delivered across the enterprise.
How long does it take to build change analytics capability?
Moving from ad hoc reporting to standardised measurement typically takes three to six months with focused effort. Reaching integrated analytics, where change data connects to HR and operational data, usually requires 12 to 18 months. Full predictive capability can take two years or more, depending on data infrastructure and team skill levels.
Do I need a data scientist on my change team?
Not necessarily. What you need is analytical fluency: the ability to interpret data patterns, construct hypotheses, and translate findings into actionable recommendations. Pairing change practitioners with existing business intelligence or data teams is often more effective than hiring dedicated data scientists into the change function.
What tools do I need for change analytics?
The most important tool is a consistent data model, not software. That said, purpose-built change management platforms significantly reduce the effort required to collect, structure, and visualise change data. Generic tools like spreadsheets work at small scale but become unmanageable for enterprise portfolios with dozens of concurrent initiatives.
How do I convince senior leaders to invest in change analytics?
Start with a single compelling example. Take one initiative where you can show the relationship between change data and a business outcome, such as how structured adoption support reduced time-to-competency by a measurable amount, or how overlapping go-lives correlated with a spike in customer complaints. One concrete case study is more persuasive than any slide deck about the theoretical value of analytics.