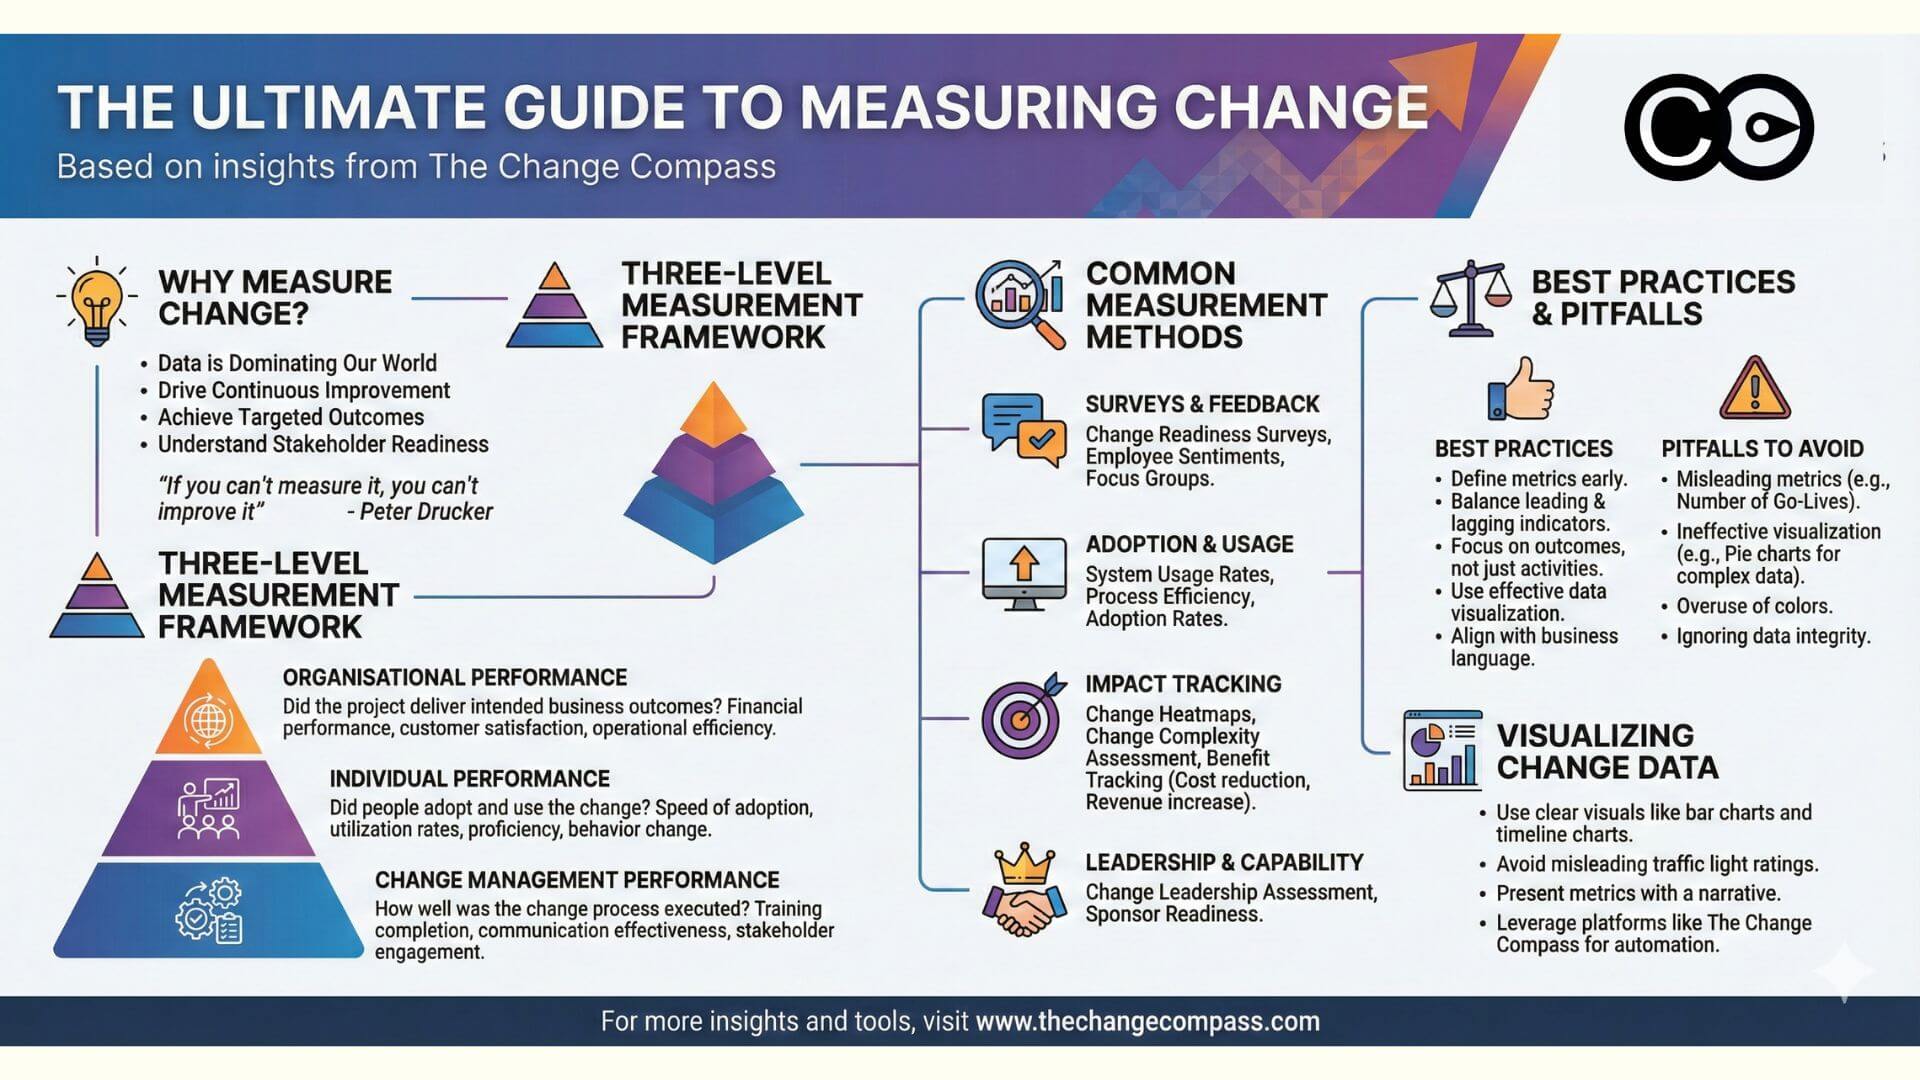
Measuring change management is the practice of capturing whether an organisation’s change activities are landing as intended across a portfolio of initiatives. It covers three distinct layers: project-level metrics that show whether individual initiatives are on track, business-level metrics that show whether outcomes promised in the business case are being achieved, and enterprise-level metrics that show whether the organisation as a whole is becoming more capable of absorbing change. A complete framework reports on all three. Without measurement at each layer, change management becomes a series of activities with no defensible link to business value.
Change measurement translates organisational impact into quantifiable data through surveys, analytics dashboards, and AI-powered tools. Organisations that measure change readiness and adoption rates are 78% more likely to meet project objectives. This guide covers six project-level methods, seven business-level measures, and three enterprise-level frameworks across the Plan-Execute-Realise lifecycle.
A lot of change practitioners are extremely comfortable with saying that change management is about attitudes, behaviours, and feelings and therefore we cannot measure them. This metaphor that change management is ‘soft’ extends into areas such as leadership and employee engagement whereby it may not be easy to measure and track things. However, is it really that because something is harder to measure and less black and white that there is less merit in measuring these?
“If you can’t measure it you can’t improve it” Peter Drucker
The ‘why’ behind a lot of industry change in our day and age comes from the fact that data is now dominating our world. Data is a central part of everything that is changing in our world. Since we are now more reliant on the internet for information, the data that can be collected through our digital interactions around our lives are now driving change. Home assistant Alexa from Amazon can recognize our voices and tell us what we want to know. We can be identified through street cameras. Our Google usage leads to better-targeted advertisements and product promotions. Our Facebook usage leads to a deep understanding of our preferences and lifestyles, and therefore we become targetted by advertisements for what we may find value in (according to Facebook data and algorithms).
So if our world is surrounded by data, why are we not measuring it in managing change? To answer this question let’s look at what we are or are not measuring.
These are some of the common ways in which change is often measured in projects:
Project methods intro
1. Change readiness surveys – What do readiness surveys actually measure?
Change readiness surveys are 5-10 question pulse assessments (Likert + open text) sent via SurveyMonkey/Microsoft Forms at pre-launch, mid-execution, and post-launch. They benchmark stakeholder preparedness, with 92% accuracy when combined with behavioural observations. Top organisations survey quarterly.
Change readiness surveys are usually online surveys sent by a project owner to understand how stakeholder groups are feeling about the change at different points in time throughout the project. It can be in the form on a Likert scale or free text. Most results are summarized into a quantitative scale of the degree in which the group is ready for change. A simple SurveyMonkey could be set up to measure stakeholder readiness for change. ChangeTracking (now part of Accenture) is a comprehensive online tool that measures the change journey and readiness of stakeholder groups throughout the initiative.
2. Training evaluation surveys – How do you prove training ROI?
These evaluations are normally based on participant satisfaction across various categories such as content, instructor effectiveness, usefulness, etc. In a face-to-face training format, these surveys are normally paper-based so as to increase the completion rate. For online or virtual training, ratings may be completed by the user at the conclusion or after the session.
3. Communications metrics – Which comms metrics matter most?
One way in which communications may be measured is the ‘hit rate’ or the number of users/audience that views the article/material/page. This may be easily tracked using Google Analytics that not only tracks number of views per page but also viewership by the time of day/week as well as audience demographic information as such gender and geographical locations.
4. Employee sentiments/culture surveys – What reveals change resistance early?
There are some organisations that measure employee sentiments or culture over the year and often there are questions that are linked to change. These surveys tend to be short and based on a Likert scale with less open-ended questions for qualitative feedback. Since these surveys are often sent across the entire organisation they are a ‘catch-all’ yardstick and may not be specific to particular initiatives.
5. Change heatmaps – When do heatmaps fail (and what works better)?
Some organisations devise change heatmaps on excel spreadsheets to try and map out the extent to which different business units are impacted by change. This artifact speaks to the amount of change and often leads to discussions concerning the capacity that the business has to ‘handle/digest’ change. The problem with most heatmaps is that they are usually categorized and rated by the creator of the artifact (or a limited number of people making judgments), and therefore subject to bias. Data that is based on 1 person’s opinions also tend not to have as much weight in a decision-making forum.
6. Change benefit tracking – How do you track post-launch ROI?
In addition to typical change management measures, there are various initiatives-specific measures that focus on the actual outcome and benefit of the change with the goal of determining to what extent the change has taken place. Some example of this includes:
System usage rates
Cost reduction
Revenue increase
Transaction speed
Process efficiency
Speed of decision making
Customer satisfaction rate
Employee productivity rate
Incidents of process violation
Non-initiative based change management measures
There are two other measures that are used within an organisational vs. initiative-specific context, change leadership assessment and change maturity assessment. In the next section, we will discuss these two areas.
Change leadership assessment
David Miller from Changefirst wrote about 3 types of change leaders.:
1. The sponsor whose role is to drive the initiative to success from the beginning to the end. This involves possessing competencies in rallying and motivating people, building a strong network of sponsors and communicating clearly to various stakeholder groups.
2. The influencer whose role is to leverage their network and influence to market and garner the traction required to make the initiative successful. Four types of influencers as identified by Changefirst includes:
a) Advocates who are great at promoting and advocating the benefits of the change
b) Connectors who are able to link and leverage people across a part of the organisation to support the change
c) Controllers who have control over access to information and people and these could include administrators and operations staff
d) Experts who are viewed by others in the organisation as being technically credible
3. The change agent is someone who is tasked with supporting the overall change in various ways, including any promotional activities, gaging different parts of the organisation on the change and be able to influence, up, down and sideways across the organisation to drive a successful change outcome.
Whilst there isn’t one industry standard tool for assessing change leadership competencies and capabilities. There are various change leadership assessment tools offered by Changefirst as well as other various smaller consulting firms. One of the most comprehensive change leadership assessment tools is by ChangeTracking is the Change Capacity Assessment which is a self-assessment with the broad categories being Goal Attainment, Flexibility, Decision Making, and Relationship Building.
Some of the key competencies critical in change leadership have been called out by Pagon & Banutal (2008), and include:
Goal attainment
Assessing organisational culture and climate
Change implementation
Motivating and influencing others
Adaptability
Stakeholder management
Collaboration
Build organisational capacity and capability for change
Maneuvering around organisational politics
Change maturity assessment
Organisations are increasingly realising that managing change initiative by initiative is no longer going to cut it as it does not enable organisational learning and growth. Initiatives come and go and those who rely on contractor change managers often find that their ability to manage change as an organisation does not mature much across initiatives.
Change maturity assessment is focused on building change capability across the organisation across different dimensions, whether it be project change management or change leadership. The goal of conducting a change maturity assessment is to identify areas in which there may be a capability gap and therefore enable structured planning to close this gap.
There are 2 major change maturity assessment models available in the market. The first is by Prosci and the second is by the Change Management Institute. To read more about change maturity assessment read out article A New Guide for Improving Change Management Maturity, where we outline how to improve change maturity throughout different business units across the organisation.
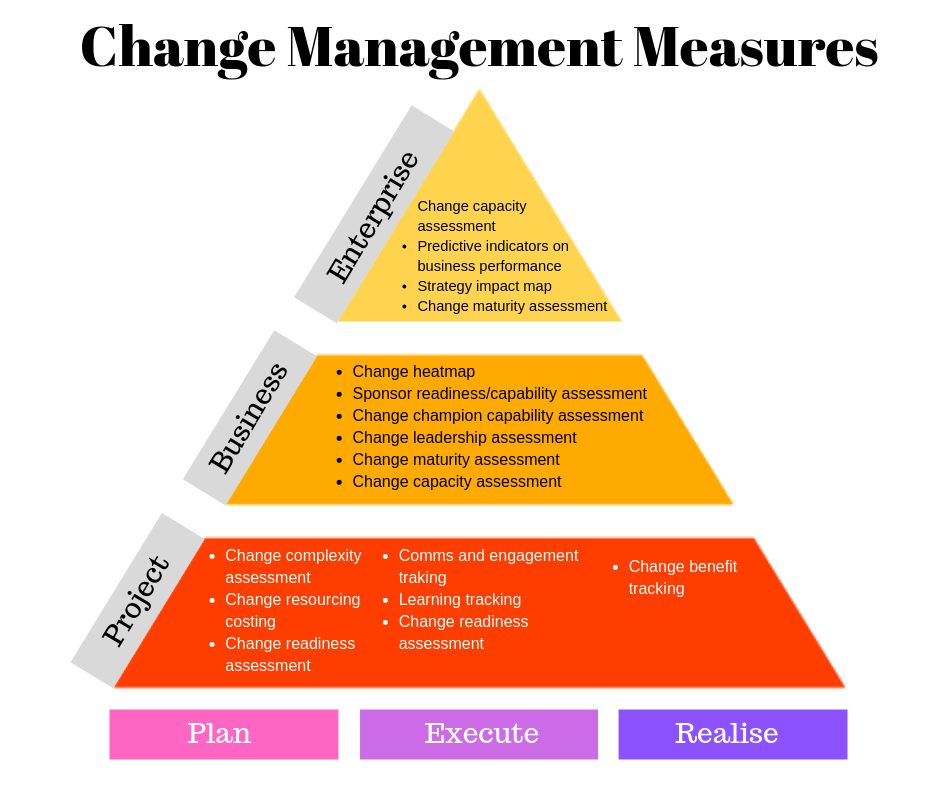
A comprehensive model of Change Management Measures
In this diagram various change management measures are represented along two axes, one being the different phases of the initiative lifecycle, and the other being different organisational levels of project, business and enterprise in which change management measures fall into.
Project level measures
‘Plan’ phase
In this phase of the project, the team is discovering and scoping what the project involves and what the change is. As a result, the details are not known clearly at the commencement of the phase. Later in the phase the scope becomes much clearer and the team starts to plan what activities are required to implement the change.
The change complexity assessment evaluates how complex the project is. It looks at how many people could be impacted, what the size of the impact could be, how many business units are impacted, whether multiple systems and processes are impacted, etc.
Change resourcing costing. At the planning phase of the project cost required for the change management stream of the work is required. This includes such as any contractors, communication campaigns, learning cost, travel, and administration cost, just to name a few.
Change readiness assessment is usually conducted prior to the change and during the change. Usually, the same set of questions is asked of various stakeholder groups to assess their readiness for change.
‘Execute’ phase
The execute phase is one of the most critical parts of the project. Activities are in full flight and the project is busy iterating and re-iterating changes to ensure successful execution to achieve project goals.
Communication and engagement tracking. Effective engagement of stakeholders in the change is absolutely critical. Stakeholder interviews, surveys, communication readership rates are all ways in which engagement may be tracked.
Learning tracking. Measuring learning is critical since it tracks to what extent the new competencies and skills have been acquired through learning interventions. Typical measurements include course tests or quizzes in addition to course evaluations. On the job performance may also be used to track learning outcomes and to what extent learning has been applied in the work setting.
Change readiness assessment continues to be critical to track during the execution phase of the project
‘Realise’ phase
In this phase of the project the change has ‘gone live’ and most project activities have been completed. It is anticipated in this phase that the ‘change’ occurs and that the benefits can then be tracked and measured.
Change benefit tracking measures and tracks the extent to which the targeted benefits and outcomes have been achieved. Some of these measures may be ‘hard’ quantitative measures whilst others may be ‘soft’ measures that are more behavioural.
Business level measures
Business level measures are those that measure to what extent the business has the right ability, capacity, and readiness for the change.
Change heatmaps can help to visualize which part of the business is most impacted by 1 project or multiple projects. The power of the change heatmap is in visualizing which part of the business is the most impacted, and to compare the relative impacts across businesses. As the number of change initiatives increase so would the complexity of the change. When facing this situation organisations need to graduate from relying on excel spreadsheets to using more sophisticated data visualization tools to aid data-based decision making. To read more about change heatmaps and why this is not the only way to understand business change impact, go to The Death of the Change Heatmap.
Sponsor readiness/capability assessment can be a critical tool to help identify any capability gaps in the sponsor so that effort may be taken to support the sponsor. A strong and effective sponsor can make or break a change initiative. Early engagement and support of the sponsor are critical. Both Prosci, as well as Changefirst, have sponsor competency assessment offerings.
Change champion capability assessment. Change champion or change agent are critical ‘nodes’ in which to drive and support change within the organisational network. A lot of change champions are appointed only for one particular initiative. Having a business-focus change champion network means that their capability can be developed over time, and they can support multiple initiatives and not just one. Assessing and supporting change champion capability would also directly translate to better change outcomes.
Change leadership and change maturity assessment – refer to the previous section
Change capacity assessment.
In an environment where there is significant change happening concurrently, careful planning and sequencing of change in balance with existing capacity are critical. There are several aspects of change capacity that should be called out in the measurement process:
Different parts of the business can have different capacity for change. Those parts of the business with better change capability, and perhaps with better change leadership, are often able to receive and digest more changes than other businesses that do not possess the same level of capability.
Some businesses are much more time-sensitive and therefore their change capacity needs to be measured with more granularity. For example, call centre staff capacity is often measured in terms of minutes. Therefore, to effectively plan for their change capacity, the impacts of change needs to be quantified and articulated in a precise, time-bound context so that effective resourcing can be planned in advance.
The change tolerance or change saturation level for business needs careful measurement in combination with operational feedback to determine. For example, it could be that last month a part of the business experienced significant change impact across several initiatives happening at the same time. The operational indicators were that there was some impact on customer satisfaction, productivity, and there were negative sentiments reported by staff that there was too much change to handle. This could mean that the change tolerance level may have been exceeded. With the right measurement of change impact levels for that part of the business, next time this level of change is seen, previous lessons may be utilized to plan for this volume of change. Utilise measurement and data visualization tools such as the Change Compass to track change capacity.
Enterprise level change measures
At an enterprise level, many of the business unit level measures are still applicable. However, the focus is comparing across different business units to sense-make what each part of the business is going through and if the overall picture is aligned with the intentions and the strategic direction of the organisation. For example, typical questions include:
Is it surprising that one part of the business is undergoing significant change whilst another is not?
Is there a reason that one business unit is focused on a few very large changes whilst for other business units there is a larger set of changes each with smaller impacts?
Is the overall pace of change optimum according to strategic intent? Does it need to speed up or slow down?
What is the process to govern, report and make decisions on enterprise level change, prioritization, sequencing and benefit realization?
Is there one business unit that is able to manage change more effectively, faster with greater outcomes? How can other business units leverage any internal best practices?
As mentioned in the Change Management Measures diagram, some enterprise level change measures include:
Change capacity assessment – Does one business unit’s change capacity limits mean that we are not able to execute on a critical strategy within the allocated time? How do we create more capacity? Ways in which to create more capacity could include more resources such as staff, or initiative funding, more time is given, or more talent to lead initiatives
Change maturity assessment – At an enterprise level, the concern is with the overall change maturity of the organisation. How do we implement enterprise level interventions to build change maturity through programs, networks, and exchanges, such as:
Enterprise change capability programs
Enterprise change analytics and measurement tools
Enterprise change methodology
Enterprise network of change champions
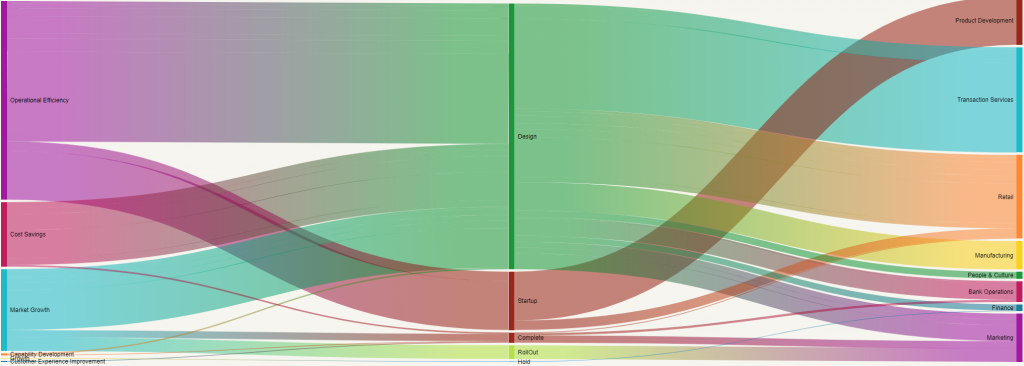
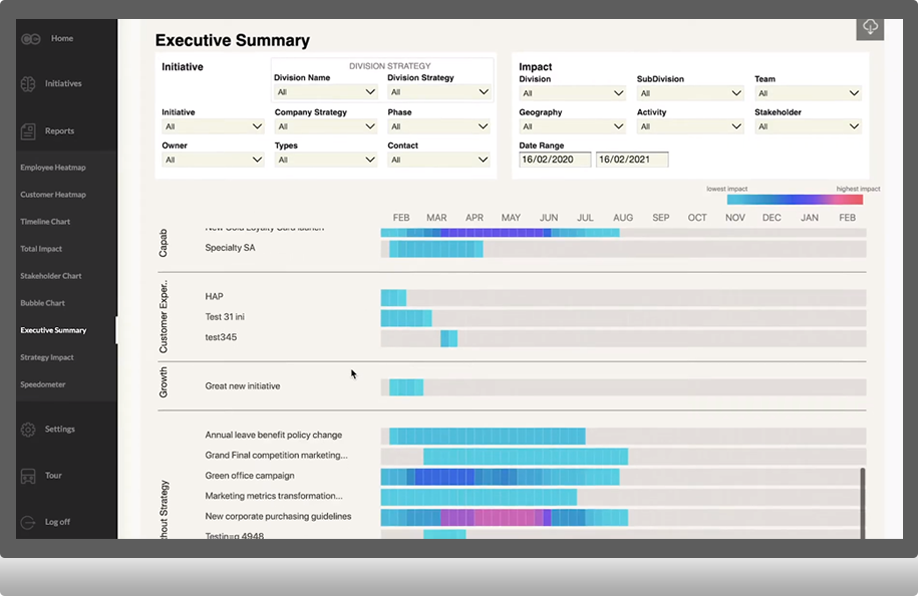
Strategy impact map – Change management need not be focused only on project execution or business unit capability. It can also demonstrate value at an enterprise level by focusing on strategy execution (which by definition is change). The way in which different strategies exert impact on various business units may be visualized to help stakeholder understand which initiatives within which strategic intent impact which business units. To illustrate this please refer to the below diagram which is an example of a strategy impact map. In this diagram, each of the organisation’s strategy is displayed with different initiatives branching out of each strategy. The width of each initiative correlates with the level of impact that the initiative has on the business over a pre-determined period of time. Therefore, the width of each strategy also indicates the overall relative impact on the business.
This data visualization artifact can be valuable for business leaders and strategic planning functions as it depicts visually how the implementation of various strategies is impacting business units. This helps planners to better understand strategy implementation impacts, potential risks and opportunities, and balancing change pace with strategy goals at various points in time.
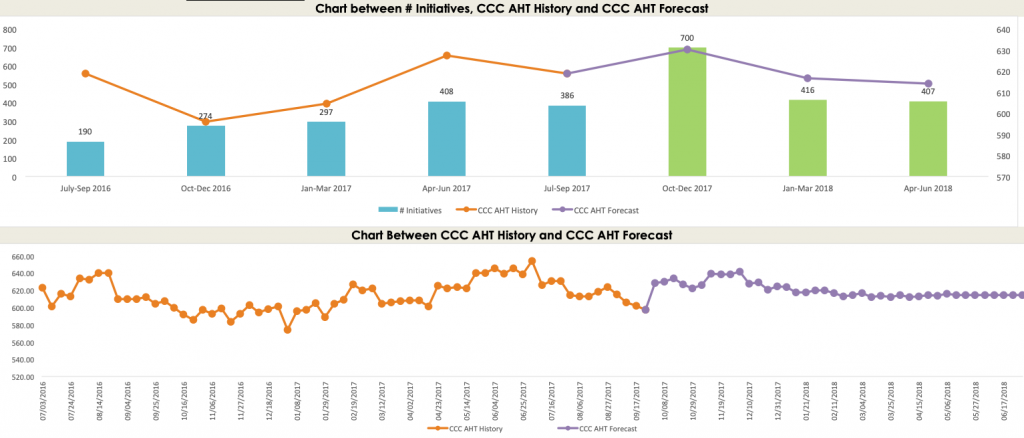
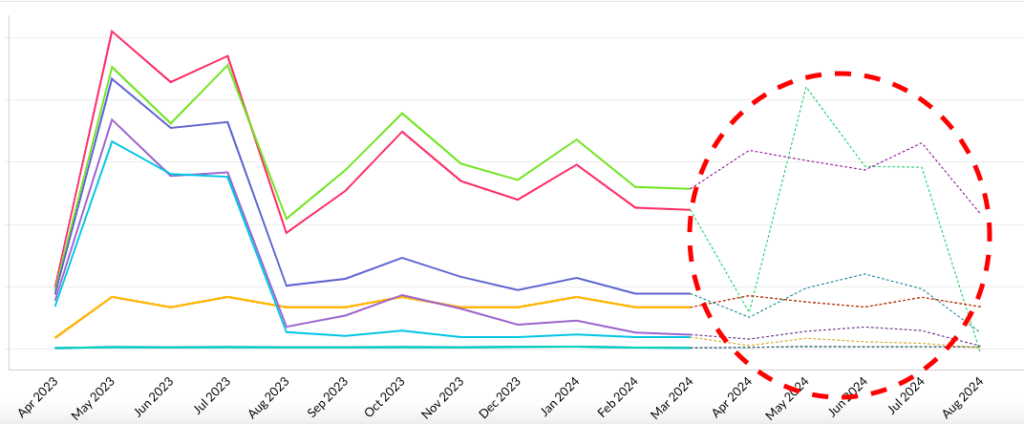
Predictive indicators on business performance – We started this article talking about how data is all around us and we also need to better manage change using data. With quantitative data on change impact, it is possible to ascertain any correlations with operational business indicators such as customer satisfaction, service availability, etc. For those business indicators where there is a significant correlation, it is possible to hence use predictive reporting to forecast performance indicator trends, given planned change impacts.
In the below graph you can see an example of this whereby using historical data it is possible to establish correlations and therefore forecast future impact on business indicators. This example is focused on the customer contact centre (CCC) and key business indicator of average handling time (AHT) is utilized as an illustration.
This type of predictive performance forecasting is extremely valuable for organisations undergoing significant change and would like to understand how change may impact their business performance. By demonstrating the impact on business indicators, this puts the importance of managing change at the front and centre of the decision-making table. At The Change Compass, we are developing this type of measurement and reporting function. This is the frontier for change management – to be established as a key business-driving function (versus a standard back-office function).
Change can be measured and this article has outlined various operational and strategic ways in which change measurement can demonstrate significant value. Most corporate functions cannot exist without data and analytics. For example, Human Resources relies on people and pay data. Marketing cannot function without measurement of channel and campaign effectiveness. For Information Technology, pretty much everything is measured from system usage, to cost, to efficiency. It is time we start utilizing data to better visualize change to better plan and make business decisions.
References:
Miller, David (2011) Successful Change. How to implement change through people. Changefirst Ltd.
Pagon & Banutal (2008) Leadership Competencies for Successful Change Management. Study Report. University of Maribor.
Frequently Asked Questions (FAQ)
What are the most important change management metrics to track? Focus on adoption rates, readiness scores, communication engagement, and benefit realisation metrics tailored to project phases and business capacity.
How do you measure change readiness effectively? Combine pulse surveys with behavioural indicators and sponsor assessments. Balance frequency with depth for actionable insights. Read “Beyond the Survey: A Strategic Lens on Change Readiness Assessment.”
Why replace change heatmaps with other visuals? Heatmaps introduce subjectivity bias. Timeline charts and capacity dashboards provide clearer decision-making data. See “The Death of the Change Heatmap.”
What role does AI play in change measurement? AI enables real-time sentiment analysis, predictive capacity planning, and automated risk detection across initiatives. Platforms integrate natural language queries for instant insights.
How many change metrics should organisations track? Target 8-15 core metrics aligned with strategic objectives across project, business, and enterprise levels to maintain focus and actionability.
What enterprise-level change metrics matter most? Strategy impact mapping, cross-business capacity analysis, and predictive performance forecasting linking change volume to operational outcomes.
How to Measure Change Management Effectively: A 5-Step Framework
Measuring change management effectively requires a framework that covers the full lifecycle of the change – from pre-change baseline through to sustained adoption tracking. The five steps below reflect the approach used by experienced change practitioners and data-driven change teams.
Step 1 – Establish a Change Measurement Framework: Define what you are measuring and why before selecting metrics. A change measurement framework should cover three levels: activity metrics (what the change team is doing), readiness metrics (how prepared people are), and adoption metrics (whether people have actually changed their behaviour).
Step 2 – Set a Baseline Before the Change: Measure the current state before the change is implemented. Without a baseline, it is impossible to demonstrate the impact of the change management effort or to identify where readiness is lowest.
Step 3 – Track Readiness at Key Milestones: Conduct readiness assessments at defined milestones – typically at the start of the programme, 30-60 days before go-live, and at go-live. Readiness assessments should cover awareness, understanding, capability, and commitment for each affected stakeholder group.
Step 4 – Measure Adoption After Go-Live: Track adoption metrics in the weeks and months after go-live. Key indicators include system usage rates, process compliance, error rates, workaround behaviour, and performance recovery back to baseline.
Step 5 – Report and Act on Measurement Data: Use measurement data to drive decisions – not just to report status. When adoption is lagging in a specific group, use the data to identify the barrier and target an intervention.
This guide focuses on the complete measurement framework, design, run, and report change measurement end-to-end. Three closely related guides on this site each cover a distinct angle, pick the one that matches what you need now:
Every large organisation generates significant volumes of change management data. Readiness assessments, impact analyses, stakeholder surveys, adoption trackers, change plans, training records. Most of it is created at the project level, used briefly, and then archived when the project closes. The insight it could generate, about what kinds of change land well, which stakeholder groups are consistently resistant, how cumulative load affects adoption, which interventions work in your culture, largely disappears.
This disposal of valuable data is one of the most common and least-discussed limitations of how organisations currently approach change management. When change data is managed tactically, it serves only the project that created it. When it is managed strategically, it becomes an organisational asset that improves the quality of change decisions across the portfolio, year on year.
Capgemini Invent’s 2023 change management study, surveying 1,175 professionals globally, found that high data maturity in change programmes correlates with a 27% improvement in change success rates, and that data-driven leadership adds a further 23% lift. The research is unambiguous: how you manage change management data is a meaningful predictor of transformation outcomes.
This article is about making that shift, from tactical, project-level data management to strategic change data management that builds cumulative intelligence about how change works in your organisation.
The four common failure modes of change data management
Most organisations do not set out to manage change data poorly. The failure modes are structural, rooted in how change management work is organised rather than individual capability gaps.
Data collection is ad hoc and project-specific. When each project team designs their own impact assessment templates, readiness survey questions, and adoption tracking approaches, the data produced is genuinely useful within that project and largely useless outside it. There is no consistent taxonomy, no standard scales, and no common definitions. When you try to ask a cross-portfolio question , “which of our business units consistently shows lower adoption rates?” , the data cannot answer it because it was never designed to be aggregated.
Data lacks factual grounding. A significant proportion of change data is perception-based, reflecting what change managers think about stakeholder readiness or impact severity rather than what the evidence shows. Heat maps built on subjective ratings, readiness assessments scored by the project team rather than the affected employees, and impact analyses that reflect project plan assumptions rather than actual operational context all share this weakness. The data is not wrong, exactly, but its evidential basis is thin and rarely documented. When challenged by senior stakeholders, it is difficult to defend.
Visualisation obscures rather than reveals. The way change data is visualised has a substantial effect on whether it drives decisions. A heat map that shows everything as amber is not a useful risk management tool; it has simply translated uncertainty into colour. Visualisations that use the wrong chart type for the underlying data pattern, or that present too many variables at once, or that aggregate data in ways that mask important distribution effects, are actively misleading even when the underlying data is sound.
Data is not retained as an asset. When a programme closes, its change data typically closes with it. The lessons embedded in three years of readiness assessments, adoption surveys, and stakeholder feedback are lost. The next programme team starts from scratch, repeating the same diagnostic work, making the same assumptions, and potentially encountering the same predictable resistance that a prior team navigated successfully. This waste is invisible because no one tracks the cost of reinventing the wheel, but it is substantial.
What strategic change management data management actually means
Strategic change management data management is the practice of designing, collecting, governing, and preserving change data as a reusable organisational asset rather than a project-level administrative product. It has five characteristics that distinguish it from tactical data management.
Consistent taxonomy and definitions
A strategic approach starts with agreement on what you are measuring and how. What does ‘high impact’ mean in your organisation’s context? How is change readiness defined and at what granularity? What are the stages of adoption your organisation recognises, and what observable behaviours characterise each stage? These definitions need to be documented, agreed by change leadership, and applied consistently across every programme in the portfolio.
This sounds straightforward but is often contentious, because standardisation requires programme teams to give up some flexibility in how they approach impact assessment and readiness measurement. The benefit, however, is that every new dataset generated becomes immediately comparable with every prior dataset, and portfolio-level analytics become possible.
Portfolio-level collection and aggregation
Individual programme data is useful to the programme team. Portfolio-level data, aggregated across all active and historical programmes, is useful to the change function leadership, to HR, to business unit heads, and to the executive team. Strategic change data management designs data collection with portfolio aggregation in mind from the outset, not as an afterthought.
The questions that portfolio-level change data can answer are categorically more strategic than those accessible from project-level data. Which business units are accumulating unsustainable change load this quarter? Which change types consistently generate higher resistance in your culture? Which combinations of interventions correlate with faster adoption in your organisation specifically? These are the questions that allow a change function to operate proactively rather than reactively.
Fact-based data quality standards
Strategic change data management requires documented standards for what constitutes adequate evidence for different data types. Stakeholder impact ratings should be supported by operational analysis, not solely by project team estimation. Readiness assessments should include both leader perceptions and employee-level indicators, because they frequently diverge. Adoption metrics should triangulate system usage data, survey data, and direct observation rather than relying on a single source.
This does not mean perfection is required before data can be used. It means being explicit about the evidential basis of data and the uncertainty that attaches to it. A readiness rating of 65% that is based on a 40-respondent employee survey is meaningful. The same rating based on a change manager’s estimate without respondent data should be labelled and treated differently.
Retention and longitudinal analysis
One of the most underexploited opportunities in change management is longitudinal analysis of your organisation’s own change history. If your organisation has been running significant change programmes for five or more years, and if that data has been retained in a structured format, you have the basis for genuinely organisation-specific benchmarks.
What percentage of employees in your operations function were typically at target adoption six months after a technology rollout in the past? What does the readiness trajectory typically look like for a business unit facing a structural reorganisation? These organisation-specific patterns are more useful for planning purposes than generic research benchmarks, because they reflect your culture, your leadership style, and your workforce characteristics.
A governance structure for change data
Strategic change data management requires governance: clear ownership, defined data standards, review cycles, and access controls. Without governance, standards erode over time as programme teams revert to their preferred approaches, data quality degrades, and the portfolio view becomes unreliable.
Governance for change data does not need to be elaborate. A data steward role within the change function, clear standards documentation, a quarterly review of data quality across the portfolio, and a defined retention policy are sufficient for most large organisations. The key is that someone is accountable for the quality of the organisational change data asset, not just the quality of their own programme’s data.
AI and automation: what they add to strategic change data management
The intersection of artificial intelligence and change management data is generating genuine capability improvements, particularly in the speed of synthesis and the detection of patterns that manual analysis would miss.
Capgemini’s concept of Intelligent Data-Driven Change Management (IDCM) combines human emotional intelligence with algorithmic insights to support change decisions. In practical terms, this means AI that can monitor multiple data streams simultaneously (survey results, system usage, engagement metrics, communication analytics) and surface signals that warrant human attention, rather than requiring change managers to manually synthesise all of this information.
Key AI applications in strategic change data management include:
Natural language processing of stakeholder feedback and open survey responses, identifying sentiment patterns and emerging concerns at scale without manual qualitative coding
Anomaly detection in adoption curves, flagging when a stakeholder group’s trajectory deviates significantly from expected patterns
Predictive modelling of adoption outcomes based on historical programme data, adjusted for current programme characteristics and context
Automated generation of executive summaries from portfolio data, reducing the reporting burden on change teams while improving reporting consistency
It is important to be clear about what AI does not replace. It does not replace the judgment required to understand why a stakeholder group is resistant, the relationship-building required to address that resistance, or the strategic thinking required to sequence programmes effectively. AI in change management is most valuable as a signal amplifier, drawing human attention to where it is most needed. The strategic framework within which those signals are interpreted remains a human responsibility.
Building a change data ecosystem
For organisations ready to move beyond ad-hoc data management, a change data ecosystem is the infrastructure that makes strategic change data management operational.
A change data ecosystem has three layers. The collection layer is where data enters the system: programme impact assessments, readiness surveys, adoption tracking, training completion, and communication analytics. The aggregation layer is where programme-level data is normalised, consolidated, and stored in a format that enables cross-programme analysis. The decision layer is where the data is used: executive dashboards, portfolio risk views, programme intervention decisions, and historical benchmarks.
Platforms like The Change Compass are purpose-built for this architecture, specifically for the challenge of visualising cumulative change load and adoption status across a complex change portfolio. The value of purpose-built change management software, compared to using general-purpose business intelligence tools, is that the data models and analytical frameworks are pre-configured for change management use cases. You are not building the methodology from scratch; you are applying it.
The shift from reporting to decision intelligence
The ultimate destination of strategic change management data management is decision intelligence: a state where change data actively informs decisions about sequencing, resourcing, intervention design, and programme prioritisation in real time rather than retrospectively.
This virtuous cycle is what mature change functions are beginning to achieve. They use data to improve programmes, which generates better data, which improves the next generation of programmes. The cumulative knowledge advantage this creates over time is significant and durable.
Getting there requires investment in the governance, tooling, and cultural change described in this article. But the starting point is simpler than it might appear. Pick one consistent definition. Apply it across your active programmes. Retain the data when those programmes close. Review what the combined data tells you at the end of the year. You will have begun the shift from tactical to strategic change data management, and the first cycle of learning will show you exactly why it matters.
Frequently asked questions
What is strategic change management data?
Strategic change management data is change-related information that is designed, collected, and governed as an organisational asset rather than a project-level administrative record. It includes readiness assessments, adoption metrics, impact analyses, and stakeholder data that are standardised across programmes and retained for portfolio-level analysis and longitudinal learning.
Why is change management data difficult to manage strategically?
The primary challenge is that change work is traditionally organised at the project level, where data serves only the immediate programme. Creating strategic value from change data requires cross-programme standardisation, governance ownership, and retention infrastructure, none of which emerge naturally from project-centric delivery structures.
How does data maturity affect change management outcomes?
Capgemini Invent’s research found that organisations with high data maturity in their change programmes achieve 27% higher success rates. The mechanism is that mature data management enables faster, more targeted interventions, better portfolio decisions, and more credible reporting to executive stakeholders, all of which directly improve adoption outcomes.
What role does AI play in change management data?
AI tools in change management primarily serve as pattern recognition and signal amplification tools. They can process large volumes of survey data, monitor multiple data streams simultaneously, and flag anomalies in adoption curves that warrant human attention. They do not replace the judgment, relationship, and strategic capabilities of change practitioners; they help those capabilities operate at a scale that manual analysis cannot support.
How should change data be governed?
Effective governance for change data requires a designated data steward, documented standards for data definitions and collection methods, a quality review cycle (typically quarterly), and a retention policy that specifies how long data from completed programmes is preserved and in what format. Governance does not need to be complex, but it does need to be explicit and owned.
Where should an organisation start in managing change data more strategically?
Start with taxonomy. Agree on consistent definitions for impact rating, readiness scoring, and adoption stages across your active change portfolio. Apply those definitions in your next programme cycle. Retain the data when programmes close. Then, at the end of a 12-month cycle, review the combined dataset and ask what questions it can answer that you could not previously answer. The value of the investment will be visible in the first year.
References
Capgemini Invent. Change Management Study 2023. https://www.capgemini.com/insights/research-library/change-management-study-2023/
Capgemini. Data-Driven Change Management is Crucial for Successful Transformation. https://www.capgemini.com/news/press-releases/data-driven-change-management-is-crucial-for-successful-transformation/
ResearchGate. The Role of Change Management in Enhancing Data-Driven Decision Making: Insights from Business Intelligence Initiatives (2024). https://www.researchgate.net/publication/384017092_The_Role_of_Change_Management_in_Enhancing_Data-Driven_Decision_Making_Insights_from_Business_Intelligence_Initiatives
Prosci. The Correlation Between Change Management and Project Success. https://www.prosci.com/blog/the-correlation-between-change-management-and-project-success
Panorama Consulting. Top Organizational Change Management Trends for 2025. https://www.panorama-consulting.com/top-change-management-trends-for-2025/
Change management is often seen as a ‘soft’ discipline that is more an ‘art’ than science. However, successful change management, like managing a business, relies on having the right data to understand if the journey is going in the right direction toward change adoption. The data can inform whether the objectives will be achieved or not.
Data science has emerged to be one of the most sought-after skills in the marketplace at the moment. This is not a surprise because data is what powers and drives our digital economy. Data has the power to make or break companies. Companies that leverages data can significant improve customer experiences, improve efficiency, improve revenue, etc. In fact all facets of how a company is run can benefit from data science. In this article, we explore practical data science techniques that organizations can use to improve change outcomes and achieve their goals more effectively.
Improved decision making
One of the significant benefits of using data science in change management is the ability to make informed decisions. Data science techniques, such as predictive analytics and statistical analysis, allow organizations to extract insights from data that would be almost impossible to detect or analyse manually. This enables organizations to make data-driven decisions that are supported by empirical evidence rather than intuition or guesswork.
Increased Efficiency
Data science can help streamline the change management process and make it more efficient. By automating repetitive tasks, such as data collection, cleaning, and analysis, organizations can free up resources and focus on more critical aspects of change management. Moreover, data science can provide real-time updates and feedback, making it easier for organizations to track progress, identify bottlenecks, and adjust the change management plan accordingly.
Improved Accuracy
Data science techniques can improve the accuracy of change management efforts by removing bias and subjectivity from decision-making processes. By relying on empirical evidence, data science enables organizations to make decisions based on objective facts rather than personal opinions or biases. This can help reduce the risk of errors and ensure that change management efforts are based on the most accurate and reliable data available.
Better Risk Management
Data science can help organizations identify potential risks and develop contingency plans to mitigate those risks. Predictive analytics can be used to forecast the impact of change management efforts and identify potential risks that may arise during the transition. For example, change impacts across multiple initiatives against seasonal operations workload peaks and troughs.
Enhanced Communication
Data science can help facilitate better communication and collaboration between stakeholders involved in the change management process. By presenting data in a visual format, such as graphs, charts, and maps, data science can make complex information more accessible and understandable to all stakeholders. This can help ensure that everyone involved in the change management process has a clear understanding of the goals, objectives, and progress of the transition.
Key data science approaches in change management
Conduct a Data Audit
Before embarking on any change management initiative, it’s essential to conduct a data audit to ensure that the data being used is accurate, complete, and consistent. For example, data related to the current status or the baseline, before change takes place. A data audit involves identifying data sources, reviewing data quality, and creating a data inventory. This can help organizations identify gaps in data and ensure that data is available to support the change management process. This includes any impacted stakeholder status or operational data.
During a data audit, change managers should ask themselves the following questions:
What data sources from change leaders and key stakeholders do we need to support the change management process?
Is the data we are using accurate and reliable?
Are there any gaps in our data inventory?
What data do we need to collect to support our change management initiatives, including measurable impact data?
Using Predictive Analytics
Predictive analytics is a valuable data science technique that can be used to forecast the impact of change management initiatives. Predictive analytics involves using historical data to build models that can predict the future impact of change management initiatives. This can help organizations identify potential risks and develop proactive strategies to mitigate those risks.
Change managers can use predictive analytics to answer the following questions:
What is the expected impact of our change management initiatives?
What are the potential risks associated with our change management initiatives?
What proactive strategies can we implement to mitigate those risks?
How can we use predictive analytics to optimize the change management process?
Leveraging Business Intelligence
Business intelligence is a data science technique that involves using tools and techniques to transform raw data into actionable insights. Business intelligence tools can help organizations identify trends, patterns, and insights that can inform the change management process. This can help organizations make informed decisions, improve communication, and increase the efficiency of change management initiatives.
Change managers can use business intelligence to answer the following questions:
What insights can we gain from our data?
What trends and patterns are emerging from our data?
How can we use business intelligence to improve communication and collaboration among stakeholders?
How can we use business intelligence to increase the efficiency of change management initiatives?
Using Data Visualization
Data visualization is a valuable data science technique that involves presenting data in a visual format such as graphs, charts, and maps. Data visualization can help organizations communicate complex information more effectively and make it easier for stakeholders to understand the goals, objectives, and progress of change management initiatives. This can improve communication and increase stakeholder engagement in the change management process.
Change managers can use data visualization to answer the following questions:
How can we present our data in a way that is easy to understand?
How can we use data visualization to communicate progress and results to stakeholders?
How can we use data visualization to identify trends and patterns in our data?
How can we use data visualization to increase stakeholder engagement in the change management process?
Monitoring and Evaluating Progress
Monitoring and evaluating progress is a critical part of the change management process. Data science techniques, such as statistical analysis and data mining, can be used to monitor progress and evaluate the effectiveness of change management initiatives. This can help organizations identify areas for improvement, adjust the change management plan, and ensure that change management initiatives are achieving the desired outcomes.
Change managers can use monitoring and evaluation techniques to answer the following questions:
How can we measure the effectiveness of our change management initiatives? (e.g. employee engagement, customer satisfaction, business outcomes, etc.) And what method do we use to collect the data? E.g. surveys or focus groups?
What data do we need to collect to evaluate the change initiative progress?
How can we use statistical analysis and data mining to identify areas for improvement?
How can we use monitoring of ongoing support or continuous improvement?
The outlined approaches are some of the key ways in which we can use data science to manage the change process. Change practitioners should invest in their data science capability and adopt data science techniques to drive effective change management success. Stakeholders will take more notice of change management status and they may also better understand the value of managing change. Most importantly, data helps to achieve change objectives.
Captured during a 5-day trek in Tasmania’s southwestern wilderness known as the Western Arthurs, this photograph reflects a journey undertaken four years prior, just before devastating bushfires swept through Tasmania, altering its pristine landscapes. The region, notorious for persistent rain and limited sunshine, graced us with consecutive sunlit days, making it a standout global hiking experience, rivaling trails in the Italian Dolomites, the Himalayas, and the Canadian Rockies.
Embarking on a 5-day expedition in Tasmania’s southwest demands self-sufficiency—carrying all your food, drinking from rivers, and sleeping in a tent with no huts or running water. The solitude is profound, with few fellow hikers; most of the time, it’s just you and Mother Nature.
Childhood lessons painted Mother Nature as a battlefield for survival, where each tree competes fiercely for sunlight, nutrients, and dominance over the land. However, this narrative is challenged by Suzanne Simard, a professor of forest ecology at the University of British Columbia. Over two decades of study revealed that a forest’s essence lies not in individual tree struggles but in subterranean partnerships. Simard unveiled the symbiotic relationship between trees and fungi, known as mycorrhizas—thread-like fungi merging with tree roots. They aid trees in extracting water and nutrients, receiving carbon-rich sugars produced through photosynthesis in return. (For more details, refer to the New York Times article.)
Mycorrhizas serve as the connective tissue of the forest, intertwining trees of different species through an extensive web. This transforms the forest into more than a mere collection of trees. In times of crisis, a tree at the brink of death may altruistically share a substantial portion of its carbon with neighboring trees. The forest thus emphasizes cooperation, negotiation, reciprocity, and selflessness alongside survival and competition.
Remarkably, this ecosystem mirrors the principles of effective change networks. A change network possesses the capacity to reach every individual in a company. Unlike being confined to a specific business unit or hierarchy level, a well-designed change network transcends organizational boundaries.
Let’s delve deeper into the characteristics of a robust and efficient change network…
1) Project-agnostic
In the dynamic landscape of change networks, a paradigm shift from the traditional project-specific model to a project-agnostic approach emerges as a strategic imperative. The conventional methodology, with its exclusive focus on single projects, often results in a staggering 69% of projects achieving initial objectives, while 15% are considered failures. This project-specific model, besides its high failure rate, also contributes to significant resource wastage. Identifying, training, and sustaining a robust change champion network for each project frequently overshoots the project’s lifecycle, hindering desired outcomes and accounting for the 70% failure rate in projects.
Contrastingly, a more efficient paradigm involves nurturing change champions with the ability to support multiple projects. This not only optimizes resource allocation but also aligns with the agile principle, as highlighted by the 56% of companies that exclusively use a single project management methodology.
These versatile change champions, akin to Starbucks’ “My Starbucks Idea” initiative, play a pivotal role in connecting the dots across projects, providing invaluable insights, and fostering a culture of collaboration. Starbucks’ successful implementation of change through customer-driven ideas, resulting in over 5 million monthly page visits, is a testament to the power of adaptable change networks.
Drawing a parallel to the natural world, where mycorrhizas take time to strengthen and fortify the forest, change champions undergo a transformative journey with each project involvement. Their sustained engagement refines their change management skills and delivery expertise, enhancing their proficiency with every endeavor.
The diverse and creative approaches observed in change champions, ranging from themed outfits to innovative reminders, reflect the adaptability crucial for effective end-user engagement. This adaptability serves as the cornerstone of a thriving change champion network, where experimentation and varied strategies contribute to its vibrancy and success. Similar to the ever-evolving forest ecosystem, change networks flourish when nurtured with creativity and adaptability.
2) Cuts across layers
In the realm of change networks, adopting a project-agnostic approach emerges as a strategic shift from the traditional project-specific model. The conventional method involves forming change networks tailored exclusively to a single project, with champions disbanded at the project’s conclusion.
However, this model poses inherent challenges, leading to significant resource wastage. The effort to identify, train, and sustain a robust change champion network for each project often exceeds the project’s lifespan, impeding desired outcomes.
To address this, the change champion network needs to cut across not only different parts of the business but also different layers of the organization. A lot of change champion networks are designed at the mid-layer of the organization, typically involving middle managers. While middle managers can influence the outcome of the change more than frontline staff members, relying solely on this layer may not be sufficient.
Here’s why:
Detail Feedback: Middle managers are often not the ‘end users’ of systems or processes, making it challenging for them to provide detailed feedback on the suitability of the change, sentiments of end users, or necessary adjustments in the change solution.
Signal Loss: Depending on the organization, there may be 1-3 layers between middle managers and end users, resulting in potential ‘signal loss’ where thoughts, emotions, and feedback from the lowest layers of the organization may not be effectively communicated.
Limited Testing Input: Middle managers are usually not directly involved in system or process testing, limiting their ability to provide detailed input to shape the change. Their contributions often focus on higher-level strategies for engaging impacted teams.
To build a strong, vibrant, and extensive change champion network, engagement needs to extend to different layers of the organization, not just the middle layers but also the lower layers. While top layers may be engaged through various committees, middle and lower layers require dedicated change champions.
Similar to the mycorrhizas connecting different trees in a forest, the change champion network, when stronger and more extensive, becomes more capable of influencing and driving change both vertically and horizontally across the company. This inclusivity ensures that smaller business groups are not neglected or deprioritized, contributing to the overall success and adaptability of the change network.
3) Routine interfaces
In the intricate ecosystem of a forest, mycorrhizas play a vital role by providing essential sustenance, and supplying critical nitrogen, water, and other nutrients to plants. In the organizational landscape, change champions serve a similar crucial function. Armed with comprehensive knowledge and a deep understanding of the change, along with the latest updates on its impacts, they possess the ability to interpret messages in a way that resonates with those directly affected, using a language that is tailored to each team’s unique history, priorities, and culture.
Unlike program-level communication, which may be too generalized, the interaction with change champions is a dynamic, two-way process. They engage with impacted employees, actively assessing and understanding where individuals stand in their change journey. This engagement leads to a clear comprehension of the specific communication, learning, or leadership support needs of impacted teams. High-performing change champions delve beyond the surface, understanding the motivations and demotivators of the teams they serve. This wealth of insights becomes a powerful set of messages that can be fed back to the central project mothership.
What sets high-performing change champions apart is not just their ability to communicate and collect feedback; they proactively sense-check and virtually “walk the floor” to feel the pulse of the employees. Often, change champions are directly impacted by themselves, fostering a natural empathy that enables them to connect with others undergoing change. In this dynamic, there is a delicate balance between self-interest and selflessness, as change champions strive not only to navigate their own challenges but also to extend support and assistance to those in need. This nuanced approach mirrors the harmony found in natural ecosystems, where organisms cooperate for mutual benefit.
4) Cross-network collaboration
Within the expansive framework of an extensive change network, diverse sub-teams of change champions naturally emerge, often organized by business units or grade levels. While connecting with peers within the same level might be straightforward, establishing collaboration across hierarchies, especially with those perceived as ‘managers,’ can pose challenges.
To overcome these challenges, intentional routines must be established to facilitate frequent sharing and collaboration among different change champion teams. In the natural world, trees emit chemical alarm signals to warn nearby trees of potential danger. Similarly, within a business context, a team from one business unit may sense a looming risk for change failure based on their experiences, which they can share with other teams yet to undergo the change.
Conversely, successful experiments in one part of the business should be readily proliferated in other areas of the organization. For instance, in a large insurance company, a change champion network recognized the need for frontline staff working virtually to have a platform for immediate queries and responses. The solution was a chat channel implemented under Microsoft Teams, approved by IT. In this channel, frontline staff could freely pose questions about system usage, shortcuts, and outages, and addressing customer concerns.
Initially, the channel had few questions, but as prompt and helpful responses were provided, engagement grew. Today, it stands as one of the most active Teams chat channels in the company, showcasing the effectiveness of cross-network collaboration. This success story has inspired similar initiatives in other businesses, emphasizing the ripple effect of successful collaboration practices within change networks.
5) Nurturing the network
Sustaining a change champion network is an ongoing endeavor that demands continuous nurturing, engagement, support, and leadership. Similar to any community, these networks thrive when provided with the right conditions and resources. Several key activities contribute to the nurturing of a dynamic and effective change champion network:
Onboarding and Expectation Setting: New members need comprehensive onboarding sessions where they receive information about the network’s objectives, core principles, expected time commitments, and other essential details.
Change Capability Sessions: Continuous learning is crucial for change champions. Sessions covering various topics, such as impact assessment, change communication, feedback provision during testing, and engagement with impacted stakeholder groups, help enhance their skills.
Leader Support: The involvement of senior leaders in certain sessions can provide valuable support and visibility to the network’s efforts, emphasizing the importance of their work in the broader organizational context.
Cross-Business Unit Networking: Structured agendas for cross-business unit change champion networking sessions create opportunities for sharing ideas and best practices, fostering a collaborative environment.
Routine Forums: Establishing routine forums for discussing project-specific topics allows members to stay informed and aligned with ongoing initiatives.
Formal Acknowledgments and Prizes: Recognizing key milestones and achievements through formal acknowledgments and prizes not only celebrates success but also motivates members to actively contribute.
Data Access: Providing change champions with access to change data, including impact assessments, readiness metrics, and change roadmaps, empowers them with valuable insights into upcoming changes and their stakeholder implications.
Regular Membership Reviews: Like any dynamic network, regular reviews of membership are essential. Some members may not meet expectations, and their roles might need to be filled by others. Expecting turnover and proactively managing it ensures a continuous influx of fresh perspectives and contributions.
Change champions, armed with comprehensive data on change impact, play a pivotal role in facilitating a clear understanding of impending changes and their ramifications for stakeholders. Regular reinforcement, support, and occasional challenges contribute to the resilience and effectiveness of the change champion network.
6) Supporting multiple initiatives
In the dynamic landscape of organizational change, it’s common for each business unit to undergo multiple initiatives simultaneously. Change champions play a pivotal role in navigating this complex terrain, supporting various initiatives and connecting the dots to form a coherent narrative for the impacted audience. Here’s why having change champions who can support multiple initiatives is crucial:
Holistic Understanding: Change champions, acting as the linchpin between different initiatives, provide a holistic understanding of the changes unfolding within a business unit. This comprehensive view enables them to craft a cohesive story that resonates with the audience, fostering better comprehension and buy-in.
Connecting the Dots: A key function of change champions is to connect disparate initiatives into a unified narrative. By highlighting interdependencies and common goals, they contribute to a more seamless and integrated change experience for stakeholders.
Predicting Crunch Periods: Change champions need to anticipate and understand the crunch periods for their business unit. By supporting multiple initiatives, they become adept at forecasting when the organization might face heightened challenges and risks that could impact daily operations.
Strategic Risk Management: With insights into multiple initiatives, change champions become strategic risk managers. They can identify potential points of friction, overlaps, or resource constraints and proactively address them, mitigating risks that could hinder the success of the initiatives.
Example of a single view of change from The Change Compass
Example of Change Outcome: The Change Compass
In analogy to mycorrhizal networks that span diverse ecosystems, organizations face the challenge of not only developing robust change champion networks internally but also fostering connections with external networks. Just as mycorrhizal networks link various landscapes, change champion networks can extend their impact beyond organizational boundaries.
Research indicates that when change champion networks from different companies link up, a wealth of learning and collaboration unfolds. This interconnectedness leads to a blossoming of reciprocity, negotiation, and even selflessness. Organizations stand to gain immensely by facilitating the exchange of insights and experiences among diverse change champion networks, creating a thriving ecosystem of change management knowledge and practices.
Elevate your change management strategy! Book a weekly demo with us and explore how our solutions can empower your change champion network.
A 2025 Gartner report found that fewer than 25% of organisations have moved beyond basic reporting when it comes to their change management data. Most change teams still rely on spreadsheets, survey snapshots, and anecdotal updates to communicate progress. Yet the same organisations invest heavily in analytics for marketing, finance, and operations. The gap is striking, and it is costing organisations real money in failed adoption, duplicated effort, and invisible change saturation.
Building a genuine change analytics capability is not about buying a dashboard tool and hoping people use it. It is about developing the people, processes, and data foundations that allow your change function to move from reactive reporting to predictive insight. This guide walks through a practical, stage-by-stage approach to building that capability, drawn from patterns observed across enterprise change teams in financial services, government, and large-scale technology transformations.
Why most change teams stall at the reporting stage
There is a critical difference between reporting and analytics, and most change functions confuse the two. Reporting tells you what happened: how many people attended the training, how many communications were sent, what the survey scores were. Analytics tells you what it means: which teams are at risk of adoption failure, where change saturation is building to dangerous levels, and which initiatives are competing for the same audience at the same time.
The reason most teams stall is structural, not technical. They lack three things simultaneously:
A data model that connects change activities to business outcomes rather than tracking them in isolation
An analytical mindset in the team, where practitioners ask “what does this pattern mean?” rather than “what number do the stakeholders want to see?”
A governance structure that makes data collection systematic rather than project-by-project
Until all three are in place, even sophisticated tools produce shallow outputs. A heat map without a data model behind it is just a coloured spreadsheet. A survey without an analytical framework is just a snapshot that tells you nothing about trajectory.
The four stages of change analytics maturity
Based on work across dozens of enterprise change functions, a clear maturity progression emerges. Understanding where your organisation sits on this continuum is the first step toward building capability intentionally rather than haphazardly.
Stage 1: Ad hoc reporting
At this stage, each project or initiative tracks its own metrics in its own way. There is no consistency in what gets measured, how it is collected, or how it is reported. Change managers produce PowerPoint slides with status updates, traffic-light ratings, and anecdotal commentary. The data is retrospective and rarely influences decisions.
You know you are here if your change reporting could be summarised as “things are on track” or “things are at risk” with little quantitative evidence behind either statement.
Stage 2: Standardised measurement
The team has agreed on a common set of metrics and a consistent approach to collecting them. This might include standardised impact assessments, consistent survey instruments, or a shared taxonomy for categorising change types. Data is still largely backward-looking, but it is now comparable across initiatives.
The hallmark of this stage is the ability to answer: “How does initiative A compare to initiative B in terms of employee impact?” If you cannot answer that question with data, you are still in Stage 1.
Stage 3: Integrated analytics
At this stage, change data is connected to other enterprise data sources. You can overlay change impact data with HR data (attrition, engagement scores, absenteeism), project data (timelines, milestones, budget), and operational data (productivity metrics, error rates, customer satisfaction). This is where the real analytical power begins.
A 2023 McKinsey analysis of organisational performance found that companies integrating people analytics with operational data were 2.5 times more likely to outperform peers on financial metrics. The same principle applies to change analytics: integration is what turns reporting into insight.
Stage 4: Predictive and prescriptive capability
The most mature change functions use their data not just to explain what happened, but to predict what will happen. They can model the likely impact of adding a new initiative to an already saturated portfolio. They can identify which business units are approaching adoption fatigue before it manifests in survey scores. They can quantify the productivity cost of overlapping go-lives and present scenario-based alternatives to the portfolio steering committee.
Reaching Stage 4 typically requires 18 to 24 months of sustained investment in data infrastructure, team capability, and stakeholder education. But even partial progress from Stage 1 to Stage 2 delivers measurable improvements in decision quality.
Building the foundation: your change data model
Before investing in tools or training, you need a data model that defines what you will measure, how entities relate to each other, and what questions the data should answer. A robust change data model typically includes five core entities:
Initiatives: the programmes, projects, and BAU changes flowing through the organisation, with attributes for type, size, timing, and strategic alignment
Impacts: the specific changes each initiative imposes on people, categorised by type (process, technology, role, policy, behaviour), intensity, and timing
Audiences: the teams, business units, roles, and locations affected by each impact, with enough granularity to identify overlap and accumulation
Interventions: the change activities delivered (training, communications, coaching, support), linked to specific impacts and audiences
Outcomes: adoption metrics, readiness scores, business performance indicators, and qualitative feedback that track whether the change is landing
The relationships between these entities are what make the model powerful. When you can trace a line from a strategic initiative through its individual impacts to the specific teams affected, and then through the interventions delivered to the adoption outcomes achieved, you have a data model capable of supporting real analytics.
Most organisations attempt to build this model in spreadsheets, which works at small scale but collapses under the weight of a real enterprise portfolio. A Prosci study on organisational change capability identified that teams using purpose-built change management platforms were significantly more likely to sustain their analytics capability over time compared to those relying on generic tools.
Developing analytical skills in your change team
A data model without people who can interpret it is useless. And here is the uncomfortable truth: most change practitioners were not trained in data analysis. Their backgrounds are in communications, psychology, HR, or project management. Asking them to suddenly think in terms of correlation, trend analysis, and statistical significance is unrealistic without deliberate investment.
The good news is that you do not need data scientists. You need practitioners who develop what might be called “analytical fluency”: the ability to look at change data and ask the right questions, spot meaningful patterns, and translate findings into stakeholder language.
Practical steps to build this fluency include:
Data storytelling workshops: Teach the team to construct narratives from data rather than presenting raw numbers. A chart showing change saturation by business unit is data. A narrative explaining why the operations team is at risk of adoption failure because three major initiatives overlap in Q3, and what to do about it, is insight.
Paired analysis sessions: Pair a change practitioner with someone from the data or business intelligence team for regular analysis sessions. The change practitioner brings domain knowledge; the analyst brings technical skill. Over time, both learn from each other.
Hypothesis-driven reviews: Replace status update meetings with hypothesis-driven discussions. Instead of “here is what happened this month,” start with “we hypothesised that the new process rollout would see higher adoption in teams with dedicated change champions. Here is what the data shows.”
Benchmark libraries: Build an internal library of benchmarks from past initiatives. How long does adoption typically take for a technology change versus a process change? What survey scores at the three-month mark predict successful adoption at twelve months? These benchmarks become the foundation for predictive capability.
A 2024 HR Grapevine analysis on people analytics maturity found that the biggest barrier to analytics adoption was not technology but the gap between available data and the ability of HR and change professionals to use it meaningfully. Investing in skill development pays off faster than investing in tools.
Embedding change analytics into governance and decision-making
The final, and often most difficult, step is making sure that change analytics actually influences decisions. Too many organisations build the capability, produce the reports, and then watch as steering committees ignore the data and make politically driven decisions anyway.
Embedding analytics into governance requires three structural changes:
First, change data must be a standing agenda item in portfolio governance meetings. Not an optional appendix, not an “if we have time” discussion, but a required input to every major decision about initiative timing, sequencing, and resourcing. When the portfolio steering committee debates whether to bring forward a new initiative, the change analytics view of current saturation, team capacity, and cumulative impact should be presented alongside the financial business case.
Second, define trigger thresholds that mandate action. Establish clear thresholds: if change saturation in a business unit exceeds a defined level, new initiatives targeting that unit require additional justification and mitigation plans. If adoption metrics fall below a target at a defined milestone, the initiative enters a remediation process. These triggers take analytics out of the advisory space and into the operational space.
Third, report outcomes, not just activities. Senior leaders quickly tune out reports about how many training sessions were delivered or how many communications were sent. They engage when you show them the relationship between change interventions and business outcomes: the correlation between structured change support and faster time-to-competency, or the measurable productivity impact of overlapping go-lives on frontline teams.
According to Gartner’s 2026 change management trends report, organisations that embed data-driven decision-making into their change governance frameworks see 40% higher success rates in complex transformation programmes compared to those relying on qualitative assessment alone.
How digital change tools accelerate analytics capability
Building a change analytics capability does not require starting from scratch. Purpose-built digital change management platforms like The Change Compass provide the data model, collection mechanisms, and visualisation layers that would take months to build manually. They standardise how impacts are assessed, connect initiatives to affected audiences, and generate portfolio-level views that make saturation and overlap immediately visible. For teams moving from Stage 1 to Stage 2, a dedicated platform can compress the journey from years to months by removing the infrastructure burden and letting the team focus on developing their analytical skills.
Where to start this week
If you are reading this and recognising your organisation in Stage 1, here is a practical starting point. Do not try to build everything at once. Pick one initiative currently in flight and apply a structured approach: map its impacts by audience, measure adoption using consistent criteria, and present the findings as a narrative to your steering committee. Use that single case to demonstrate the difference between reporting and analytics. Once stakeholders see what is possible, the conversation about investing in broader capability becomes much easier.
The organisations that build genuine change analytics capability do not do it by accident. They invest deliberately in data models, in their people’s analytical skills, and in governance structures that make data a required input to decisions. The payoff is a change function that can see around corners, anticipate problems before they escalate, and demonstrate its value in the language that senior leaders actually care about: business outcomes.
Frequently asked questions
What is change analytics capability?
Change analytics capability is an organisation’s ability to systematically collect, analyse, and act on data related to change initiatives. It goes beyond basic reporting to include trend analysis, predictive modelling, and data-driven decision-making about how change is planned, sequenced, and delivered across the enterprise.
How long does it take to build change analytics capability?
Moving from ad hoc reporting to standardised measurement typically takes three to six months with focused effort. Reaching integrated analytics, where change data connects to HR and operational data, usually requires 12 to 18 months. Full predictive capability can take two years or more, depending on data infrastructure and team skill levels.
Do I need a data scientist on my change team?
Not necessarily. What you need is analytical fluency: the ability to interpret data patterns, construct hypotheses, and translate findings into actionable recommendations. Pairing change practitioners with existing business intelligence or data teams is often more effective than hiring dedicated data scientists into the change function.
What tools do I need for change analytics?
The most important tool is a consistent data model, not software. That said, purpose-built change management platforms significantly reduce the effort required to collect, structure, and visualise change data. Generic tools like spreadsheets work at small scale but become unmanageable for enterprise portfolios with dozens of concurrent initiatives.
How do I convince senior leaders to invest in change analytics?
Start with a single compelling example. Take one initiative where you can show the relationship between change data and a business outcome, such as how structured adoption support reduced time-to-competency by a measurable amount, or how overlapping go-lives correlated with a spike in customer complaints. One concrete case study is more persuasive than any slide deck about the theoretical value of analytics.