Organisational change management professionals are increasingly requested to provide measurement, data, and insights to various stakeholder groups. Not only does this include tracking various change management outcomes such as business readiness or adoption, but stakeholder concerns also include such as change saturation and visibility of incoming initiative impacts.
To become better at working with data there is much that change managers can learn best practices from data scientists (without becoming one of course). Let’s explore how change management can benefit from the practices and methodologies employed by data scientists, focusing on time allocation, digital tools, system building, hypothesis-led approaches, and the growing need for data and analytical capabilities.
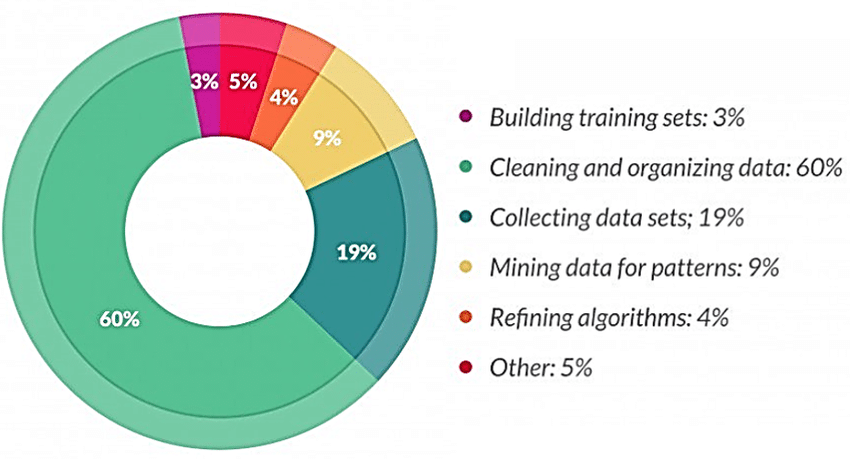
Data scientists spend a substantial portion of their time on data collection and cleansing from data sources. According to industry estimates, about 60-80% of a data scientist’s time is dedicated to these tasks. This meticulous process ensures that the data used for analysis is accurate, complete, and reliable.
In the below diagram from researchgate.net you can see that for data scientists the vast majority of the time is spent on collecting, cleansing and organising data.
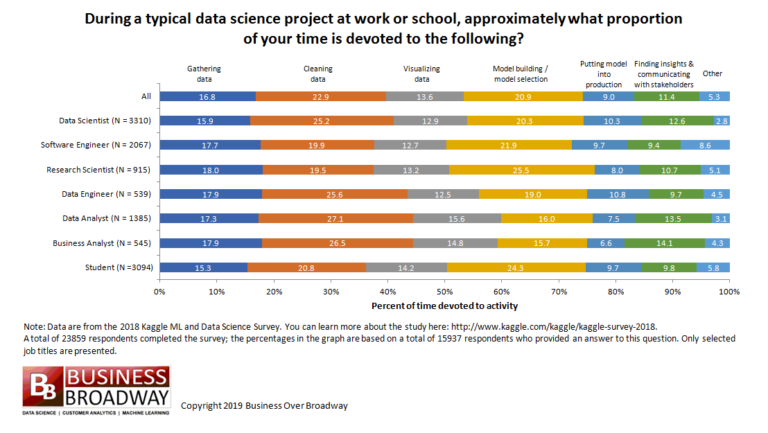
You might say that change managers are not data scientists because the work nature is different, and therefore should not need to carve out time for these activities? Well, it turns out that the type of activities and proportions of time spent is similar across a range of data professionals, including business analysts.
Below is the survey results published by Business Broadway, showing that even business analysts and data analysts spend significant time in data collection, cleansing, and preparation.
Lessons for Change Management
a. Emphasize Data Collection and Cleansing: For change managers, this translates to prioritizing the collection of reliable data related to change initiatives as a part of a structured approach. This might include stakeholder feedback, performance metrics, impact data and other relevant data points. Clean data is essential for accurate analysis and insightful decision-making. Data projects undertaken by change managers are not going to be as large or as complex as data scientists, however the key takeaway is that this part of the work is critical and sufficient time should be allocated and not skipped.
What is data change management and why is it important?
Data change management involves overseeing and controlling changes in data systems to ensure accuracy and consistency. It’s crucial for minimizing errors, maintaining data integrity, and enhancing decision-making processes. Effective management safeguards against potential risks associated with data alterations, ensuring organizations can adapt to shifts in information seamlessly.
b. Allocate Time Wisely: Just as data scientists allocate significant time to data preparation, change managers should also dedicate sufficient time to gathering and cleaning data before diving into analysis. This ensures that the insights derived are based on accurate and reliable information.
It also depends on the data topic and your audience. If you are presenting comparative data, for example, change volume across different business units. You may be able to do spot checks on the data and not verify every data line. However, if you are presenting to operations business units like call centres where they are very sensitive to time and capacity challenges, you may need to go quite granular in terms of exactly what the time impost is across initiatives.
c. Training and Awareness: Ensuring that the change management team understands the importance of data quality and is trained in basic data cleansing techniques can go a long way in improving the overall effectiveness of change initiatives in the desired future state. Think of scheduling regular data sessions/workshops to review and present data observations and findings to enhance the team’s ability to capture accurate data as well as the ability to interpret and apply insights. The more capable the team is in understanding data, the more value they can add to their stakeholders leveraging data insights.
2. Leveraging Digital Tools: Enhancing Efficiency and Accuracy
Data scientists rely on a variety of digital tools to streamline their work. These tools assist in data collection, auditing, visualization, and insight generation. AI and machine learning technologies are increasingly being used to automate and enhance these processes.
Data scientists rely on various programming, machine learning and data visualisation such as SQL, Python, Jupyter, R as well as various charting tools.
a. Adopt Digital Tools: Change managers should leverage digital tools to support each phase of their data work. There are plenty of digital tools out there for various tasks such as surveys, data analysis and reporting tools.
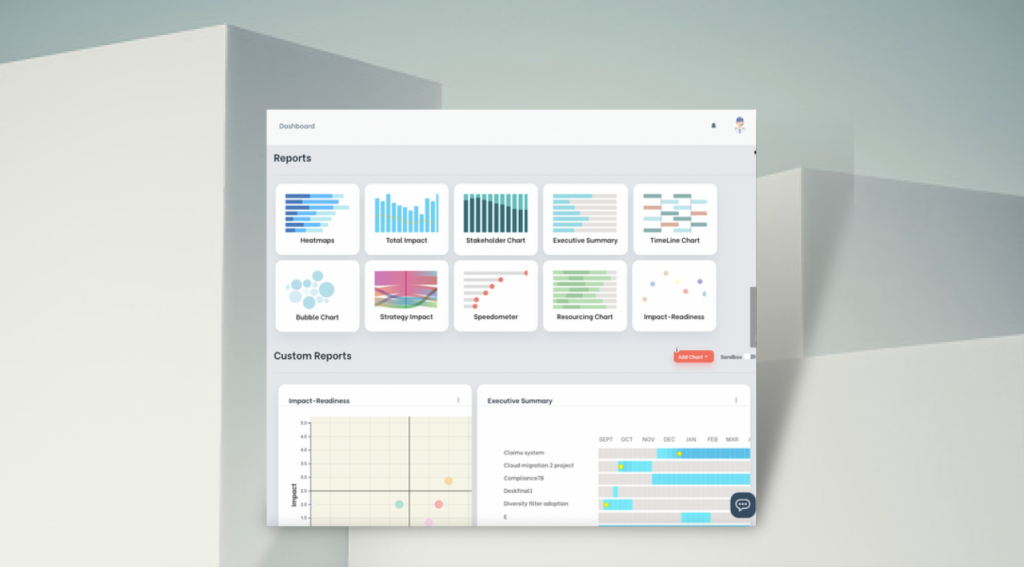
For example, Change Compass has built-in data analysis, data interpretation, data audit, AI and other tools to help streamline and reduce manual efforts across various data work steps. However, once again even with automation and AI the work of data checking and cleansing does not go away. It becomes even more important.
b. Utilize AI and Machine Learning: AI can play a crucial role in automating repetitive tasks, identifying patterns, data outliers, and generating insights. For example, AI-driven analytics tools can help predict potential change saturation, level of employee adoption or identify areas needing additional support during various phases of change initiatives.
With Change Compass for example, AI may be leverage to summarise data, call out key risks, generate data, and forecast future trends.
c. Continuous Learning: Continuous learning is essential for ensuring that change management teams stay adept at handling data and generating valuable insights. With greater stakeholder expectations and demands, regular training sessions on the latest data management practices and techniques can be helpful. These sessions can cover a wide range of topics, including data collection methodologies, data cleansing techniques, data visualisation techniques and the use of AI and machine learning for predictive analytics. By fostering a culture of continuous learning, organizations can ensure that their change management teams remain proficient in leveraging data for driving effective change.
In addition to formal training, creating opportunities for hands-on experience with real-world data can significantly enhance the learning process. For instance, change teams can work on pilot projects where they apply new data analysis techniques to solve specific challenges within the organization. Regular knowledge-sharing sessions, where team members present case studies and share insights from their experiences, can also promote collective learning and continuous improvement.
Furthermore, fostering collaboration between change managers and data scientists or data analysts can provide invaluable mentorship and cross-functional learning opportunities. By investing in continuous learning and development, organizations can build a change management function that is not only skilled in data management but also adept at generating actionable insights that drive successful change initiatives.
3. Building the Right System: Ensuring Sustainable Insight Generation
It is not just about individuals or teams working on data. A robust system is vital for ongoing insight generation. This involves creating processes for data collection, auditing, cleansing, and establishing data governance and governance bodies to manage and report on data.
Governance structures play a vital role in managing and reporting data. Establishing governance bodies ensures that there is accountability and oversight in data management practices. These bodies can develop and enforce data policies, and oversee data quality initiatives. They can also be responsible for supporting the management of a central data repository where all relevant data is stored and managed.
a. Establish Clear Processes: Develop and document processes for collecting and managing data related to change initiatives and document any new processes. This ensures consistency and reliability in data handling. There should also be effective communication of these processes using designated communication channels to ensure smooth transition and adherence.
b. Implement Governance Structures: Set up governance bodies to oversee data governance practices as a part of data governance efforts. This includes ensuring compliance with data privacy regulations and maintaining data integrity. The governance can sponsor the investment and usage of the change data platform. This repository should be accessible to stakeholders involved in the change management process, promoting transparency and collaboration. Note that a governance group can simply be a leadership team regular team meeting and does not need to be necessarily creating a special committee. Data governance group members (potentially representative business owners) foster a sense of ownership and can be empowered to resolve potential issues with data and usage. Key performance indicators and key change indicators may be setup as goals.
c. Invest in system Infrastructure: Build the necessary system infrastructure to support data management and analysis that is easy to use and provides the features to support insight generation and application for the change team.
Data scientists and data teams often use a hypothesis-led approach, where they test, reject, or confirm hypotheses using data. This method goes beyond simply reporting what the data shows to understanding the underlying causes and implications.
a. Define Hypotheses: Before analyzing data, clearly define the hypotheses you want to test. For instance, if there is a hypothesis that there is a risk of too much change in Department A, specify the data needed to test this hypothesis.
b. Use Data to Confirm or Reject Hypotheses: Collect and analyze data to confirm or reject your hypotheses. This approach helps in making informed decisions rather than relying on assumptions or certain stakeholder opinions.
c. Focus on Actionable Insights: Hypothesis-led analysis often leads to more actionable insights. It is also easier to use this approach to dispel any myths of false perceptions.
For example: Resolving Lack of Adoption
Hypothesis: The lack of adoption of a new software tool in the organization is due to insufficient coaching and support for employees.
Data Collection:
Gather data on the presence of managerial coaching and perceived quality. Also gather data on post go live user support.
Collect feedback from employees through surveys regarding the adequacy and clarity of coaching and support.
Analyse usage data of the new software to identify adoption rates across different departments.
Analysis:
Compare adoption rates between employees who received sufficient coaching and support versus those who did not.
Correlate feedback scores on training effectiveness with usage data to see if those who found the training useful are more likely to adopt the tool.
Segment data by department to identify if certain teams have lower adoption rates and investigate their specific training experiences.
Actionable Insights:
If data shows a positive correlation between coaching and support, and software adoption, this supports the hypothesis that enhancing coaching and support programs can improve adoption rates.
If certain departments show lower adoption despite completing coaching sessions, investigate further into department-specific issues such as workload or differing processes that may affect adoption.
Implement targeted interventions such as additional training sessions, one-on-one support, or improved training materials for departments with low adoption rates.
5. Building Data and Analytical Capabilities: A Core Need for Change Management
As data and analytical capabilities become increasingly crucial, change management functions must build the necessary people and process capabilities to leverage data-based insights effectively.
a. Invest in Training: Equip change management teams with the skills needed to manage data and generate insights. This includes training in data analysis, visualization, and interpretation.
b. Foster a Data-Driven Culture: A lot of organisations are already on the bandwagon to encourage a culture where data is valued and used for decision-making from current state to future state. The change process needs to promote this equally within the change management function. This involves promoting the use of data in everyday tasks and ensuring that all team members understand its importance. Think of incorporating data-led discussions into routine meeting meetings.
c. Develop Analytical Frameworks: Create frameworks and methodologies for analyzing change management data. This includes defining common key metrics, setting benchmarks, and establishing protocols for data collection and analysis for change data. Data and visual templates may be easier to follow for those with lower capabilities in data analytics.
Practical Steps to Implement Data-Driven Change Management
To integrate these lessons effectively, senior change practitioners can follow these practical steps:
Develop a Data Strategy: Create a comprehensive data strategy that outlines the processes, tools, and governance structures needed to manage change management data effectively.
Conduct a Data Audit: Begin by auditing the existing data related to change management. Identify gaps and areas for improvement.
Adopt a Hypothesis-Led Approach: Encourage the use of hypothesis-led approaches to move beyond descriptive analytics and derive more meaningful insights.
Invest in Technology: Invest in the necessary digital tools and technologies to support data collection, cleansing, visualization, and analysis.
Train the Team: Provide training and development opportunities for the change management team to build their data and analytical capabilities.
Collaborate Across Functions: Foster collaboration between change management and data science teams to leverage their expertise and insights.
Implement Governance Structures: Establish governance bodies to oversee data management practices and ensure compliance with regulations and standards.
By learning from the practices and methodologies of data scientists, change management functions can significantly enhance their effectiveness. Prioritizing data collection and cleansing, leveraging digital tools, building robust systems, adopting hypothesis-led approaches, and developing data and analytical capabilities are key strategies that change management teams can implement. By doing so, they can ensure that their change initiatives are data-driven, insightful, and impactful, ultimately leading to better business outcomes.
Managing multiple change initiatives is not a new concept nor is it new to organizations. What is perhaps ‘newer’ is how change practitioners are using data to manage multiple changes. Change practitioners that manage a portfolio of initiatives used to focus on building capability in various arenas from employee capability, leadership capability, through to the effectiveness of engagement and learning channels. However, using business and change management data to help companies is just as critical.
Is change management becoming more important?
Yes, change management is increasingly vital in today’s fast-paced business environment. Organizations face constant shifts in technology, market demands, and workforce dynamics, which impact their business processes. Effectively managing these changes helps minimize resistance, enhances employee engagement, and ensures smoother transitions, ultimately leading to improved performance and sustainability in a competitive landscape.
In this article, we will explore the top five challenges associated with the current approaches to managing multiple change initiatives, including the implementation of the change due to lack of resources and insufficient resources. We explore these common approaches and critique key challenges, along with alternatives.
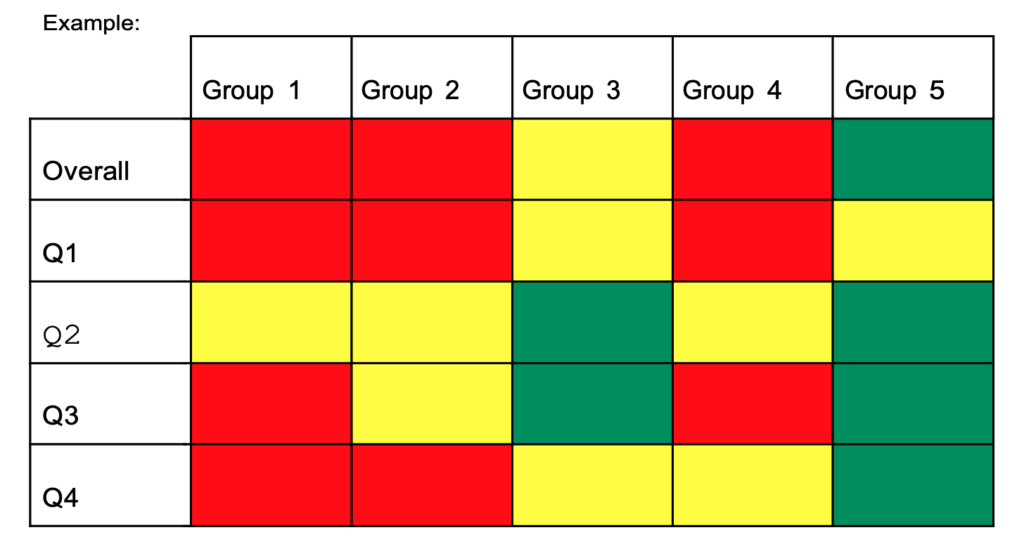
Change heatmaps have become a popular tool for classifying departments based on the impact of a change initiative. However, two key issues often arise with this approach: the oversimplification of the traffic light classification system and the lack of granularity at the department level.
One of the most common ways to visually depict the impact of multiple changes is to use the heatmap. This is normally using a 3-point rating system (high, medium, low) to determine the level of impact across the various departments across the organisation. Whilst the rating process is an easy exercise, there are some very serious challenges:
Even for the 3 level rating system the change practitioner may be challenged with how this rating is determined and what it is based on. Not every team within the same department may be equally impacted
There may be different impacts for different roles within the same team and department
The impact may be different depending on whether the focus is on employees, customers, process, system or partner
Typically most use a monthly rating scale. However, for busy organisations with lots of changes, the change volume may go up and down within the same month. With one rating it oversimplifies what actually happens throughout the month
With only 3 levels of ratings, a lot of departments end up having the same rating level for months, meaning there is not much they can do with this data.
In Summary, the summarised monthly rating for one department indicates medium-level change. But at what time of the month, for what role, for what team, and for what type of impact?
The below is an example of a change heatmap from the University of California, Berkeley.
a. Traffic Light Classification Too Simplistic:
The traditional red, yellow, and green traffic light system used in change heatmaps is a simple way to communicate the status of a department’s readiness for change. However, this simplicity can be misleading. Red may indicate a problem, but it does not provide insights into the nature or severity of the issue. Likewise, green may suggest readiness, but it might hide underlying complexities or dependencies.
Even for the 3 level rating system the change practitioner may be challenged with how this rating is determined and what fact it is based on. Also, the impact may be different depending on whether the focus is on employees, customers, process, system or partner. Typically most use a monthly rating scale. However, for busy organisations with lots of changes, the change volume may go up and down within the same month. With one rating it oversimplifies what actually happens throughout the month. Even if the singular departmental rating is split into rating by initiative, this does not provide an aggregate department-level rating that is aggregated based on logic.
To overcome this challenge, organizations need a more nuanced classification system that takes into account the specific issues within each category. This could involve incorporating additional colours or using a numerical scale to better represent the diversity and complexity of challenges within each department.
b. Department Level Not Granular Enough:
While change heatmaps provide a high-level overview, they often lack the granularity required to understand the specific challenges within each department. Different teams within a department may be impacted differently, and a broad classification may not capture these variations.
To address this issue, organizations should consider adopting a more detailed classification system that breaks down each department into its constituent parts. This granular approach allows for a more targeted and effective change management strategy, addressing specific issues at the team and role levels.
In Summary, the singular monthly rating for one department indicates medium-level change. But at what time of the month, for what role, for what team, and for what type of impact?
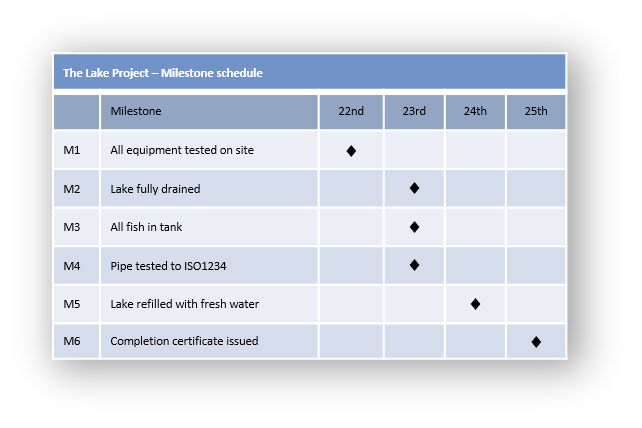
2) Using Project Milestone Roadmap to Sequence Impacts
Project milestone roadmaps are commonly used to sequence the impacts of change initiatives. However, this approach faces challenges in terms of the sufficiency of milestones and the difficulty of overlaying multiple capacity considerations.
Below is an example from Praxis Framework.
a. Milestones Are Not Sufficient vs Overall Aggregate Impact Levels:
While project milestones provide a structured timeline for change initiatives, they may not capture the full scope of the impact on the organization. Engaging key stakeholders is essential during this process, as milestones often focus on project-specific tasks and may overlook broader organizational changes that occur concurrently. For example, adoption may require months and is not a single point-in-time milestone per se.
To overcome this limitation, organizations should supplement milestone roadmaps with an overall aggregate impact assessment. This holistic view ensures that the sequence of milestones aligns with the broader organizational objectives and minimizes conflicts between concurrent initiatives.
b. Difficulty of Overlaying Multiple Capacity Considerations:
Managing multiple change initiatives requires a delicate balance of resources, and overlaying capacity considerations can be challenging due to the scope of the change. Project milestone roadmaps may not adequately address the interdependencies and additional resources needed due to the resource constraints that arise when multiple initiatives are in progress simultaneously.
To enhance capacity planning, organizations should invest in advanced project management tools that allow for the dynamic adjustment of timelines based on resource availability. This ensures a realistic and achievable sequencing of impacts, taking into account the organization’s overall capacity.
3) Relying Purely on Excel and PowerPoint to Manage Multiple Change Initiatives
While Excel and PowerPoint are ubiquitous tools in the business world, relying solely on them to manage multiple change initiatives presents challenges related to the agile nature of changes and the difficulty of having interactive data-based conversations. This is especially the case that most change initiatives are digital changes, and yet they are been managed using non-digital means? How can change practitioners ‘be the change’ when they are using dated ways of driving digital change?
a. Agile Nature of Changes Means Ongoing Updates Are Required:
Change initiatives are inherently dynamic, and their requirements can evolve rapidly, especially in response to market shifts. Excel and PowerPoint, while useful for static reporting, lack the real-time collaborative capabilities needed to accommodate the agile nature of changes while maintaining the status quo.
To address this challenge, organizations should consider adopting change management and collaboration tools that enable real-time updates and collaboration. Cloud-based platforms provide the flexibility to make ongoing adjustments, ensuring that stakeholders are always working with the latest information.
b. Difficulty of Having Interactive Data-Based Conversations and Federated Model of Change Data:
Excel and PowerPoint may struggle to facilitate interactive discussions around change data. As organizations increasingly operate in a federated model, with dispersed teams working on different aspects of change initiatives, a more collaborative and integrated approach is essential.
Implementing dedicated change management platforms that support interactive data-based discussions can enhance collaboration and provide a centralized repository for change-related information. This ensures that all stakeholders have access to the latest data, fostering a more transparent and collaborative change management process.
4) Preparing Business Operations Readiness for the Amount of Change
Preparing business operations for a significant amount of change requires a strategic approach that incorporates capacity and time considerations while maintaining granularity in data.
a. Using Business Operations Speak: Capacity, resources, time.
Business operations readiness is often discussed in terms of capacity and time. However, the challenge lies in translating these concepts into actionable plans. Capacity planning involves understanding the organization’s ability to absorb change without compromising existing operations, while time considerations are crucial for ensuring a smooth transition without disruptions.
Change practitioners need to distill the ‘ask of the business’ in business speak. Business stakeholders may not be interested in the various classifications of change or the varying degrees of cultural changes involved. What they are interested in is what you want from my team, how much time you need them to dedicate, and for what team members, so that they can plan accordingly.
b. Granularity of Data:
The granularity of data is essential for effective business operations readiness. Generic metrics may not capture the specific needs and challenges of individual departments or teams, leading to oversights that can impact the success of change initiatives.
Implementing a comprehensive data collection and analysis strategy that considers the unique requirements of each business unit ensures a more accurate understanding of operational readiness. This granularity allows organizations to tailor change management strategies to specific needs, enhancing the likelihood of successful implementation.
5) Getting Executive Engagement and Decision Making
Ensuring executive engagement and decision-making is critical for the success of change initiatives. However, achieving this engagement poses its own set of challenges.
To overcome this challenge, organizations should:
Establish Clear Governance and Engagement Channels:
Ensure that there is in place a clear governance bodies making decisions on the overall control of successful change initiatives across the organisation, focusing on the success of the change. A robust communication strategy ensures that communication channels between change management teams and executives are also well-defined and effective. Regular updates and transparent reporting on the progress and challenges of change initiatives build trust and encourage executive engagement.
Align Change Initiatives with Strategic Objectives:
Demonstrate the alignment of change initiatives with key performance indicators related to the organization’s strategic goals and objectives. Executives are more likely to engage when they see how a particular change contributes to the overall success of the organization and its growth.
Provide Decision-Making Frameworks:
Equip executives with decision-making frameworks that guide them through the complexities of change initiatives. Clearly defined criteria for evaluating the success of a change, along with potential risks and mitigation strategies, empower executives to make informed decisions.
Highlight the Business Impact:
Clearly articulate the business impact of change initiatives. Executives are more likely to engage when they understand the tangible benefits and potential risks associated with a particular change. Use data and analytics to support the business case for change.
Offer Ongoing Support and Education:
Ensure that executives have the necessary support and training to navigate the complexities of change management at all levels of the organization. This includes providing relevant information, resources, and sufficient time to help them make informed decisions and actively participate in the change process, especially regarding new processes. Creating ‘bite-sized’ and summarised insights is key for executives.
Effectively managing multiple change initiatives is a complex task that requires a holistic and adaptive approach. By addressing the challenges of change management, including change management obstacles associated with classification, sequencing, tool reliance, business operations readiness, and executive engagement, organizations can enhance their change management strategies and increase the likelihood of successful outcomes, ultimately maintaining a competitive edge. Embracing innovative tools, fostering collaboration, and maintaining a strategic focus on organizational goals are key elements in overcoming these challenges and navigating the ever-evolving landscape of change.
In this article, we’ve stressed the importance of data. You may wonder about the amount of time and effort required to establish all the various points mentioned in the article and if this is even doable. Well, using Excel and other static non-digital ways of managing change data will mean a significant volume of work, and even then it may not provide a clear picture that gives you the various cuts of data required to drive meaningful conversations. Resort to automation provided by change management software such as The Change Compass to assist in data capture, data analysis, and dashboard generation.
Enterprise change management reporting is changing. In today’s dynamic business environment, it no longer consists of general updates on organisational change management efforts, change leaders, streams of project progress, or updates on various change capability training session volumes and satisfaction rates. Executives are demanding more value from enterprise change functions that incorporate change management practices and digital transformation, leveraging new tools. The pace of change since Covid has not slowed down. For many, it has increased in pace and volume. To gain better insight into how the change management function is supporting the success of organisations, reports and dashboards have often become a visible linchpin of what value enterprise change management delivers.
What is enterprise change management and why is it important?
Enterprise change management refers to the structured approach organizations use to manage the people side of change in organizational change management, including the types of organizational change in processes, systems, and personnel across an entire organization, while integrating risk management principles. It’s crucial for minimizing disruption, ensuring smooth transitions, and enhancing employee engagement. Effective change management fosters resilience, boosts productivity, and aligns teams with organizational goals for sustained success.
What is enterprise change management and why is it important?
Enterprise change management refers to the structured approach organizations use to manage changes in processes, technologies, and organizational structures, including various type of change efforts that relate to the levels of change management. It’s crucial for minimizing resistance and ensuring smooth transitions. Effective change management enhances employee engagement, drives project success, and fosters a culture of adaptability within the organization.
Having the right content and format for your enterprise reports can make or break your reputation in the realm of information technology. Do it right and you could start a ripple of high-impact and strategic conversations across senior stakeholders that drive focus on improving change. You can be in the spotlight in influencing change leadership and the achievement of change and transformation goals. Do it wrong and you may never have another opportunity to have the room to talk about change management to senior leaders. You may be associated with not providing much value and too ‘operational’.
At its core, enterprise change management reporting goes beyond merely tracking progress. It encompasses a holistic approach that considers various factors crucial to the success of organizational initiatives. While monitoring progress, readiness, and the amount of work done may be interesting components, true impact comes from focusing on impacts, adoption and predictors for benefit realization.
Executives and stakeholders are not just interested in receiving progress updates; they seek insights into the likelihood of initiative success and the potential risks that may impede desired outcomes. These risks extend beyond project timelines and budget constraints to encompass broader business implications such as performance impacts, capacity constraints, prioritization effectiveness, and the sustainability of behavioural change.
Impacts of change:
Quantifying and visualising impacts are not new to change practitioners. The key is how the data is presented over time. A lot of change practitioners would settle with a standard heatmap based on personal ratings. This does not deliver much value as the data cannot be easily substantiated by evidence (since it is more of a finger in the air estimation). Standard heatmaps also are too high level and does not really support key decision making.
Decision making requires specific data points such as:
Change saturation or change tolerance levels (these levels need to be substantiated based on business indicator reference to justify the levels, and not be someone’s personal opinion)
What division, team, role and which week the saturation points are forecasted
Corresponding data on what initiatives, and their respective impact activities that contribute to the saturation risk, and therefore proposed options
A key part of representing change impacts should not just be at an operational level, which is more concerned about capacity and bandwidth. Impact should also be tied to strategic levers, portfolio types, benefit types and readiness.
Predictive Indicators for Success:
To create impactful change management reports, organizations must incorporate predictive indicators that go beyond change volume and risk assessment. These indicators should provide insights into business performance, strategy achievement, and the realization of intended benefits.
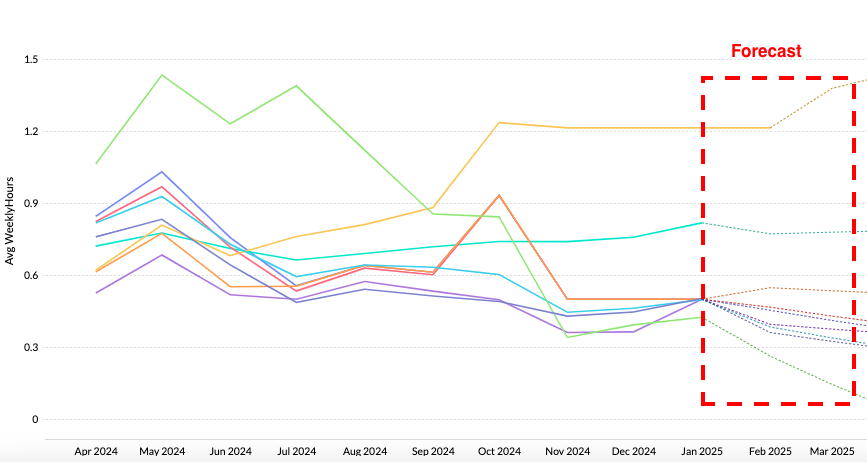
These are some of the ways you can incorporate predictive indicators:
Forecast lines. With sufficient data you can forecast such as impact or capacity levels (which may be seasonal), or even readiness levels across the initiative lifecycle historically across initiatives.
The types of factors that can be included as predictive indicators can include readiness. It could be that readiness levels only get lifted just before go live or at go live. Adoption levels can also be forecasted if you have trend data across initiatives
Change tolerance levels across different parts of the business can also be seen as a predictive way of forecasting how much capacity there is for change beyond which saturation may be a key risk
Adoption and Behaviour Tracking:
Central to successful change management is the adoption and sustained implementation of new processes or technologies. Tracking adoption rates, user engagement, and behavioural changes are crucial indicators of initiative success. However, it’s essential to strike a balance between capturing relevant metrics and overwhelming stakeholders with unnecessary data.
Capturing behaviour change data can be key for larger initiatives or transformations. Behavioural change can be central in a range of changes such as customer centricity, efficiency, team collaboration or effectiveness. Measuring key behaviour changes that drive the initiative outcome the most is critical. For example, having effective conversations with customers to improve customer experience is a behaviour that can be rated, tracked and reported. Depending on the change, there may also be system features that can aid the tracking of these behaviours.
Effective change management goes hand in hand with strategic alignment, strategic goals, and necessary resources for strategic objectives. Reports should assess how initiatives contribute to overarching business objectives and whether they align with the rest of the organization’s strategic direction in the first place. Business leaders can utilize metrics related to revenue growth, cost savings, customer satisfaction, and employee productivity to provide valuable insights into the impact of change initiatives on business performance.
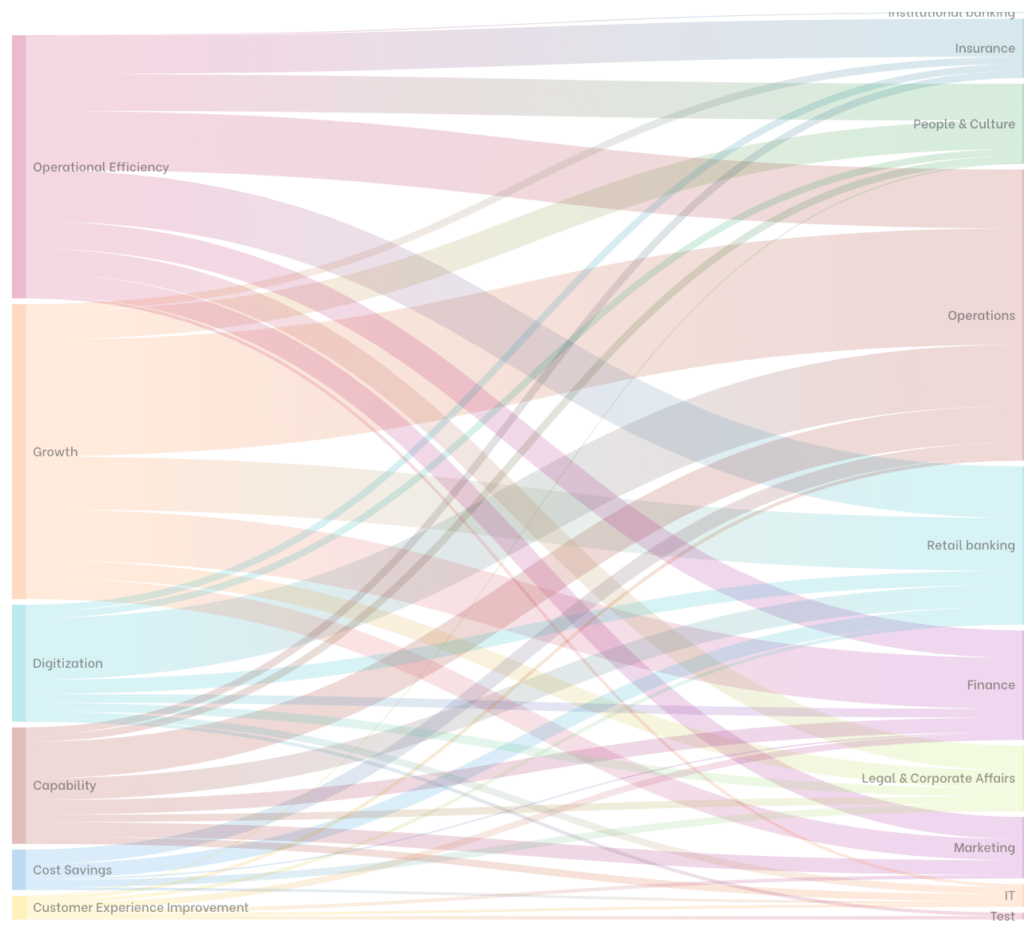
You can also link your change impacts to each strategic lever. In this way you can visually show the size of the impact per strategic lever. This will give your executives a way to examine whether the right level of impacts in the right areas of business are planned as a part of the course of each strategic lever.
The other angle is to visually show the pace of change against the strategic levers. Are certain key initiatives being driven at the right pace at the right time? Will the velocity of change exceed the ability of the business to absorb the changes? Or is the velocity not sufficiently meeting leadership expectations?
Benefit Realization:
Ultimately, the success of change initiatives is measured by their ability to deliver tangible benefits and assess the impact of the change. Change management reports should include key performance indicators (KPIs) and metrics that track the progress of change initiatives and the realization of expected benefits, whether they are financial gains, process efficiencies, or competitive advantages. By monitoring benefit realization, organizations can course-correct as needed and ensure that investments in change deliver the intended outcomes.
A key responsibility for change is to focus on those foreward looking measures that predict eventual benefit realisation, including readiness, adoption, engagement and behaviour change. Be sure to link these specifically to high benefit initiatives to provide strategic oversight.
Balancing Complexity and Clarity:
While incorporating a diverse range of metrics is essential for comprehensive reporting, it’s equally important to maintain clarity and focus. Reports should be structured in a way that highlights key insights and trends without overwhelming stakeholders with excessive detail. Visualizations such as charts, graphs, and dashboards can help distill complex data into actionable insights, facilitating informed decision-making at all levels of the organization.
All aspects of chart and dashboard designs are critical. These range from colour scheme chosen, number of charts, commentary, titles, legends, sequencing of charts, and type of charts chosen all act to either contribute to simplicity and clarity or complexity and confusion. Your narrative as you talk through the charts also plays a key role in building the story-line, and simplifying the key messages and actions you would like to impart to the audience.
Charts and dashboards tell a story and in presenting them you should always incorporate any actions required from the audience. If this is not done then it will always remain a FYI. FYI content will be deemed lower in the value curve over time and your stakeholders will lose interest. Instead, you should work on crafting a continual story that ebbs and flows. The following are key questions you should be asking when crafting you ongoing charts and dashboards:
Is there an emerging risk or opportunity that warrants specific focus for this month?
How are we tracking the effectiveness of stakeholder actions through data? This feedback loop is critical and gives your stakeholders a reference point for their own effectiveness
Is your data-based story uni-dimensional? Are there other dimensions beyond what you have been presenting that stakeholder should be aware of?
Are you giving stakeholders what they are most interested in? Whether it be strategic success progress, or benefit realisation?
Are you presenting change data in a holistic way in terms of how the business is run? Vs. just focused on standard change management function-specific metrics such as training sessions, or number of workshops completed?
Enterprise change management reporting is a critical tool for navigating the complexities of organizational change. By focusing on predictive indicators, including adoption and behavior tracking, business performance alignment, and benefit realization, organizations can unlock the full potential of their change management initiatives. However, achieving impactful reporting requires a careful balance between complexity and clarity, ensuring that stakeholders receive actionable insights without being inundated with unnecessary information. Ultimately, by harnessing the power of enterprise change management reporting, organizations can drive successful outcomes and thrive in an ever-evolving business landscape.
To find out more about enterprise change management reporting leveraging digital automation and analytics chat to us here.
Digitisation, competition and changing industry conditions have amongst other things brought on an accelerated change agenda for a lot of organisations. What were previously thought to be 1 to 5 year horizons of change suddenly became an immediate change. Not only is working from home a norm for a lot of organisations but the struggle for enterprises to survive and stay relevant in the new norm means more changes. The normal equilibrium for a lot of these organisations is one that consumes a smaller number of changes at any one time. Suddenly, with the increased number of changes this leads to change saturation.
In change management, think of change saturation as a cup that fills up. The size of the cup is the change capacity. With limited capacity, there is only so much volume that is inherent. As the amount of change or the pace of change increases and the cup overflows the changes don’t stick and simply fall by the waist side and may result in change fatigue. This is when the negative impact of changes can occur.
What impacts an organisation’s change capacity?
1.Change leadership
Leaders can have significant influence on the organisation. Also, change leadership is a significant part of how change is managed and delivered. Effective change leadership can build on the capability of teams to be more agile and capable of absorbing more changes. Effective change leadership can also help to maximise how optimal the change is socialised and implemented, and therefore how it lands.
2. Change capability
The organisation’s change capability is one of the most important factors in determining their change capacity. Think of agile startup organisations that are constantly pivoting, introducing new operating models, products and services. This is part of their cultural norm. Other organisations that maybe less agile can also develop some of these capabilities through experience and development.
3. Nature of change
Not all types of changes are the same. Typically, a lot of the changes driven by senior leaders are about improving the bottom line or top line, improving customer experience or improving efficiency. Some are more complex changes requiring significant change journeys. Others may even be inherently ‘negatively perceived’ such as organisational restructuring and layoffs. However, there are also changes that are inherently seen as benefiting the work of employees (such as process improvement leading to less red tape).
4. Number of changes
The number of changes also impact the change capacity. Obviously more changes mean more capacity consumed, within an extent.
5. Impact of each change
The impact level of each change is also critical. Some initiatives have significant impact that requires a long period of time to embed the changes, e.g. culture change and complex system and process changes. On the other hand, simple process changes may not require much capacity and simple communication is all that is needed.
6. Overall change landscape
The overall change landscape of the organisation also affects perception and therefore in some ways the capacity for change. If competitors within the industry are all undergoing significant transformations then it sets the tone for what’s to come. In the same way, if all our friends are used to virtual ways of working then we become more open to it.
What’s the benefits of measuring change saturation?
Measuring change saturation can be significantly beneficial for the organisation. Understanding the tipping point means that PMO and change teams can work to avoid this from a planning perspective. Finding out during or after the releases that there is too much change saturation is an expensive exercise that diminishes the planned initiative benefits. It also leads to loss of productivity and operational disruptions. Moreover, employees lose faith in the ability of the organisation to manage change.
With greater clarity of the change saturation points organisations can work to monitor, track and manage the risk of over saturation. Measures can then be put in place to ensure minimal business disruption and protection of initiative benefits. This should be a key focus for risk in change.
How to measure change saturation?
Firstly, there is not one change saturation point for the whole organisation. Each department or even team may have different change saturation points. This is because they have different leaders, different cultural norms and different change capabilities.
So how do we measure the change saturation at a department or division level? Look historically at how changes have been received, starting with the past few months.
1. Monitor operational indicators
Depending on what the department is in charge of, understanding the change saturation point means closely monitoring the operational indicators. During change saturation operational indicators are usually also negatively impacted, depending on the nature of the changes.
For a call centre this could be average handling time, customer satisfaction rate, absenteeism, etc. For a back office department it could be efficiency or effectiveness measures, case completion rate, case quality rating, etc. You don’t need to be the expert in all the various operational measures of each department as you can tap on the operations representatives of these departments.
2. Get feedback from leaders
Interview or conduct surveys with departmental leaders to understand their perception of how changes have been implemented and any potential disruptions on the business. Understand how their teams have experienced change. Ask them whether it has been challenging to balance operational needs with change-induced activities. For example, were there challenges in employees attending initiative training sessions, and completing their role delivery obligations?
3. Be aware of potential biases
Be careful of opinions and feedback from leaders and employees. There may be a tendency to over-state and complain that there is constantly too much change. This happens because some over-state the risk of change saturation hoping that this may lead to less change and therefore easier to manage the operations of a business. Take care to avoid this bias.
4. Identify points of change saturation
If the department has undergone periods with multiple change initiatives that has resulted in negative impact on operational indicators and leaders have also provided feedback of similar change disruptions then measure this level of change. Record this specifically.
This requires a portfolio-level view of all the changes that have occurred and the various impacts of each initiative. With this change portfolio measurement you are able to then identify this level as perhaps just exceeding the change saturation point for that department. With this identified you can then plot this change saturation line. You should also closely monitor this level and adjust as needed.
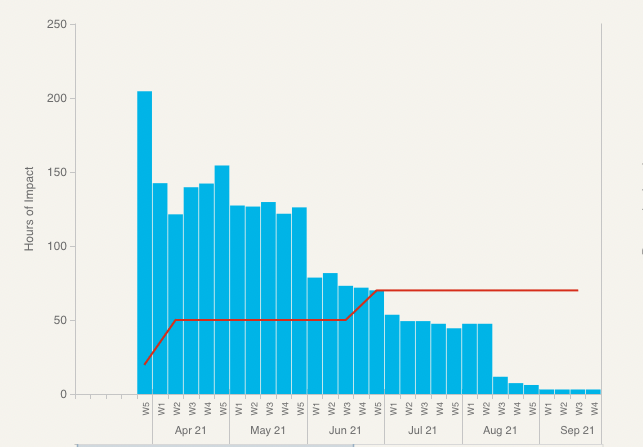
Using The Change Compass change impact can be expressed in terms of hours of impact per week. The change saturation line can the plotted against the change impact levels. From this, you’re able to easily visualise to what extent there could be risk in exceeding the change saturation line.
It is important to note that measuring change impacts and therefore change saturation should ideally be at a weekly level. Measuring change impact at a monthly level may not be sufficiently detailed enough since there could be changes in impact levels within each month. For example, for Finance the quarter-end consolidation cycle could start mid-month and therefore the change impact indication may show up as less than it actually should be simply because the data is rolled-up by month.
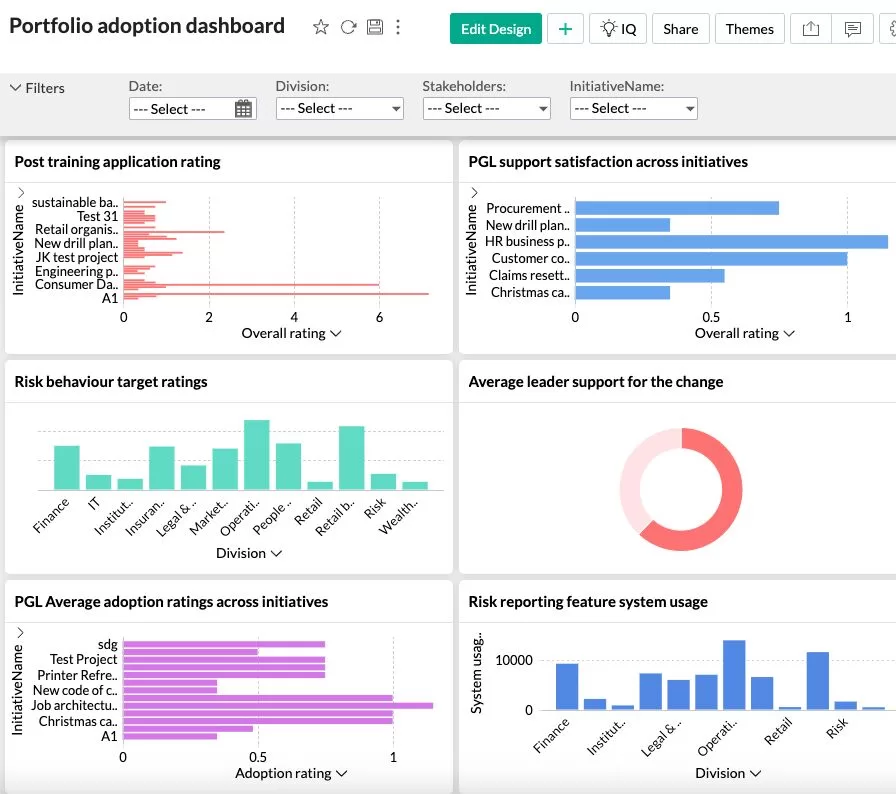
Deriving a monthly dashboard in which to inform not just the change volume, but types of changes, risks, and impacted areas will do wonders to provide clear visibility for the business to get ready for and to track changes.
Other disciplines such as HR, Marketing or Operations rely on data to make critical business decisions. The Change function and change leaders should also follow best practices. Being armed with the right change impact data means that you can help the business to precisely pin-point change saturation points. This can provide tremendous value to the business in terms of business, initiative and risk protection.
If you’re keen to chat more about how you are managing change saturation and to find out more about our solutions feel free to contact us here to organise a chat.
Why Nailing the Right Change Management Metrics is Critical and Can Make or Break Your Reputation
As organizations strive to adapt and thrive in dynamic environments, how the change management process is tracked has become a strategic imperative. However, the success of any change initiative hinges not only on effective planning and execution but also on the ability to measure and communicate its impact accurately. After all, without the right measures how do we know that we are moving in the right direction? In this article, we explore critical change management reports that executives value in shaping organizational understanding and decision-making. We delve into the metrics that may compromise your credibility and, more importantly, highlight the metrics that executives truly value, providing a roadmap to creating reports that resonate with leadership.
Reading your executives and where they are
Prior to designing the right change management reports and metrics it is absolutely essential that you understand where they are coming from. Understanding their key concerns and perspectives will help you design the right content to engage them. Key questions you may want to delve into include:
What issues are top of mind for executives when it comes to managing change?
What has worked or not worked well in the past for change (within what timeline) that should be taken into account?
How experienced are these executives in driving complex change?
Putting your strategic hat on, what are the key business performance challenges that executives are facing into? What are the people and change connections to these?
What are the top key organisational risks that executives are focused on? What are the people and change connections to these?
Vanity Metrics – Metrics That Don’t Connect to Business Outcomes
One of the pitfalls in change management reporting is the reliance on vanity metrics—superficial measures that may look impressive but lack a direct connection to tangible business outcomes. Metrics such as the number of training hours delivered, numbers of stakeholder groups who received communications or the volume of communication materials distributed might seem impressive and easy to measure, but they provide little insight into the real impact of the change on the organization.
Executives are not interested in surface-level data; they want to understand how the change contributes to the achievement of strategic objectives and positively influences key performance indicators. To enhance credibility, change management reports must move beyond vanity metrics and focus on indicators that align with broader business goals.
Activity Metrics – Counting Without Context
Measuring the sheer volume of activities related to a change initiative can be misleading, or worse, meaningless, if not accompanied by context and relevance. Activity metrics, such as the number of workshops conducted, numbers of impact assessment activities conducted, number of deliverables worked on, or emails sent, might create an illusion of progress. However, these metrics fail to provide insights into the quality of engagement, the depth of understanding among employees, or the actual impact on work behaviours. Operational managers may find these interesting, but less likely for executives.
Instead of focusing solely on activities, change management reports should emphasize the effectiveness of these activities in driving desired outcomes. Metrics should, instead, highlight the quality of engagement, the level of understanding, and the behavioural shifts observed within the organization.
Cost-Focused Metrics – Counting Dollars Without Value
While cost-related metrics are important for financial stewardship, solely focusing on cost without considering the value generated by the change can undermine the perceived success of the initiative. Metrics such as the budget spent or the cost per participant may provide financial insights but do not necessarily convey the broader impact on organizational performance.
Change management reports should focus more on value metrics than cost metrics. Focusing purely on cost is restricting the value of managing change as another cost to the business. However, focusing on the value created in maximising business performance and achieving greater adoption can significant extend the understanding of change management value. Executives are interested in understanding what business value is created through managing change. Value includes how the targeted benefits are better realised and how the business performance is protected or maximised during the implementation of change.
Intra-Practice Metrics – Metrics That Only Change Management Cares About
It’s a common misstep to develop metrics that only resonate within the change management function and key project milestones but fail to capture the attention of other business units or executives. Metrics that focus exclusively on communication buzz generated, training satisfaction rates, or employee satisfaction with change processes might be valuable for internal assessments but lack the relevance needed to engage executives.
Even the focus on change maturity, that is often the single most critical focus for change management functions, may or may not appeal to a lot of executives. Unless you have already taken the executives on the journey of why focusing on change maturity is critical and you have them fully onboard with this, treat carefully in reporting on change maturity metrics.
At executive level, change management reports should transcend departmental boundaries and speak to the broader organizational impact. This means that your focus should be on reporting at a portfolio level and key strategic initiatives as relevant. Focus on generating insights of what the totality of changes mean to the organisation, and what employee experiences are across multiple initiatives. Metrics should also align with strategic goals and showcase how the change initiatives contributes to overarching business objectives.
The Right Metrics
I. Change Readiness Metrics – Assessing the Pulse of the Organization
Change readiness metrics serve as a barometer for understanding how prepared an organization is for a change initiative. To provide meaningful insights, these metrics should delve into the engagement journey, capturing key elements such as awareness, involvement, and participation.
Awareness: Measure the level of understanding and awareness of the upcoming change across different employee segments.
Involvement: Assess the degree to which employees are actively engaged in the change process, seeking their input and involvement.
Participation: Evaluate the extent to which employees are actively participating in change-related activities and initiatives.
Data Collection Methodology
Utilize a mix of quantitative and qualitative methods to gather data, including surveys, focus groups, and feedback mechanisms.
Ensure a representative sample across different organizational levels and functions to capture a comprehensive view of readiness.
Utilize a mix of quantitative and qualitative methods to gather data, including surveys, focus groups, and feedback mechanisms.
Ensure a representative sample across different organizational levels and functions to capture a comprehensive view of readiness.
Change Readiness Topic Areas
1. Awareness Assessment:
This section evaluates the extent to which employees are aware of the impending changes across initiatives. It includes an analysis of communication effectiveness, the clarity of messaging, and the overall visibility of the change initiatives. Metrics may encompass the percentage of employees who understand the change purpose and the reach of communication channels.
2. Involvement Evaluation:
Involvement is a key factor in gauging how actively employees are participating in the change process. This explores the degree to which employees feel engaged and have opportunities to contribute to the planning and decision-making aspects of the change. Employees may not have the opportunities to contribute to all types of change initiatives but for those that are relevant this can be quite insightful. Metrics include participation rates in change-related workshops, the number of submitted suggestions, and levels of engagement in feedback sessions.
3. Perceived Impact:
This area delves into employees’ perceptions of how the changes will affect them personally and professionally. It includes an analysis of perceived benefits, risks, and the overall impact on day-to-day responsibilities. Metrics may encompass the percentage of employees who feel well-informed about the impact of the change and qualitative insights from open-ended survey questions.
4. Change Champions performance:
Identifying and nurturing change champions can be crucial for successful change implementation, especially across the change portfolio. The presence of key business change champions who actively support and advocate for the changes within their teams and business units can shed light on how the change is performing. Metrics include the presence of key change champions across business areas, their engagement levels, and the effectiveness of their engagement strategies within their respective departments.
5. Learning and Development Readiness:
Learning and development play a vital role in equipping employees with the skills necessary for the upcoming changes. This section evaluates the organization’s readiness to deliver learning programs effectively, including the availability of resources, the alignment of learning content with change objectives, and the accessibility of learning materials. This can be outlined not just at initiative levels, but from business unit perspectives. Different business units may have different processes and channels from which to deploy learning and development across initiatives. The readiness and maturity of these can make or break the adoption of changes.
6. Resource Allocation and Availability:
Change initiatives often require additional resources, and this section examines the organization’s capacity to allocate and provide the necessary resources for a smooth transition. Metrics include the allocation and availability of SME resources, business representatives, the availability of technology and tools, and the overall preparedness of support functions for the myriad of change initiatives. Is there adequate allocation of these resources? For example, for digital transformation is there still reliance on manual work processes that should be upgrade to drive efficiency and effectiveness?
7. Leadership Alignment:
Leadership alignment is a critical factor influencing change readiness. This section evaluates the extent to which various leaders are aligned with the change vision and actively communicate their support. Metrics encompass leadership messaging consistency, visibility, and the perceived commitment of leaders to the success of the change.
8. Employee Feedback Mechanisms:
Establishing effective feedback mechanisms is essential for continuous improvement during change initiatives. This section assesses the availability, content and effectiveness of channels through which employees can provide feedback, ask questions, and express concerns. Metrics include response rates to feedback requests, the variety of feedback channels used, and themes of responses from targeted employee groups.
Change Readiness Data Collection Methods
Collecting data on change readiness is a crucial step in understanding an organization’s preparedness for a change initiative. Various approaches can be employed to gather relevant information. Here’s a list of key approaches:
Surveys and Questionnaires
Focus Groups
Interviews
Observation
Benchmarking
Document Analysis
Readiness Workshops
Network Analysis
Online Platforms and Social Listening
Pulse Surveys
Interactive Assessments
II. Change Journey Analytics – Navigating the Transformation Landscape
Change journey analytics provide a view of what key employee change experience highlights are, including insights on any behavioural changes, attitudinal changes, the volume of changes and how changes are being driven against key business performance challenges.
Change Volume RisksChange volume risk measures highlight key change impact volumes across the business over time, with key call outs on any risks on heightened change periods. The volume and nature of changes can be mapped against strategies to indicate to what extent the level and pace of impacts are aligned with strategic plans
Change Activity DesignThe totality of change management activities across initiatives from the lens of impacted employee groups should be analysed with potential risks highlighted including the alignment of learning content, communication message consistency and alignment, and to what extent there maybe excessive or below expected types of change activities in facilitating the change journeys
Single View of Change of BAU and Strategic InitiativesProvide a consolidated view of ongoing business-as-usual (BAU) changes alongside strategic initiatives. This ensures that executives have a comprehensive understanding of the organizational change landscape. From the perspective of the impacted change stakeholders or employee groups, they may not care about the source of the change and whether it is strategic or not. BAU initiatives may also be even more impactful than strategic initiatives.
Business PerformanceLink change activities to business performance metrics. Demonstrate how the change initiative contributes to key performance indicators and strategic goals. Also shed light how the nature and volume of changes may or may not impact the overall business performance. Executives are focused on keeping the business running successfully during change implementation as much as possible, with minimum disruption
Change volume risk measures highlight key change impact volumes across the business over time, with key call outs on any risks on heightened change periods. The volume and nature of changes can be mapped against strategies to indicate to what extent the level and pace of impacts are aligned with strategic plans
The totality of change management activities across initiatives from the lens of impacted employee groups should be analysed with potential risks highlighted including the alignment of learning content, communication message consistency and alignment, and to what extent there maybe excessive or below expected types of change activities in facilitating the change journeys
Provide a consolidated view of ongoing business-as-usual (BAU) changes alongside strategic initiatives. This ensures that executives have a comprehensive understanding of the organizational change landscape. From the perspective of the impacted change stakeholders or employee groups, they may not care about the source of the change and whether it is strategic or not. BAU initiatives may also be even more impactful than strategic initiatives.
Link change activities to business performance metrics. Demonstrate how the change initiative contributes to key performance indicators and strategic goals. Also shed light how the nature and volume of changes may or may not impact the overall business performance. Executives are focused on keeping the business running successfully during change implementation as much as possible, with minimum disruption
Nurturing Lasting Transformation: The Role of Adoption Analytics in Sustainable Change
When we discuss adoption analytics, we transcend the traditional boundaries of project management. While implementation marks the beginning of change, adoption analytics guide us through the more profound stages, measuring the extent to which the organization has embraced and embedded the change. It’s about ensuring that the seeds of change and transformation take root, flourish, and yield sustainable benefits.
1. Business Performance Metrics: Gauging Impact on Organizational Vital Signs
To truly understand the success of change initiatives, one must look beyond the surface and delve into its impact on key business performance metrics. This involves a holistic examination of factors such as productivity, efficiency, and customer satisfaction (depending on what the changes are).
Productivity: Assessing the changes’ effects on productivity involves measuring the organization’s output and efficiency post-implementation. Has there been an increase in task completion rates, a reduction in errors, or an enhancement in overall workflow efficiency?
Efficiency: Changes often aim to streamline processes and enhance efficiency. Analyzing the efficiency metrics helps determine whether the new procedures or tools have resulted in a smoother and more effective workflow.
Customer Satisfaction: In many cases, change initiatives are driven by a desire to improve customer experience. Adoption analytics in this context involve gauging customer satisfaction levels, whether through surveys, feedback mechanisms, or other relevant indicators.
By examining these metrics, organizations can gauge the real impact of the change on their vital signs, ensuring that the intended improvements manifest in tangible and measurable ways.
2. Benefit Realization: From Anticipation to Tangible Outcomes
Anticipated benefits form the backbone of any change initiative, but true success lies in the tangible realization of these expected outcomes. Benefit realization assessment through adoption analytics involves tracking key performance indicators (KPIs) directly influenced by the change.
Tracking KPIs: Identify and monitor KPIs that are closely tied to the specific objectives of the change. These could include financial metrics, customer retention rates, employee engagement scores, or any other relevant indicators.
Tangible Outcomes: Work hand-in-hand with initiative benefit owners to ensure clear ownership and tracking of benefits. Establish a system that allows for the ongoing assessment of whether the anticipated benefits are being realized in practice.
Continuous Improvement: Benefit realization is an ongoing process. Regularly review and adjust strategies based on the data collected. This iterative approach ensures that the organization remains agile, adapting to changing circumstances and continuously optimizing the impact of the change.
Collaboration with Initiative Benefit Owners: A Crucial Element
A vital aspect of successful adoption analytics is collaboration with initiative benefit owners. These are individuals or teams responsible for overseeing the realization of anticipated benefits. Establishing clear ownership ensures accountability and facilitates a more targeted and effective approach to tracking and optimizing outcomes.
Clear Communication: Foster open lines of communication between change management teams and initiative benefit owners. Clearly communicate the expected benefits and collaborate on defining relevant metrics and tracking mechanisms.
Regular Check-Ins: Establish a framework for regular check-ins to assess progress, identify challenges, and strategize for ongoing success. These check-ins provide an opportunity to recalibrate efforts based on real-time insights.
Data-Driven Decision Making: Encourage initiative benefit owners to make data-driven decisions. Regularly review adoption analytics data together, and use these insights to inform strategic adjustments, ensuring that the organization is on a trajectory towards sustained success.
Adoption analytics are the linchpin in the journey from change initiation to sustainable integration. By meticulously measuring the impact on business performance and diligently tracking benefit realization, organizations can ensure that their transformative efforts result in lasting and meaningful change. Collaboration with initiative benefit owners enhances this process, fostering a culture of continuous improvement and adaptability that is crucial for navigating the ever-evolving landscape of organizational transformation.
Change practitioners may not be involved in all aspects of benefit realization and tracking. It could be that the focus is on ‘people’ and behaviour elements of changes that contribute to benefit realization. Incorporating these metrics into change management reports offers a comprehensive view of the change journey, from initial readiness to long-term adoption and benefits realization.
Crafting Compelling Change Management Reports
In the fast-paced world of change management, the ability to convey the impact of initiatives through well-crafted reports is a skill that cannot be underestimated. Executives require more than superficial metrics; they demand a nuanced understanding of how change aligns with strategic goals and influences organizational performance.
By steering clear of vanity metrics, activity-focused measurements, and overly cost-centric reporting, change management professionals can elevate their credibility and influence within the organization. Instead, a focus on change readiness, journey analytics, and adoption metrics provides a holistic perspective that resonates with executives, ensuring that the true value of change initiatives is accurately portrayed.
To gear up for the digital/AI-enabled world that we are already in, change practitioners should also be ready to adopt a range of digital tools to better present and converse about change management reports in a way that is interactive, and easy to generate data insights. Executives may ask a series of questions to probe deeper into the data, or want access themselves to be able to look into certain data points. The ability to answer these questions straight away using digital solutions will be the key to creating confidence, impact and trust with executives.
As organizations continue to navigate the complexities of change, the importance of insightful reporting cannot be overstated. It is not just about delivering change; it is about articulating its impact in a language that executives understand and appreciate. In doing so, change management professionals become not just implementers of change but strategic partners in driving organizational success. This is ultimately the goal for change teams and change practices.