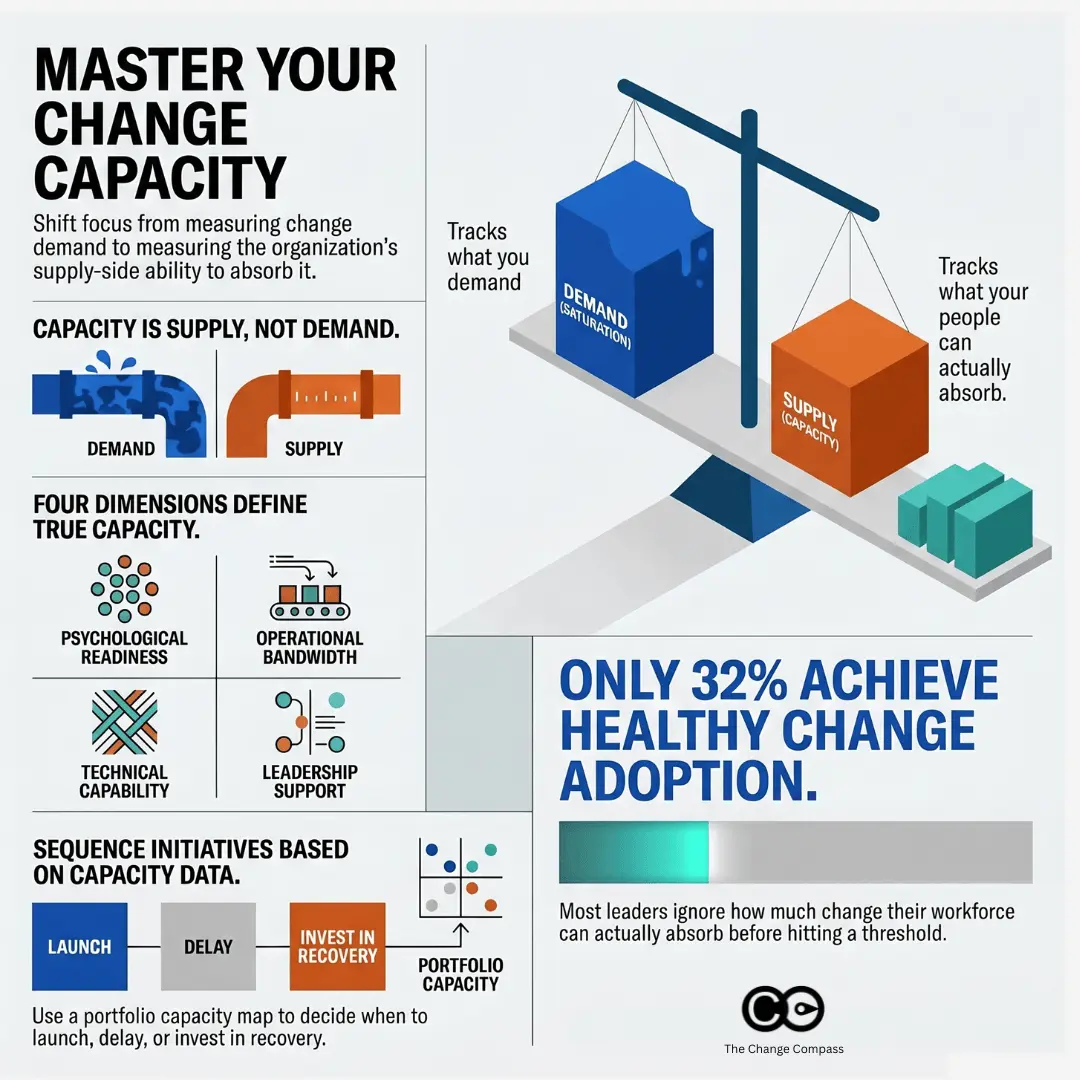
A Transformation Director recently described her tool selection process to me with a sentence that has stuck. “Most vendors we evaluated showed us a Gantt chart, a heatmap and a resourcing chart, and called it portfolio management. None of them could easily tell me which of our 30+ initiatives were competing for the same audience bandwidth, and none of them could explain why our adoption scores were sliding even though delivery was on track.”
This is the gap most buyers walk into. The change management software market has grown crowded over the last three years, and almost every vendor now promises a “single view of change”. For a PMO Director with a board paper due in two weeks, the demos look reassuringly similar. They are not. The difference between a visualisation tool and a real change portfolio management platform is the difference between a basic, generic dashboard and an intelligence layer that informs the decisions your executive team makes about sequencing, capacity and risk.
This guide is written for PMO/Transformation Directors and enterprise change leads who are evaluating a change portfolio management tool in 2026. It covers what the category actually requires, why your change data is your system of record, what AI features matter (and which to walk away from), and a seven-criteria framework to use in your shortlist conversations.
What change portfolio management actually is (and what most tools are selling instead)
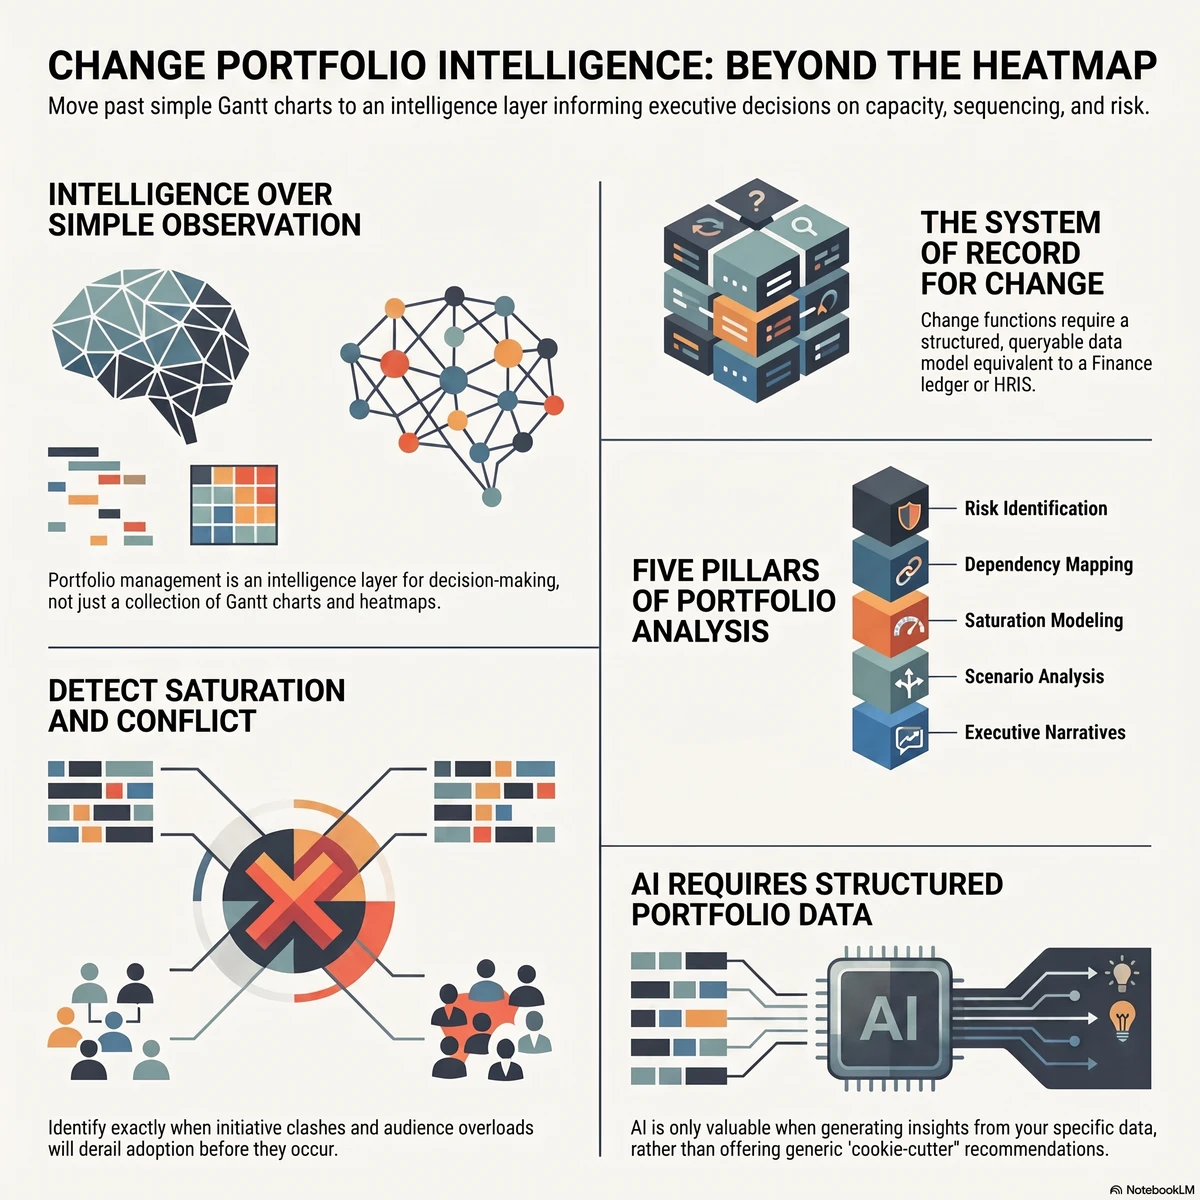
Let’s start with a definition. Change portfolio management is the structured, systematic discipline of managing change across the enterprise portfolio. It includes initiative-level analysis, cross-portfolio risk and opportunity identification, capacity assessment, conflict detection and visual data storytelling that informs business decision making at executive level. It is not a chart. It is a practice supported by a system, built on a defined set of change portfolio management best practices.
Most tools you will see in vendor demos are selling a slice of this. They will show you three views and stop:
A Gantt or timeline chart of initiatives plotted across the next 12 to 18 months
A heatmap of impacts by business unit or stakeholder group, usually colour-coded by month
A resourcing chart showing change practitioner allocation across the portfolio
Those three views are useful as visual artefacts. They are not portfolio management. Portfolio management is what you do with them. The vendor that shows you a heatmap but cannot help you interrogate it, model alternative scenarios, or detect the structural risks hiding inside it has given you a clipboard, not a platform. A useful test in a demo: ask “Show me where two initiatives are competing for the same stakeholder group in the same fortnight, and what the projected adoption impact is if we don’t re-sequence.”
The work a PMO is being asked to do has changed. McKinsey’s research on transformation has consistently shown that the bulk of value erosion happens in implementation, not strategy, with 42 per cent of value lost in the implementation and scaling phases. The PMO is the function closest to that loss. To prevent it, you need to do analysis, not just observation.
The portfolio analysis layer most tools skip
The work that turns visualisation into intelligence sits in five activities:
Risk and opportunity identification across the portfolio (where are we exposed, where are we under-using capacity)
Cross-initiative dependency mapping (which initiatives share the same audience, the same systems, or the same critical resources)
Saturation and capacity modelling (what is the true change load on each business unit at each point in time, and where does that breach safe thresholds)
Scenario analysis (if we delay initiative X, what does the load profile look like, and which audiences benefit)
Executive narrative development (how do we tell this story in one slide that drives the right decision)
A change portfolio management tool earns the name when it can support all five. Anything that stops at heatmaps and Gantt charts has stopped at observation.
Why your change data is your system of record
Here is the part most PMO conversations skip. Every other corporate function has a system of record. HR has its HRIS. Finance has its general ledger. Operations has its ERP. Risk has its GRC platform. Change is the only enterprise function still routinely run out of spreadsheets, slide decks and project management tools repurposed for portfolio reporting.
This matters more than it sounds. The system of record is not the tool. It is the authoritative source of data on which decisions are made. When the CFO needs to know the cash position, they don’t ask three teams to email their numbers and reconcile them in Excel. They look at the ledger. When the CHRO needs to know headcount, they look at the HRIS. The PMO is the function that should be the system of record for change data, and most PMOs aren’t, because they don’t have a tool that can hold the data in a structured, queryable, executive-ready form.
Why is this the foundation? Because the data informs everything that comes after it. The approach you recommend to the business, the sequencing decisions you make, the capacity warnings you raise, the readiness conclusions you draw. All of these are only as credible as the data underneath them. If your data lives in fragmented spreadsheets owned by individual change managers, your recommendations are anecdotal. If your data lives in a structured portfolio platform with consistent impact frameworks, audience taxonomies and historical patterns, your recommendations are evidence-based. The platform is upstream of the conversation.
This is also why a change portfolio tool is fundamentally different from a project management tool. Monday, Smartsheet and similar platforms are excellent at task tracking and team coordination. They are not designed to hold change data as a system of record. The fields they track (task, owner, status, due date) are not the fields a change leader needs to make portfolio decisions (impacted audience, change type, adoption risk, saturation contribution, dependency map). Trying to bolt change portfolio management onto a project management tool is like trying to run payroll out of Trello. It will technically work for a while, and it will fail at scale.
For a fuller treatment of why the change function deserves its own intelligence layer rather than a project tool with extra columns, the change intelligence platform pillar article goes deeper into the architecture.
Why standard charts cannot tell your story
The second area where tools quietly fail is data visualisation. The PMO’s job is not to display data. It is to influence executive decisions using data. Those are different jobs, and they need different visualisations.
Most vendors offer a fixed set of charts: a Gantt timeline, an impact heatmap, a resourcing bar chart, possibly a stoplight summary. These are fine for an analyst staring at a screen for ten minutes. They are not what a CEO needs to see in a 5-minute portfolio update.
The complexity of an enterprise change portfolio is genuinely high. You are simultaneously tracking initiatives with different start dates, different audiences (sometimes overlapping, sometimes nested), different change types, different risk profiles, different dependencies and different stages of maturity. A standard chart library can show you any one of those dimensions. None of them can show you the story you need to tell, which is usually two or three of them intersected.
What this means in practice: the data visualisation in a real portfolio tool needs to be flexible. You need to be able to filter, slice, overlay, drill down and reshape the view to match the question being asked. The CFO has a different question to the COO. The board wants a different cut to the divisional MD. The sequencing committee needs to see something different to the audit committee. If your tool gives you the same three charts for all of them, you are doing manual translation work every week that a properly designed platform would do in real time.
A practical test: in your shortlist demos, ask the vendor to build a chart that shows you the top five stakeholder groups by impact load over the next quarter, then layer in the projected change saturation score for each, then highlight which initiatives are driving the highest contribution. If the answer is “we’d need to build a custom report”, you’ve found the ceiling. If they can do it live in the platform, you’ve found a real visualisation engine.
The principle is straightforward: complex change demands flexible visualisation. The story changes, the audience changes, the question changes. The chart must change with it, and one glance must do the work.
AI features: what to look for, what to avoid
If you are evaluating change portfolio tools in 2026 and AI is not on your criteria list, your evaluation is out of date. The PMO use cases for AI fall into two buckets, and both matter:
Reducing manual effort. A change portfolio generates an enormous volume of administrative work: drafting impact statements, summarising initiative updates, normalising data from different change managers, generating stakeholder communications, building first-cut readiness assessments. A capable AI layer should automate large parts of this without removing the change manager from the loop.
Generating insight. This is the higher-value bucket and the one most providers are weaker on. The AI should be able to look across your portfolio and tell you things you wouldn’t have spotted by hand: emerging saturation hotspots, audience groups whose risk profile has shifted, initiatives whose adoption trajectory is diverging from the plan, dependencies that have moved into the critical path.
Both buckets require one thing the vendor demos often skip past: your data. This is the point many PMOs miss when they’re comparing tools against ChatGPT or Copilot. General AI tools cannot do portfolio-level work for you because they have no portfolio data. They can draft a generic impact statement. They cannot tell you that your Q3 SAP rollout is the third initiative landing on Operations in eight weeks and that adoption is at risk because Operations is already at 87 per cent of safe load. The data is what makes the AI useful.
There is a sharper version of this point worth making to your executive team. General-purpose AI tools used without your organisation’s change data will give you cookie-cutter recommendations. The bigger risk is not that the recommendations are generic. It is that they are confidently wrong, in a way that sounds plausible enough to act on. A general model with no context about your portfolio will recommend an approach that’s wrong for your sector, your maturity, your stakeholder base or your sequencing reality. The cost is not the bad recommendation. The cost is the time spent going down a wrong path because the recommendation sounded sensible. We treat this risk in more depth in the companion piece on AI change management automation, which explains the architecture difference between general AI and a change-data-informed AI layer.
What this means for your buyer’s evaluation:
The AI features must be trained on or fed by your portfolio’s structured change data, not bolted on as a generic LLM wrapper
The vendor should be able to demonstrate insight generation, not just text generation (drafting a paragraph is table stakes; spotting a saturation risk is differentiation)
There must be a clear and consistent path for human-in-the-loop review on any AI-generated recommendation that flows to executives
The AI must explain its reasoning (what data did it use, what assumptions did it make), so the change leader using it can defend the recommendation in the room
The vendor that says “yes, we have AI” without being able to demonstrate the data plumbing is, with respect, behind. AI without your data is generic by definition.
The seven criteria for evaluating a change portfolio management tool
If you take one artefact from this article into a shortlist conversation, take this. These are the seven evaluation criteria we recommend PMO Directors use, in priority order. Each is followed by a question to ask in the demo.
#
Criterion
Question to ask in the demo
1
Portfolio analysis depth
“Show me how you identify cross-initiative risk and opportunity, not just where you display it.”
2
Data as system of record
“What is the data model? Can it hold consistent impact, audience and saturation data across all initiatives, regardless of who entered it?”
3
Flexible data visualisation
“Build me a chart now, live, showing X dimension intersected with Y dimension for the top Z audiences.”
4
AI features informed by portfolio data
“Demonstrate one insight the AI surfaced that a human wouldn’t have spotted.”
5
Executive-ready outputs
“Show me the slide or dashboard you would put in front of my CEO. Can it be filtered by their question in real time?”
6
Saturation and capacity modelling
“How do you measure saturation? Is it a real model with thresholds, or a colour applied to a heatmap?”
7
Conflict and dependency detection
“Show me where two initiatives are competing for the same audience in the same window. Did the platform flag it, or did I have to find it?”
The order matters. A platform can have beautiful visualisations and weak data. A platform with weak data will mislead you. Start at criterion two if you’re tight on time. If the data model doesn’t hold up, nothing built on top will.
A few of these are worth a closer look.
Saturation and capacity
Change saturation is the single biggest cause of preventable adoption failure. Prosci’s research and our own client data consistently show that organisations that exceed their safe change load see a measurable drop in adoption rates, often well before any single initiative shows red on its individual report. The portfolio view is the only place this risk becomes visible.
A real saturation model has thresholds (per audience, per role, sometimes per geography), tracks contribution by initiative, and forecasts forward. A fake saturation feature is a heatmap with three colours. Make sure you can tell the difference. For more on the model, see our practical methodology for measuring change saturation.
Conflict and dependency detection
The structural problem with most enterprise change portfolios is not that the initiatives are individually badly run. It is that they are individually well run, on parallel tracks, by teams that never see each other’s stakeholder lists. Conflict detection is the platform capability that makes the hidden visible. Two initiatives competing for the same business unit in the same fortnight is a problem you cannot solve if you cannot see it. The right tool surfaces this automatically, not on request.
Executive reporting
The most overlooked criterion. Your tool is doing one of two things at executive level: making you look credible, or making you look like the spreadsheet team. There is no middle. The platforms that win at this layer let you generate executive views in real time, filter them live in the meeting, and answer questions on the spot. The ones that lose make you go away, build a slide and come back next week.
For a worked example of what executive-grade reporting looks like at a Fortune 500 financial services firm, see our case studies on elevating change data to the executive table.
The vendor landscape: what’s actually out there
The change portfolio management category includes four kinds of tools that PMOs commonly evaluate. None are equivalent.
1. Project and work management platforms (Monday, Smartsheet, Asana, Jira, Microsoft Project). Strong at task tracking, team coordination and basic Gantt visualisation. Weak at change-specific data structures (impacted audience, change type, saturation contribution) and almost universally weak at portfolio-level analytics. Useful as your delivery tool. Not a change portfolio platform. The common failure mode is the PMO that tries to retrofit Monday with custom columns and reports, ends up with a high-maintenance spreadsheet, and concludes “tools don’t work for change”. The tool wasn’t built for change.
2. HR analytics and employee experience platforms (Workday Adaptive, Visier, Glint, Culture Amp). Strong at employee sentiment, engagement data and HR analytics. Weak at initiative tracking and portfolio composition. Useful as a complementary data source feeding readiness insights. Not a portfolio platform on their own.
3. General-purpose AI tools (ChatGPT Enterprise, Copilot, Claude, Gemini). Strong at text generation, drafting and conversational analysis. Weak at portfolio data management because they don’t have your data. Useful as a productivity layer for individual change managers. Not a portfolio platform.
4. Purpose-built change portfolio platforms (The Change Compass and a small number of others). Designed from the data model upwards for change portfolio work: change-native fields, structured audience taxonomies, saturation modelling, cross-initiative analytics, AI insight layer informed by portfolio data, executive-grade visualisation. This is the category to evaluate against your seven criteria.
This taxonomy matters because the wrong category will look adequate in the first 90 days. The cracks show at scale, when the portfolio grows past 20 to 30 active initiatives, when the executive team starts asking forward-looking questions, and when adoption issues start surfacing that the tool cannot diagnose.
A short list of things that should slow your evaluation down, not speed it up:
The demo shows the same three charts (Gantt, heatmap, resourcing) and the vendor calls it portfolio management
The vendor cannot answer how their AI uses your data (the answer “we use OpenAI’s API” is not an architecture)
The data model is not visible or not explained, or every customer apparently configures it from scratch
Saturation is described but not measured (no thresholds, no model, just colour)
Executive reporting is “we’ll build you a custom dashboard” rather than a real-time configurable view
Conflict and dependency detection requires a custom report or human analysis to surface
The vendor’s reference customers are all individual change managers, not PMO Directors or transformation leaders
Pricing is not anchored to data volume or portfolio size, which usually means it will become anchored to them later
None of these is fatal on its own. A pattern of three or more should make you go back to the brief.
What the right tool actually does for you
The point of all of this is not the tool. It is the outcomes the right tool unlocks. A real change portfolio management platform should move the needle on three things:
Systemic change capability. Not the capability of individual change managers, who are usually competent. The capability of the function as a whole to do portfolio-level work consistently. A platform with a real data model lifts the floor of the function. Less time spent reconciling spreadsheets, more time spent on analysis, advisory and influence.
Adoption and readiness. The downstream measure. Better data leads to better sequencing decisions, better load management, better stakeholder conversations and better readiness preparation. Better readiness preparation leads to better adoption. The mechanism is upstream. The result is adoption rates that move because the underlying conditions move.
Executive influence. The metric most PMO Directors quietly care about. Your change data, when held in a system of record and visualised flexibly, becomes a data set the executive team treats as authoritative. The conversation moves from “the change team is asking us to slow down” to “the portfolio data shows we are at 92 per cent capacity in Operations next quarter, here is the sequencing recommendation”. This is the shift Northwestern Mutual described in their work with us: change data elevated to the same level of visibility and priority as financial and operational data.
The Change Compass is the platform we’ve built for this category. We exist because PMO Directors at firms like Northwestern Mutual, IAG and NiSource told us the tooling they had wasn’t enough. We aren’t the only option you should evaluate. We are the option you should benchmark the rest against. If you’d like to see what a purpose-built change portfolio platform looks like applied to your portfolio, our team runs PMO-focused demos that walk through the seven criteria above using real data structures. Book one, or pressure-test your shortlist against the criteria with your own internal team. Either way, the framework is what matters.
Where to start
If you take one action from this article, make it this: before you sit through another vendor demo, write down the three portfolio questions your executive team is asking that your current tooling cannot answer cleanly. Maybe it’s “are we going to overload Operations next quarter”. Maybe it’s “where are two initiatives quietly competing for the same audience”. Maybe it’s “what’s our forward 12-month saturation curve and where does it breach”. Bring those three questions to every demo. Ask each vendor to answer them live, with their tool, using a portfolio data set, not a slide deck. The right tool will answer at least two of them in the demo and show flexibility in catering for audience needs.
The category is changing fast and the gap between the visualisation tools and the real portfolio platforms is widening, not narrowing. Choose the platform that treats your change data as a system of record, makes it flexible to visualise, applies AI on top of it rather than instead of it, and gives you outputs your executive team actually uses. That’s the buy that pays back. Anything less is a clipboard. If your executive team still needs convincing that portfolio data belongs on their agenda, our guide to building change portfolio literacy in senior leaders covers how to bring them along.
What is a change portfolio management tool? A change portfolio management tool is a software platform built specifically to hold, analyse and visualise change data across an enterprise portfolio of initiatives. It is distinct from a project management tool (which tracks tasks and timelines) and from a general BI or analytics tool (which lacks change-specific data structures). It supports portfolio-level activities such as risk identification, capacity and saturation modelling, conflict and dependency detection, and executive reporting.
How is change portfolio management different from project portfolio management? Project portfolio management focuses on delivery: what initiatives are running, who owns them, what milestones are due, what budget is committed. Change portfolio management focuses on the people-side outcomes: which audiences are impacted, by what change types, at what load, with what adoption risk. The two are complementary, but the data structures and the analytical questions are different. A PPM tool tells you whether projects are on track. A change portfolio tool tells you whether your organisation is on track to absorb them.
Do general AI tools like ChatGPT or Copilot replace the need for a change portfolio platform? No. General AI tools are useful for individual productivity tasks (drafting communications, summarising notes, generating first-cut content). They are not portfolio platforms because they don’t hold your change data as a system of record. Recommendations from general AI tools without your portfolio data tend to be generic at best and confidently wrong at worst, because they have no context for your sector, your maturity, your stakeholder base or your sequencing. The two tool categories are complementary, not substitutes.
What is the most important criterion for choosing a change portfolio tool? The data model. A platform with a strong data model can be improved everywhere else; a platform with a weak data model can never be saved by features bolted on top. Ask the vendor to explain how the platform holds impact data, audience taxonomies, saturation contribution and dependencies in a consistent, queryable structure. If they cannot explain it clearly, that’s your answer.
How long should a tool evaluation take? For an enterprise PMO, expect six to twelve weeks from shortlist to decision. The two highest-leverage activities in that window are: (a) running a pilot against your real portfolio data, not a demo data set, and (b) interviewing two or three reference customers at PMO Director level, not change manager level. Skipping either of those will cost you more later than they cost you now.
A change management centre of excellence is usually busy, well-liked, and quietly vulnerable. It runs the methodology, maintains the templates, trains the practitioners, and deploys change managers onto whichever projects shout loudest. Everyone who works with it says good things. And then a new CFO arrives, asks what measurable difference the function makes to the outcomes the board cares about, and the honest answer turns out to be a list of activities rather than a line of evidence. Within two budget cycles the centre is reframed as a cost, its people are redistributed into the business, and the organisation goes back to doing change one project at a time.
This is a common occurance of a change management centre of excellence built on the wrong premise. Most are built as one of two things: a methodology/learning team to improve ‘capability’, or a body shop of change managers. The library version owns standards, templates, and training, and measures itself by adoption of the method. The body-shop version is a pool of change practitioners deployed to projects, measured by utilisation. Both are operationally useful. Neither is strategic, and neither survives serious scrutiny, because both answer the question “are we doing change management well?” when the question executives are actually asking is “will the things we are betting the company on actually land, and can we see the risk in time to act?”
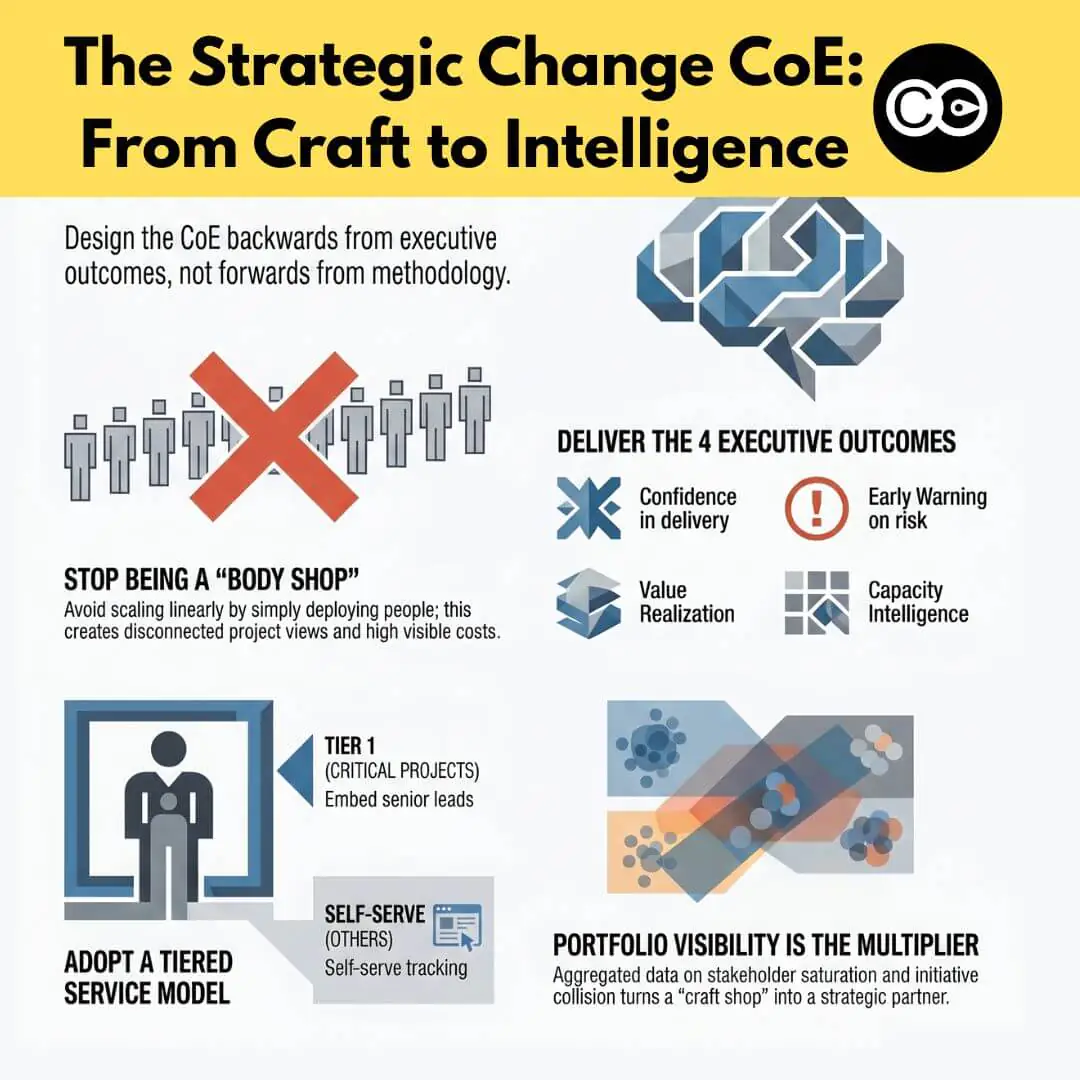
The centres that endure are designed backwards from that second question. They are aligned to executive outcomes, they allocate their scarce resources by strategic importance rather than by who asked first, and they offer differentiated levels of service rather than spreading a thin layer of support evenly across every initiative. Most importantly, they sit on an intelligence layer that lets them see the whole portfolio, which is what separates a strategic capability from a craft shop. This article lays out what that actually requires.
What a change management centre of excellence is actually for
The purpose of a change management centre of excellence is not to do change management well in the ‘theory’. It is to increase the probability that the organisation’s portfolio of change lands, and to give leadership visibility of the risk to that portfolio while there is still time to act. Everything else, the standards, the tooling, the coaching, is in service of that outcome, not an end in itself. When a centre forgets this, it optimises its craft and loses its mandate.
The two default models and why they plateau
The methodology-capability model treats the centre as the custodian of “how we do change here”. It standardises the approach, builds templates, accredits practitioners, and runs a community of practice. This is genuinely valuable, and it is where most centres should start. But it plateaus, because a library is a fixed asset that depreciates. Once the method is published and people are trained, the marginal value of the library falls, while its visible cost stays the same. A library or a distributed change capability improvement at some level cannot tell an executive anything about whether the portfolio is at risk.
The body-shop model treats the centre as a resourcing pool. It hires change managers centrally and deploys them to projects on demand, billing time and measuring utilisation. This feels strategic because it is operationally indispensable, but it is the more dangerous trap of the two. A body shop scales linearly: more change requires more people, costs rise in lockstep with demand, and the function is permanently one efficiency drive away from being outsourced. Worse, because each practitioner is embedded in a single project, no one in the body shop sees across the portfolio. The function that should hold the enterprise view instead holds dozens of disconnected project views.
The strategic reframe: design backwards from outcomes
The reframe that escapes both traps is to design the centre from executive outcomes backwards. Instead of asking “what does good change management look like and how do we deliver it everywhere”, ask “what do our executives need to be confident about to run successful change and transformation, and what would the centre have to see, know, and do to give them that confidence”. The answer reorganises the whole function. It makes portfolio visibility a core capability rather than an afterthought. It makes prioritisation a deliberate act rather than a queue. And it makes the centre a source of intelligence about enterprise risk, not just a supplier of change-management labour.
Start with the outcomes executives actually want
Executives do not want better change management … necessarily. They want a small number of outcomes, and a change management centre of excellence earns its mandate by being demonstrably the function that improves them. In practice, senior leaders are looking for four things from the change portfolio:
Confidence that the critical initiatives will land. Not activity reports, but a credible read on whether the changes the strategy depends on will actually be adopted.
Early warning on risk. The ability to see an adoption problem, a capacity breach, or a conflict between initiatives early enough to do something about it, rather than in a post-implementation review.
Value realisation. Evidence that the benefits in the business case are being captured, and a clear account of where they are leaking. This is the territory of the return on investment of change management, and it is the language that wins executive sponsorship.
Capacity/adoption intelligence for decisions. A defensible answer to “can the organisation absorb this on top of everything else and how are we on track to fully adopt the changes”, so that portfolio and investment decisions are made against real capacity/adoption rather than optimism.
Notice what is not on that list: methodology adoption, template usage, practitioner accreditation, utilisation. Those are means, and a centre that reports them to executives is answering a question no one asked. Design the centre so that its core reporting speaks directly to the four outcomes above, and the conversation about its value changes entirely.
The capabilities a strategic change CoE needs
A strategic centre needs five core capabilities. The first three are what most centres already have or aspire to. The last two are what separate a strategic capability from a methodology library, and they are the ones most often missing.
Capability
What it delivers
Executive outcome it serves
Maturity signal
Standards and method
A consistent, fit-for-purpose change approach
Confidence in delivery quality
The method is used because it helps, not mandated
Tools and templates
Reusable artefacts that lower the cost of good practice
Efficiency and consistency
Practitioners reach for them by default
Coaching and capability building
Skilled change practitioners and change-capable leaders
Confidence the critical initiatives will land
Business leaders run change competently with light support
Portfolio visibility and intelligence
A live, aggregated view of change load, risk, and conflict across the enterprise
Early warning on risk; capacity intelligence
Leadership consults the centre before approving new initiatives
Governance and prioritisation
Disciplined allocation of scarce change resource to what matters most
Value realisation; capacity intelligence
The centre can say no, or not yet, with evidence
The capability that does the most to make a centre strategic is portfolio visibility. A centre that can see across every active initiative, where the load is concentrated, where initiatives collide, which stakeholder groups are saturated, is a centre that can answer the executive’s real questions. Without it, even a well-run centre is, in effect, a methodology library with a coaching service attached. This is also the capability that benefits most from AI-supported change automation, because aggregating and interpreting portfolio data at scale is precisely the kind of work that is impractical to do manually across dozens of initiatives.
Prioritise by strategic importance, not by who asks first (or is more influential)
The defining constraint of every change centre is that change resource is scarce and demand is effectively unlimited. Every initiative wants a change manager. The body-shop response is to ration by availability and seniority, which means resource flows to the loudest sponsors rather than the most important initiatives. The strategic response is to allocate deliberately, by strategic importance.
This requires the centre to hold an explicit view of which initiatives matter most to the enterprise, and to be willing to differentiate. Not every initiative deserves a dedicated change lead, and pretending otherwise is how centres spread themselves so thin that they add little anywhere. The uncomfortable truth is that a centre trying to support everything equally is implicitly deprioritising the initiatives that matter most, by denying them the depth of support their importance warrants. Prioritisation is not bureaucracy. It is the mechanism by which a scarce resource is pointed at the highest-value work, and it is impossible to do credibly without the portfolio visibility described above.
The shift is easier to see with a concrete picture. Consider a centre with six change practitioners facing a portfolio of thirty initiatives. The body-shop instinct is to spread those six across as many initiatives as possible, giving each a fraction of a change manager and none of them enough. Every initiative gets a name against it, and almost none get real support. The strategic alternative is to look at the thirty through the lens of strategic importance, identify the three that the corporate strategy genuinely depends on, and place a dedicated senior lead on each. The remaining three practitioners then run a coaching model across the next tier of important initiatives, while the rest are served by self-serve enablement and portfolio tracking. The same six people now create disproportionate value on the initiatives that matter, instead of uniform mediocrity across all thirty. The only thing that changed was the willingness to differentiate, backed by a clear view of which initiatives sit where.
A tiered service model for limited change resources
The practical expression of prioritisation is a tiered service model. Rather than offering one undifferentiated service (a change manager on your project) to whoever secures one, a strategic centre offers different levels of service matched to the strategic importance and complexity of each initiative. This is the single most effective move a centre can make to escape the body-shop trap, because it breaks the assumption that the centre’s only product is one-to-one practitioner deployment.
A workable four-tier model looks like this:
Tier
Who it is for
What the centre provides
Resource intensity
Tier 1: Embedded
The handful of enterprise-critical, high-complexity initiatives
A dedicated, senior change lead working full-time on the initiative
High
Tier 2: Guided
Important initiatives with a business-side change owner
A centre consultant who coaches the embedded owner, reviews artefacts, and assures quality on a regular cadence
Medium
Tier 3: Enabled
Standard initiatives run by capable business teams
Self-serve toolkit, templates, training, and scheduled office hours; the business runs its own change
Low
Tier 4: Tracked
Everything else with a change footprint
No direct support, but the initiative is captured in the portfolio view for load, conflict, and saturation monitoring
Minimal
Three things make this model work. First, the tier is assigned by strategic importance and complexity, not by who asks, which is what enforces the prioritisation discipline. Second, every initiative gets something, even if it is only Tier 4 portfolio tracking, which means the centre retains enterprise-wide visibility rather than only seeing the projects it staffs. That visibility is what lets the centre answer portfolio-level questions no body shop can. Third, the model scales without scaling headcount linearly, because most initiatives sit in the lighter tiers, and the centre’s scarce senior practitioners are concentrated where they create the most value.
The tiered model also reframes the centre’s identity. It is no longer “the place you get a change manager”. It is the function that decides, on evidence, how much and what kind of change support each initiative warrants, and that holds the only complete view of change across the enterprise. That is a strategic position. A body shop can never occupy it.
The intelligence layer that makes a centre strategic
Every capability above depends on one thing the traditional centre lacks: a live, aggregated view of change across the whole portfolio. Without it, prioritisation is guesswork, the tiered model cannot see what sits in Tier 4, and the executive outcomes about risk and capacity cannot be answered at all. This is why a change management centre of excellence without portfolio data is, in the end, a methodology library with good intentions.
This is the role a change intelligence platform plays for the centre. Change Compass aggregates impact, load, and risk data across every initiative in the portfolio, giving the centre the enterprise-wide view that turns it from a craft function into a strategic one. It is what lets the centre tell an executive, with evidence, that a stakeholder group is saturated, that two initiatives are about to collide, or that the portfolio is carrying more change than it can absorb. The platform does not replace the centre’s people or method. It gives them the intelligence layer that makes their judgement visible and credible at the enterprise level. For centres evaluating how to build this, the criteria are the same ones covered in any serious assessment of change portfolio management tools.
The maturity journey from informal to embedded
No centre arrives fully formed, and trying to stand up all five capabilities at once is a common way to fail. The journey runs through three broad stages.
Informal
Change is done project by project, with no shared method and no central function. Some practitioners are good, some are not, and there is no enterprise view. The first move is to establish standards and a small core team: the methodology-library foundation, which is a legitimate and necessary starting point.
Functional
The centre exists, owns the method, builds capability, and deploys or coaches practitioners. This is where most centres stall, because it is comfortable and visibly useful. The risk is mistaking this stage for the destination. A functional centre is still answering “are we doing change well”, not “will the portfolio land”.
Strategic and embedded
The centre operates the tiered service model, allocates by strategic importance, holds the portfolio intelligence, and reports to executives in the language of risk, capacity, and value. At this stage the centre is consulted before initiatives are approved, not just after they are funded. It has moved from supporting change to shaping the change agenda, and its mandate is secure because its value is visible in the outcomes leaders care about.
Where to start
If your centre today is a library, a body shop, or both, the highest-value first move is not to add people. It is to build the portfolio view and reframe what the centre reports. Start tracking every initiative with a change footprint, even the ones you do not staff, so you can see the enterprise picture. Then introduce the tiered service model, so your scarce senior practitioners are concentrated on the initiatives that matter most rather than spread evenly across all of them. Finally, change what you report to executives, from activity and utilisation to portfolio risk, capacity, and value realisation. A change management centre of excellence becomes strategic the moment it can answer the question executives actually ask, which is not whether change is being managed, but whether the things the organisation is betting on will land, and whether anyone can see the risk in time. Build the centre that answers that, and it will not be the function that gets cut in the next review. It will be the one the board asks for more of.
Frequently asked questions
What is a change management centre of excellence? A change management centre of excellence is a central function that raises the probability the organisation’s change portfolio succeeds, by owning the change method, building capability, allocating scarce change resource, and holding an enterprise-wide view of change risk and capacity. The strongest centres are defined by their portfolio intelligence and executive alignment, not just by the methodology and templates they maintain.
What does a change COE actually do? At maturity, a change COE does five things: it sets standards and method, provides tools and templates, builds change capability through coaching, maintains portfolio visibility across all initiatives, and runs the governance and prioritisation that directs limited change resource to the most important work. The first three are common; the last two are what make a COE genuinely strategic rather than a methodology library.
How do you structure a change COE with limited resources? Use a tiered service model that matches the level of support to each initiative’s strategic importance and complexity. A typical model has four tiers: a dedicated change lead for enterprise-critical initiatives, a coaching and assurance model for important ones, a self-serve toolkit for standard ones, and portfolio tracking only for the rest. This concentrates scarce senior practitioners where they add the most value and keeps every initiative visible.
How is a change COE different from a project management office? A PMO is generally concerned with delivery of projects: scope, schedule, budget, and dependencies. A change COE is concerned with adoption of the changes those projects create, and with the cumulative impact of change on the workforce. The two are complementary, but a change COE answers questions a PMO cannot, particularly about stakeholder load, change saturation, and whether the organisation can absorb what it is delivering.
How do you measure the value of a change COE? Measure it in the language executives use: confidence that critical initiatives will land, early warning on portfolio risk, value realisation against business cases, and capacity intelligence for investment decisions. Avoid reporting only activity metrics such as methodology adoption or practitioner utilisation, because they describe effort rather than the outcomes leadership actually cares about.
Ask a senior change manager in a large organisation whether their portfolio contains change conflicts and the honest answer is usually some version of “probably, but I couldn’t tell you exactly where”. That is not a failure of effort. It is a failure of visibility. In a portfolio of fifteen to forty concurrent initiatives, each governed in its own steering committee with its own definition of success, conflicts between initiatives are the default condition, not the exception. The harder problem is that the conflicts only become obvious in hindsight: in next quarter’s engagement dip, in a softening adoption curve, in a manager’s exit interview that mentions “too much change at once” without naming the specific collisions that caused it.
Change conflict, in the portfolio sense, is any structural collision between two or more change initiatives that competes for the same finite resource inside the impacted employee’s experience. The resource might be attention, time, behavioural bandwidth, leadership credibility, training capacity, or system stability. The conflict is rarely deliberate. It is the predictable consequence of running multiple initiatives that were each designed in isolation, governed in isolation, and measured in isolation.
This is a different concept from interpersonal conflict on a team, and different again from project portfolio dependency conflict in the PMO sense (where the unit of analysis is the deliverable, and the conflict is over scope, schedule, budget, or sequencing of project outputs). Change conflict sits between the two. The unit of analysis is the impacted employee, and the resource being competed for is their absorption capacity. A portfolio with zero project-dependency conflicts can still saturate the workforce in ways that destroy adoption, because the project view does not look sideways at the employee experience.
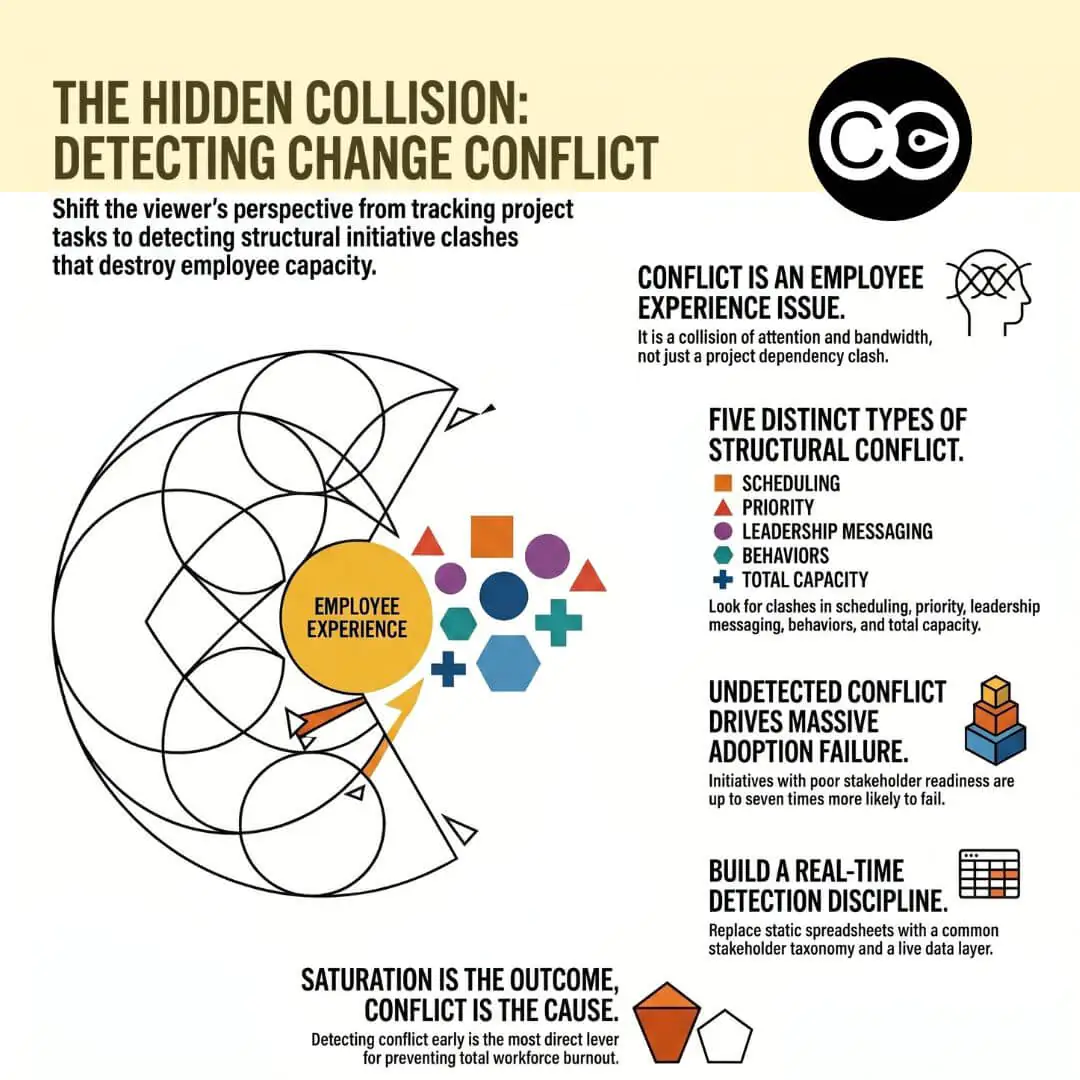
Change conflict is also one of the principal mechanisms that produces change saturation at the portfolio level. Saturation is the state in which the workforce can no longer absorb additional change. Conflict is one of the underlying drivers, because it draws on the same finite resource from multiple directions at once. Detecting conflict early is one of the most direct levers an organisation has for preventing saturation. Saturation is the outcome. Conflict is one of the causes you can actually do something about.
Why change conflicts are structurally hard to detect
Change conflicts are not hard to detect because they hide. They are hard to detect because the systems we use to govern change portfolios were never designed to see them.
Each initiative has its own sponsor, steering committee, status report, and definition of success. Every one of those artefacts looks inward at the initiative. None of them looks sideways at the other initiatives sharing the workforce. The PMO sees deliverables. The change team sees their initiative’s stakeholders. The HR business partner sees engagement scores. The line manager sees their day. No node in standard project governance is responsible for the intersection.
The result is that conflicts can only be diagnosed retrospectively: in the engagement survey that lands two quarters later, in the adoption metric that softens without obvious cause, in the spike of mid-level attrition, or in the post-implementation review that traces failure to “change fatigue” without naming the specific collisions that caused it. By that point, the cost has compounded, the conflicts that produced it have moved on, and the next portfolio cycle repeats the pattern.
Change conflict detection, as a discipline, is the deliberate work of closing this gap. It treats portfolio collision as a discoverable, classifiable, real-time signal rather than a retrospective story. To do that, you need three things: a named taxonomy of conflict types so you know what you are looking for, a method for surfacing each type before it manifests, and a data layer that can aggregate impact across initiatives without depending on spreadsheets that age out within a fortnight.
The five types of change conflict you need to detect
Change conflict shows up in five distinct, recognisable forms. The categories are not academic. Each has its own diagnostic signal and its own characteristic failure mode when undetected.
Scheduling conflict
The most familiar type, and the only one most PMOs actively manage. Scheduling conflict occurs when two or more initiatives require the same group of employees to engage with major change events in the same window. Two go-lives in the same fortnight. A system cutover the same week as a structural reorganisation announcement. A mandatory training module landing in the same sprint as a performance-review cycle change.
Scheduling conflict is the easiest to spot, because dates are visible, but it is the most underestimated. Resolving it by sliding events apart by a week declares the problem solved without addressing the cumulative cognitive load on the same group across a six-week absorption window.
Priority conflict
Priority conflict occurs when two initiatives ask the same employee, manager, or team to treat their initiative as the top priority for the same period. Operations excellence asks branch managers to focus on cost reduction. The customer experience programme asks them to focus on relationship deepening. The risk culture initiative asks them to focus on conduct and escalation discipline. Each is a legitimate priority on its own. Together, in the same quarter, they are a contradiction.
This is the most corrosive of the five, because it cannot be resolved by sequencing. Employees and middle managers eventually pick one, usually the one whose owner has the most political weight, and the others quietly fail. Detection requires you to compare not just calendars but stated priorities, by stakeholder group.
Leadership and management messaging conflict
Leadership messaging conflict happens when the senior leaders associated with different initiatives say things that contradict each other, or use language that signals different cultures, values, or behavioural expectations. The CFO writes that “speed of execution” is the strategic priority. The CHRO writes that “psychological safety” is the cultural shift. The COO emails about “doing more with less”. The CEO speaks about investing in capability. Together, in the same eight-week period, they tell the employee that leadership does not know what it wants.
Prosci’s 12th Edition Best Practices in Change Management (drawing on more than 10,800 practitioners) repeatedly identifies active and visible sponsorship as the single largest predictor of change success. The corollary, that contradictory sponsorship is a primary predictor of failure, is the part most organisations under-instrument. Management messaging conflict is the line-manager version of the same problem: when middle managers are asked to coach contradictory behaviours, they default to delivering neither.
Behavioural conflict across initiatives
Behavioural conflict is distinct from messaging conflict. Messaging conflict is what leaders say. Behavioural conflict is what initiatives require employees to actually do. Two initiatives can have aligned leadership messaging and still ask employees to perform contradictory behaviours on the ground.
A common example sits in regulated contact-centre environments. A regulatory change programme implements a new disclosure obligation requiring agents to disclose additional product or risk information to customers and to actively prompt for follow-up questions before closing the call. At the same time, the operational leadership team is running an efficiency initiative aimed at reducing the average handle time per call. Both initiatives are legitimate, both have executive sponsors, and both are being delivered correctly within their own scope. From the agent’s seat, they are mutually exclusive instructions arriving in the same week from different parts of the organisation, with no forum in which the contradiction can be raised. A second common pattern: a risk-conduct programme asks bankers to escalate any uncertainty, while a sales productivity programme rewards closing in-meeting.
Behavioural conflict is structurally invisible to most change methodologies because most impact assessments capture process and system changes but not behavioural shifts. Detection requires extending stakeholder impact analysis to include the behavioural request explicitly, and aggregating those requests at the stakeholder-group level.
Resource and capacity conflict
The fifth type is often confused with scheduling conflict. Resource and capacity conflict occurs when multiple initiatives draw on the same finite pool of human capacity, even if their events are not scheduled in the same week. The pool may be the change team itself, the training function, the technology platform team, or, most commonly, a single critical stakeholder group whose absorption capacity is being drawn on for months at a stretch.
Capacity conflict has a cumulative signature. It looks fine in any given week. It produces burnout, error rates, and decision fatigue over a quarter. The diagnostic question is “what is the cumulative draw on this group over a rolling twelve-week window?” not “is there a clash this fortnight?”.
The cost of undetected change conflict
The cost shows up in four observable ways, all measurable if you instrument for them.
The first is collapsed adoption. Prosci’s research consistently shows that initiatives with poor stakeholder readiness are six to seven times more likely to miss their objectives than those with strong readiness, and conflict is a primary driver of poor readiness because stakeholders forced to choose between competing demands will protect their own day-to-day function. The second is leadership credibility erosion. Employees who experience contradictory leadership signals across initiatives stop trusting the strategic narrative itself, and that loss of trust compounds across future changes. The third is attrition. Workplace Intelligence research found that 53% of employees report experiencing too much change at once, with 71% feeling overwhelmed by the volume of change. Employees in saturated, conflict-heavy environments leave at materially higher rates than employees in coherent ones. The fourth, and most often missed, is middle-manager capacity collapse: the layer of the organisation that absorbs portfolio conflict by translating contradictions into a workable narrative for their teams. Over time they stop translating, behavioural change quietly stops across the portfolio, and no project sponsor sees it.
In every one of those failure modes, the underlying conflict was technically detectable at the point of portfolio planning. The cost is not the conflict. The cost is the delay between when the conflict became real and when anyone in the organisation noticed.
How to detect change conflict: a five-step method
Detection is a discipline, not a tool. Whether you do it manually or with platform support, the method is the same.
Establish a common stakeholder taxonomy. Every initiative must categorise impact against the same set of stakeholder groups, defined consistently across the portfolio. Without this you cannot aggregate. Most organisations discover that their initiatives use overlapping but non-identical group names (“branch managers” in one, “frontline leaders” in another, “RMs” in a third), which makes aggregation impossible.
Overlay every initiative on a single calendar at the stakeholder-group level. Not at the project-milestone level. The output should show, for each stakeholder group, every event that touches them across the next twelve weeks, colour-coded by intensity. The eye picks up scheduling and capacity conflicts immediately when the data is visualised this way. This is the function of a change saturation heatmap.
Audit the leadership and management messaging across initiatives. Pull the last eight weeks of all-hands communications, sponsor videos, and manager talking-point packs across every active initiative. Read them as a single corpus. Look for contradictory framing, mismatched language about culture or pace, and gaps where one initiative implicitly contradicts another.
Map behavioural requests at the group level. For each stakeholder group, list every behaviour each initiative is asking them to perform or stop performing. Identify the contradictions. This is the step almost no organisation does, and it is the one that surfaces behavioural conflict.
Compute cumulative draw per stakeholder group. For each group, calculate the volume of impact, training, communication touches, and behavioural requests across a rolling twelve-week window. Mark groups exceeding their absorption ceiling. This is the capacity conflict view, and it requires a defined capacity model to make sense of the numbers.
These five steps together produce a portfolio conflict picture rather than a project conflict picture. The output usually reveals that several initiatives have been quietly damaging each other for months. That discomfort is the entry point to actually managing them.
Why spreadsheets, project management tools, and generic AI cannot detect change conflict
Most organisations attempt change conflict detection with the tools they already have. The attempts fail in predictable ways, and the failure is structural rather than a question of effort.
Spreadsheets can hold the data, but they cannot keep it current. The moment any initiative replans (which happens weekly in a real portfolio), the spreadsheet ages out. A spreadsheet rebuilt monthly is detecting conflicts that have already manifested. A spreadsheet rebuilt weekly consumes a half-time analyst and still trails reality.
Project management tools (Monday, Smartsheet, Jira, MS Project) are designed to track deliverables, not impacts. Their unit of analysis is the project task, not the impacted employee. They have no native model of stakeholder groups, no aggregation across initiatives by group, no behavioural-request layer, and no capacity ceiling against which to compare. You can build extensions, but you end up building a change intelligence platform inside a project tool, badly.
Generic AI assistants (ChatGPT, Copilot, Gemini) have a deeper limitation: they have no access to the organisation’s portfolio data. A ChatGPT prompt about whether initiatives A, B, and C are in conflict can only produce a plausible-sounding generic answer drawn from training data. It cannot know that initiative B has just slipped two weeks, that stakeholder group X is also being touched by initiative D, or that the behavioural request in initiative C contradicts the messaging in A. Conflict detection requires cross-initiative organisational data aggregated in real time, structured against a common taxonomy. That is not a prompt problem. It is a data infrastructure problem.
This is why a purpose-built change intelligence platform sits in a different category from the alternatives. Detection at portfolio scale is not a feature you can bolt onto a general-purpose tool. It is the data architecture or it is nothing.
How Change Compass’s Conflict Detection Engine works
Change Compass implements change conflict detection as a continuously-running engine across the live portfolio, not a periodic spreadsheet exercise. The platform aggregates impact data from every active initiative against a common stakeholder taxonomy, then evaluates each stakeholder group against five conflict signals in real time.
What triggers an alert
The engine surfaces a conflict alert when one or more of these conditions is met for a given stakeholder group within a defined window:
Concentration: the cumulative volume of impact events exceeds the group’s defined absorption threshold within a rolling window.
Overlap: two or more high-intensity events from different initiatives fall within the same fortnight for the same group.
Behavioural contradiction: two initiatives are requesting opposing behaviours from the same group within the same window.
Messaging divergence: sponsor or manager communications across initiatives are flagged as inconsistent in framing or stated priority.
Capacity draw: the group is being drawn on continuously across a twelve-week or longer horizon by three or more initiatives, with no recovery gap.
Each alert is tied back to the specific initiatives causing it, the affected stakeholder group, and the window in which the conflict will manifest. The aim is to give portfolio decision-makers a signal early enough to act on, not after the fact.
How conflicts get resolved
Detection only matters if it leads to action. The engine pairs alerts with resolution options: sequencing recommendations (which initiative to slip and to when, to minimise cumulative load), absorption modelling (what the load picture would look like under each resolution scenario), and escalation triggers when the conflict cannot be resolved at the working level. Resolution is owned by the portfolio change forum, which has the authority to defer, reshape, or, where required, decline an initiative that would breach absorption thresholds. The platform does not make the call. It surfaces the trade-off in a form the executive can decide on.
Case study: detecting and resolving a four-initiative conflict
A mid-market Australian financial services organisation had four concurrent initiatives touching its branch network in Q3: a teller-system upgrade (cutover week 8), a new customer onboarding process (rollout weeks 6 and 10), a risk culture programme (manager workshops weeks 4 to 12), and an efficiency initiative (handle-time targets reset week 7). Each was governed by its own programme team. Each had reported green status. The portfolio change forum had been convened only quarterly.
When the Conflict Detection Engine ran across the live portfolio data, it surfaced four overlapping alerts on the branch-manager group within weeks 6 to 10: a concentration alert (cumulative impact intensity at 1.4x the defined ceiling), an overlap alert (system cutover and onboarding go-live within nine days), a behavioural contradiction alert (risk programme asking for slower deliberation while efficiency programme reduced handle-time targets), and a capacity draw alert (continuous manager workshop attendance across the same twelve-week window).
The resolution, agreed at a portfolio forum convened on the strength of the alerts, sequenced the onboarding rollout into Q4, paired the system cutover with a structured two-week absorption buffer, and reframed the risk and efficiency messaging into a single integrated narrative under the operating committee. None of the four initiatives missed their delivery commitments. Branch adoption of the teller-system upgrade landed twenty-one points above the organisation’s prior cutover average. The detection event paid for the entire engagement in a single intervention.
The pattern is generalisable: detection alone exposes the problem; the value is unlocked when detection feeds a forum that has the authority to act on what it sees.
Common mistakes in change conflict detection
Detection programmes fail in characteristic ways. The most common are:
Treating detection as a one-off mapping exercise. Conflict is a dynamic state. A map built once at the start of the quarter is detecting yesterday’s conflicts. Detection has to refresh continuously.
Detecting only scheduling conflicts. This handles the easiest type and misses the four that matter more. Priority, leadership messaging, behavioural, and capacity conflicts will not show up in a calendar overlay.
Letting detection sit at the change-manager level. Change managers can flag conflicts but cannot resolve priority, leadership, or capacity conflicts on their own authority. Detection without an executive forum to act on alerts is detection that goes nowhere.
Optimising each initiative’s runway over portfolio coherence. Resolution requires individual projects to accept a shape less convenient for them in exchange for a portfolio that lands as a whole. Without that trade, every alert is contested.
Detecting conflict without a capacity model. Conflict only matters relative to capacity. Without a defined model of how much change each group can absorb, every conflict argument becomes a clash of opinions about whether “this group can handle it”.
Where to start
Pick three stakeholder groups that sit at the intersection of the most initiatives in your current portfolio. Spend a fortnight mapping every initiative event, message, and behavioural request hitting each group across the next twelve weeks. Resist the temptation to act before you have the picture. Once you can see it, ask the executive sponsors of those initiatives to review it together. The conversation that follows is almost always the first time anyone in your organisation has tried to manage the portfolio rather than the projects. That conversation, repeated quarterly with a continuously-refreshed data view rather than a static map, is how change conflict detection becomes a governed capability rather than the invisible force quietly compounding adoption risk across every transformation you run.
What is change conflict detection? Change conflict detection is the discipline of identifying collisions between change initiatives before they derail delivery, by aggregating impact, behavioural, messaging, and capacity data across the portfolio against a common stakeholder taxonomy. It is distinct from project dependency tracking (which looks at deliverables) and from interpersonal conflict management (which looks at people). The unit of analysis is the impacted employee, and the goal is to surface collision early enough to resolve.
How do you manage conflicting change initiatives? Conflicting change initiatives are managed by detecting the collision early (through a continuously-refreshed portfolio view), classifying the conflict type (scheduling, priority, leadership messaging, behavioural, or capacity), and resolving it through a portfolio change forum with the authority to sequence, reshape, or decline initiatives that would breach absorption thresholds. Resolution is a portfolio governance act, not a project-level one.
What are the main types of change conflict to look for? There are five recognisable types: scheduling conflict (initiative events colliding in time), priority conflict (initiatives competing for the same top-priority slot), leadership and management messaging conflict (sponsors contradicting each other), behavioural conflict across initiatives (employees being asked to perform contradictory behaviours), and resource and capacity conflict (cumulative draw on a single stakeholder group’s absorption ceiling).
Why can’t generic AI or spreadsheets detect change conflicts? Detection requires cross-initiative organisational data, structured against a common stakeholder taxonomy, aggregated in real time. Spreadsheets age out the moment any initiative replans. Project management tools track deliverables, not employee-level impacts. Generic AI tools have no access to the organisation’s portfolio data and cannot reason about cumulative load on specific stakeholder groups. Detection is a data architecture problem, not a prompt problem.
What’s the difference between change conflict and change saturation? Change saturation is the state in which the workforce can no longer absorb additional change. Change conflict is one of the principal mechanisms that causes saturation, by drawing on the same finite resource from multiple directions at once. Saturation is the outcome; conflict is one of the causes. Detecting and resolving conflict is one of the most direct levers an organisation has for preventing saturation.
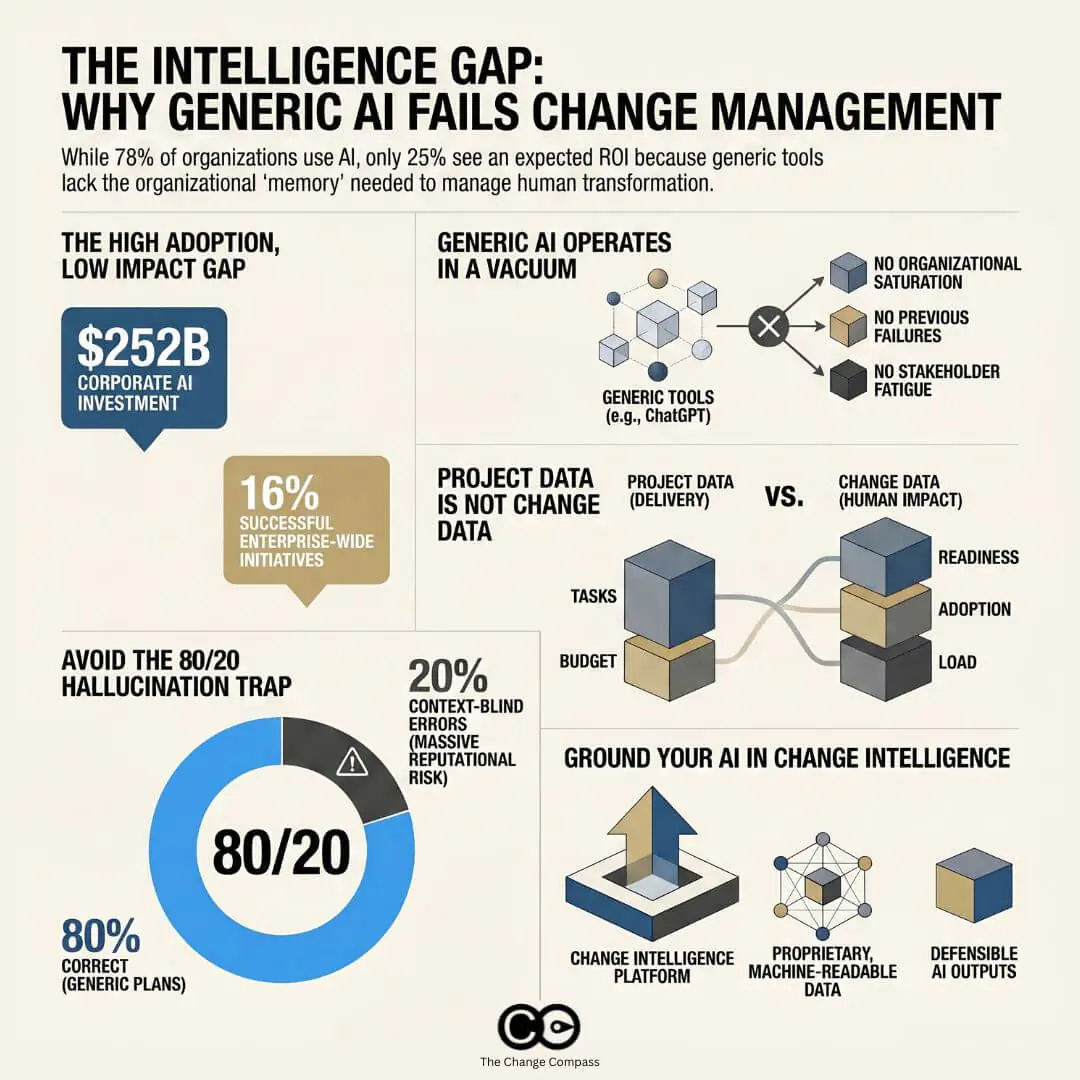
Corporate AI investment hit $252.3 billion in 2024 according to the Stanford HAI AI Index 2025, and 78% of organisations now use AI in at least one business function, up from 55% a year earlier. Yet a May 2025 IBM Institute for Business Value survey of 2,000 CEOs found that only 25% of AI initiatives have delivered the expected return, and just 16% have scaled enterprise-wide. The gap is widest in the disciplines where AI was supposed to help most, and AI for change management is among the clearest examples.
For change leaders, the symptom is familiar. Practitioners draft impact statements in ChatGPT. Project managers ask Microsoft Copilot to summarise stakeholder feedback. Sponsors paste a comms plan into Claude and ask for an executive version. The outputs look fluent, but anyone close to the work sees the same pattern: generic AI cannot reason about an organisation it does not know. It cannot weigh a new initiative against the five already in flight for the same audience. It cannot recall what happened the last time the operations team was asked to absorb a major systems change.
The conclusion most leaders are drawing is the wrong one. The constraint is not the AI model. The constraint is the absence of a system of record for change that the AI can actually reason against. An enterprise change intelligence platform is what fills that gap, and once it does, the relationship between change management and strategic outcomes shifts in a way that no productivity tool can replicate.
The AI productivity trap in change management
The first wave of AI adoption in change management has been characterised by individual practitioners using generic tools to accelerate familiar tasks. This is sensible, and at small scale it works. Drafting a stakeholder email, structuring a training outline, generating five variants of a comms message: these are bounded, low-risk uses where the cost of an inaccurate output is low.
The problem starts when leaders extrapolate from these wins. A practitioner who saves an hour drafting an email assumes the same tool will help them assess saturation across a $40 million transformation portfolio. It will not. The hour saved is a productivity gain. The portfolio question is a data problem. A separate companion guide on what AI can and cannot do in change management sets out the boundary in more detail, but the headline is straightforward: AI is strong on language tasks bounded by the prompt, and weak on reasoning that requires organisation-specific context the model has never been given.
Research by McKinsey on scaling agentic AI puts the structural issue in stark terms: eight in ten companies cite data limitations as the principal roadblock to scaling AI, and the value of large and small language models comes from the ability to train and ground them on the organisation’s own proprietary data. The same study notes that competitive advantage now flows from a small set of well-curated data products, treated as reusable, business-ready assets with clear ownership, semantics, and quality standards.
For change management, the implication is direct. If your organisation has no structured record of what initiatives are in flight, who is affected, what training has been delivered, what readiness scored, and how previous change has landed, no AI tool can reason about it. The model produces a plausible-sounding answer, drawn from generic training data, that may be confidently wrong about your specific context. The Stanford AI Index documented a 56.4% surge in AI incidents in 2024, and public trust in AI companies’ handling of personal data fell from 50% to 47% over the same period. In change management, where decisions hinge on the trust of frontline employees and the credibility of leadership messaging, an AI hallucination is not a quirky output. It is a reputational risk to the entire change function.
The project blinker: why project data is not change data
A predictable objection arises whenever change leaders raise the case for a dedicated change intelligence platform. Senior PMO leaders and programme directors push back with a version of: “we already have all of this. It is in our PPM tool, our project plans, our RAID logs, our portfolio dashboard.” The objection is sincere, and it is wrong. What looks like change data from inside a project office is project data viewed through a project planning and execution lens. The two data sets answer fundamentally different questions, and conflating them is the most common reason organisations under-invest in genuine change infrastructure.
A project plan records what the delivery team will do, by when, with what resources, and against which risks. A RAID log records the issues the project team is managing. A portfolio dashboard records the status, spend, and milestone position of each programme. All of this is necessary, and none of it tells you what is landing on a regional operations manager on the third Tuesday of November, when four systems change at once, on top of the new code of conduct module she completed two months ago, and the two leadership changes her function absorbed in the previous quarter.
Two different unit-of-analysis lenses
Project data is captured from the perspective of the delivery team. Its unit of analysis is the initiative. Its core dimensions are scope, schedule, budget, dependencies, and risks. Change data is captured from the perspective of the impacted business employee. Its unit of analysis is the human being on the receiving end of the entire portfolio. Its core dimensions are stakeholder group, impact type and severity, calendar phasing, training and engagement received, behavioural shift required, and adoption signal. Both are valid, both are needed, and one cannot substitute for the other. A perfectly green portfolio dashboard is entirely compatible with a workforce that is overloaded, disengaged, and quietly failing to adopt.
Why this matters for AI
The project blinker has a direct AI consequence. When AI is layered on top of project data and asked to reason about employee experience, capacity, or adoption risk, the answers it produces are confidently inaccurate. The model is not at fault. The data was never designed to answer those questions. Companion analysis on stakeholder impact analysis sets out the resulting blind spot in more detail, but the principle is straightforward: an AI grounded in project data will tell you a story about projects. It will not tell you a story about people, because the people-side data simply is not there.
This is why a purpose-built change intelligence platform is required even in organisations with mature PMO function and best-in-class PPM tooling. The platform exists to capture the data set the PMO was never set up to collect, and to make that data set available to grounded AI on equal footing with the project data the organisation already has.
The 80/20 trap: why partially-wrong AI recommendations are the real danger
The most commonly discussed AI risk in change management is hallucination, where a model invents a fact, a citation, or a stakeholder group that does not exist. This is the visible failure mode, and it is usually caught quickly by anyone with domain knowledge. The harder failure mode, and the one that actually derails change outcomes, is the partially-wrong recommendation.
A typical generic-AI change plan looks credible. Eighty per cent of it draws on widely accepted best practice and reads as logical advice any senior practitioner would recognise. It is the remaining ten to twenty per cent that creates the risk. Common examples drawn from change plans drafted using generic AI include:
The wrong sequencing for a specific business unit, because the model does not know what else is landing on that unit at the same time
The wrong intensity rating for a stakeholder group that has just absorbed three other initiatives in the same quarter
The wrong assumption about who the actual sponsors are, drawn from public org charts rather than the organisation’s real decision rights
The wrong training cadence for a workforce whose annual learning capacity has been fully booked since March
The wrong communication channel mix, recommended from generic best practice that does not match how this organisation’s frontline actually consumes information
These are not hallucinations. They are reasoned-looking outputs that happen to be wrong for this specific organisation, and they do not announce themselves. The 80% of the plan that is sound creates a halo of credibility around the 20% that is not. A reviewer scanning a plausible-looking document is unlikely to challenge it in a time-pressured governance forum. By the time the misstep is visible in adoption or engagement data, the plan is months into delivery and the cost of intervention has multiplied.
This is the precise problem that organisation-specific data is built to solve. When AI is grounded in the actual portfolio, the actual stakeholder load profile, the actual decision-rights register, and the actual historical adoption pattern, the partially-wrong 20% has nowhere to hide. The platform catches the inconsistency at the point of recommendation, not three months later in the engagement survey.
What an enterprise change intelligence platform actually does that ChatGPT cannot
A change intelligence platform is not a better version of ChatGPT. It is a category of enterprise software that exists upstream of any AI assistant, and it does three structural things that no generic AI tool can replicate.
A single source of truth for change
Every initiative in flight, every stakeholder group affected, every milestone date, every readiness assessment, every training record, captured against a consistent taxonomy. This is the system of record layer, and it is what allows any subsequent analysis, human or AI, to compare like with like across the portfolio rather than across spreadsheets.
Machine-readable structured data
Free-text descriptions of impact, embedded in a slide deck, are unusable to any system. Impact captured against defined categories (process, system, role, organisational structure, behaviour) and scored against a consistent scale becomes the substrate for portfolio analysis. This is the structured-data layer.
Aggregation and visualisation across the portfolio
A heatmap of cumulative change load across business units, a stakeholder fatigue index per audience group, a saturation score per division: these only exist when the system of record and the structured data are in place. They cannot be retrofitted by asking ChatGPT to summarise twelve project plans, because the underlying inputs are not comparable.
This is the foundation that The Change Compass calls a change intelligence platform, and the category exists precisely because the underlying data problem is not solvable with a chatbot. The platform is the data infrastructure that makes AI in change management actually work.
Once that foundation is in place, AI becomes useful in ways it cannot be when used in isolation. A practitioner asking the platform to generate a stakeholder impact summary is no longer relying on the model’s general knowledge. The model is grounded in the organisation’s actual impact data, its actual stakeholder taxonomy, its actual portfolio of initiatives, and its actual historical adoption outcomes. The output stops being plausible-sounding generic prose and starts being a specific, defensible synthesis of the organisation’s own data.
Why proprietary data is the missing piece for AI in change management
This pattern is not unique to change management. It is the same pattern that every enterprise function is now learning the hard way. In their five trends in AI and data science for 2025, MIT Sloan Management Review’s Thomas Davenport and Randy Bean identify retrieval-augmented generation, where an AI model is given access to proprietary documents and data to ground its responses, as the dominant pattern for enterprise AI value creation. They cite Colgate-Palmolive applying RAG to a corpus of proprietary consumer research and third-party data, allowing employees to query the entire knowledge base rather than work from individual reports.
The mechanics matter. A general-purpose language model is trained on publicly available text, which means it knows nothing about your portfolio, your stakeholder groups, your governance structures, your industry-specific compliance rules, or your historical change outcomes. Grounding the model in proprietary data is what closes that gap, and Databricks’ 2025 State of AI analysis reports that the use of vector databases supporting retrieval-augmented generation grew 377% year-on-year as enterprises caught up to this reality.
The IBM CEO Study reinforces the strategic implication. Seventy-two percent of CEOs surveyed said their organisation’s proprietary data is the key to unlocking the value of generative AI, and 68% identified an integrated enterprise-wide data architecture as critical for cross-functional collaboration. These findings are not about the change function in particular, but they apply with unusual force in change management, because the discipline depends on a richer and more diverse data set than almost any other corporate function. It needs initiative data, impact data, capacity data, adoption data, readiness data, and historical context, and it needs them in a shape that supports portfolio-level reasoning, not project-level reporting.
A change intelligence platform is the operational answer to that requirement. It is the data architecture that the IBM and McKinsey research describe, applied specifically to change. Without it, the AI tools your practitioners use are working blind. With it, the same tools can produce outputs that are specific to your organisation, grounded in your actual context, and defensible to the executives reviewing them.
From a pair of hands to a strategic enabler
The shift this unlocks is the one that matters most. For two decades, the change management function has been positioned, internally and externally, as a delivery muscle. Projects spin up, the change team is engaged late, a stakeholder analysis is produced, a comms plan is built, training is delivered, and the team is redeployed. This is the “pair of hands” model, and it is the model that most enterprise change management practices still operate under.
The combination of a change intelligence platform and grounded AI changes the operating model in four ways.
From project-level reporting to portfolio-level intelligence. When every initiative feeds the same data layer, the change function can answer questions no project team can answer. Where is cumulative load highest? Which divisions are approaching saturation? Which stakeholder groups are absorbing change from four directions at once?
From retrospective reviews to predictive analysis. Once historical adoption data, impact data, and readiness data are captured against a consistent taxonomy, the AI can identify patterns in what predicted past outcomes and forecast the trajectory of current initiatives. This is the use case McKinsey describes as competitive advantage moving to those who package data into reusable products.
From reactive sequencing to deliberate scheduling. A grounded AI can model what happens if a new initiative goes live in Q3 vs Q4 against the existing portfolio, and surface the stakeholder groups most likely to be overloaded. The change function moves from being asked to “make this work” to advising governance on what to prioritise.
From advisory voice to evidence-based authority. A recommendation backed by portfolio data, historical evidence, and stakeholder load modelling carries different weight in an executive committee than a recommendation backed by practitioner judgement alone. Strategic projects you might previously have lost the argument on become defensible on the data.
This is what research by the Project Management Institute, in its 2025 Pulse of the Profession report, describes as the shift from operational delivery to strategic value creation. PMI found that organisations whose project professionals demonstrate high business acumen achieve a 72% success rate in meeting business goals, compared with 65% for those who do not, and that the top performers consistently invested in benefits realisation management maturity and adaptability to changing conditions. The change function, properly equipped, sits squarely in this same value creation space. Without the data layer to support it, the function will continue to be positioned as a delivery cost. With it, the function becomes one of the organisation’s primary strategic levers.
How this de-risks the business and protects performance
The strategic case for an enterprise change intelligence platform is also a risk argument. Most large organisations now run between fifteen and forty concurrent change initiatives at any given time, and a meaningful proportion of those initiatives target the same stakeholder groups. When initiatives compete for the same audience without coordination, the consequences are predictable and measurable. Adoption drops. Productivity sags during the transition. Engagement scores fall. Discretionary effort declines. Attrition rises in the most affected teams. The combined effect is a meaningful drag on the business case for every initiative in the cluster.
Trust as the foundation of AI-enabled change
Accenture’s Technology Vision 2025 frames the broader risk picture in a useful way. The report argues that enterprises are building what it calls “cognitive digital brains” by hard-coding workflows, institutional knowledge, value chains, and social interactions into systems that can reason and act with autonomy. The report notes that 77% of executives believe the true benefits of AI can only be unlocked when systems are built on a foundation of trust, and that trust is now the most important measure of an AI system’s viability.
In change management, the foundation of trust is the data layer. An enterprise change intelligence platform makes the underlying assumptions visible, the impact data auditable, and the adoption outcomes traceable. When AI is added on top of that foundation, its recommendations are explainable. When AI is bolted onto an organisation with no system of record, its recommendations are guesses, and the change function carries the reputational risk for every one that turns out to be wrong.
Early warning, not post-mortem
The downstream effect on strategic outcomes is direct. Strategic initiatives are typically the ones with the highest stakes, the most ambitious benefits cases, and the tightest interdependencies. They are also the ones most exposed to the risk of cumulative change load. An organisation that cannot see, in advance, that its top three strategic initiatives all land on the same audience in the same quarter has no early warning system. The first signal arrives in the adoption numbers, by which point the cost of intervention is materially higher than the cost of resequencing.
A change intelligence platform with grounded AI gives leadership that early warning. It is the difference between learning your operating model transformation failed because the relationship managers were drowning, and learning, three months earlier, that the relationship managers were going to be drowning unless something gave. The first is a post-mortem. The second is a governance decision.
Where Change Compass fits
Change Compass is the enterprise change intelligence platform built specifically for this use case. The platform captures every initiative in flight against a consistent change taxonomy, structures impact and stakeholder data so it is machine-readable, and aggregates the result into portfolio-level views including saturation heatmaps, stakeholder fatigue indices, and adoption forecasts. Its AI capabilities are grounded in the customer’s own data and benchmark data from across the platform’s enterprise client base, which means the recommendations a practitioner receives are specific to their organisation’s situation rather than drawn from generic training data. For organisations evaluating whether to invest in a change platform, the companion guide on enterprise change management software walks through the features that distinguish an enterprise-grade platform from a project tool.
For change leaders who have already begun experimenting with generic AI tools, the more useful framing is that the platform is what makes those experiments worth running at scale. Without it, even the best AI is operating on guesswork. With it, the same AI becomes a strategic instrument for the function.
Making the shift
The practical starting point is not a procurement exercise. It is a diagnostic. The questions worth answering, before any tool decision is made, are these.
Can you produce, today, a single view of every change initiative in flight across the organisation, with consistent impact data and stakeholder mapping?
Can you tell the executive sponsor of a new initiative which other initiatives are landing on the same audience, in the same quarter, at what cumulative load?
Do you have a record of how previous change has landed in each business unit that an AI tool, or a human analyst, could reason against?
Do your AI experiments in change management currently produce outputs that are specific to your organisation, or generic outputs that have been lightly contextualised?
If the answer to any of these is no, the gap is the data layer, not the AI model. An enterprise change intelligence platform is the structural fix. The first wave of AI in change management was about productivity. The second wave, and the one that distinguishes organisations that achieve their strategic goals from those that do not, will be about intelligence. And intelligence requires a system of record, structured data, and an architecture that allows AI to do what generic tools can never do alone: reason about the specific organisation it is operating in.
The change function that gets this right stops being a delivery cost and starts being a strategic enabler. That is the shift the next five years of transformation work will reward.
What is an enterprise change intelligence platform?
An enterprise change intelligence platform is a system of record for organisational change that captures every initiative, stakeholder group, impact assessment, and adoption metric against a consistent taxonomy, then uses that structured data to provide portfolio-level intelligence. It is distinct from a project-level change tool because it operates across the entire transformation portfolio, and it is the data foundation that makes AI in change management produce defensible, organisation-specific outputs rather than generic ones.
Why is generic AI like ChatGPT or Microsoft Copilot insufficient for enterprise change management?
Generic AI tools are trained on publicly available data and have no access to an organisation’s specific initiatives, stakeholder groups, historical change outcomes, or cumulative load profile. They can produce plausible-sounding generic text, but they cannot reason about a specific portfolio. For tasks where the value depends on organisation-specific context, such as saturation analysis, stakeholder load modelling, and adoption forecasting, the outputs are unreliable without a grounding data layer.
How does an enterprise change platform improve strategic outcomes?
It does so by giving leadership early visibility of portfolio-level risk before that risk turns up in the adoption numbers. When every initiative is captured against the same taxonomy, the platform can surface cumulative impact on stakeholder groups, model the effect of sequencing decisions, and forecast adoption outcomes. That early warning capability is what allows governance to resequence, pause, or resource initiatives before they fail rather than after.
What is the role of AI in a change intelligence platform?
AI in a properly architected change intelligence platform is grounded in the organisation’s own data, not in generic training corpora. It can summarise stakeholder load, surface convergence patterns across initiatives, draft initiative-specific impact narratives, and forecast adoption based on the organisation’s own historical outcomes. The grounding is what makes the AI usable as a strategic instrument rather than a productivity gadget.
How is this different from just using an AI tool with a custom prompt?
A custom prompt is a thin layer on top of a generic model. It can shape tone and structure, but it cannot give the model access to the organisation’s data. A change intelligence platform provides the structured data layer that an AI model can reason against in real time, using retrieval-augmented generation or equivalent techniques. The difference is the difference between a model that sounds informed and a model that is informed.
A change capacity model is a structured framework that defines and measures how much change a specific business unit, team or stakeholder group can absorb effectively at any given time, before performance and adoption start to degrade. It treats capacity as a multi-dimensional construct rather than a single number, capturing operational bandwidth (workload, time, attention), psychological readiness (sentiment, trust, fatigue), capability (skills and prior change experience), and leadership availability. A working capacity model is dynamic. It is updated continuously as initiatives complete, new programmes launch, or stakeholder conditions shift, and it informs sequencing and sponsorship decisions at the portfolio level.
A July 2025 Gartner study found that only 32% of business leaders report achieving healthy change adoption by employees. The research defines healthy adoption not just as compliance, but as employees acting on change, doing so on time, and without undue stress or disengagement. On that measure, two thirds of organisations are failing.
The most common diagnosis is that the individual change programmes were too complex, too poorly sponsored, or too poorly communicated. That diagnosis is sometimes right. But the more systemic explanation is something else entirely: organisations simply do not know how much change their workforce can absorb. They have a clear view of what they are demanding: the change portfolio. They have almost no structured view of what each part of the business can supply.
A change capacity model addresses the supply side. It is a structured, multi-dimensional assessment of each business unit or stakeholder group’s current ability to absorb change effectively. It tells you, before you commit to a launch date or a sequencing plan, which parts of your organisation are genuinely ready to receive more change and which are already at or past their threshold.
This article explains what a change capacity model is, how to build one, and how to use it to make sequencing and prioritisation decisions that reflect what your organisation can actually handle.
Why “capacity” needs a better definition
When change leaders talk about capacity, they usually mean one of two things: time or morale. Is this team’s calendar full? Are they tired? These are reasonable questions, but they are inadequate as a basis for a portfolio-level decision.
Capacity is not a single variable. A team can have ample time in their calendars and still lack the psychological readiness to engage with another round of change. A team can have high morale and healthy engagement scores and still lack the technical experience to adopt a specific type of technology change without significant support. A team can have all of the above and still be constrained by a management layer that is already carrying three times the typical change-leadership load.
The research makes the point clearly. According to Gartner’s 2025 analysis of change adoption, workers with high trust in their organisation have a capacity for change that is 2.6 times greater than those with low trust, and employees in teams with strong cohesion have 1.8 times the change capacity of those in fragmented teams. Neither of these factors appears in a bandwidth assessment. Neither of them appears in an engagement survey cut by average scores. They are distinct dimensions of capacity that require deliberate measurement.
A robust change capacity model treats capacity as a multi-dimensional construct, assesses it by stakeholder group rather than by initiative, and tracks it over time rather than treating it as a fixed condition.
It is also worth clarifying what a capacity model is not. It is not a change saturation measurement, which tracks how much change is currently being demanded of each group. Saturation measurement answers the demand side of the equation: what is being placed on people. Capacity modelling answers the supply side: what people can absorb. The two should be read together, but they are built differently and capture different things. If you are new to the saturation concept, What is change saturation? provides a full foundation before building the capacity model alongside it.
What a change capacity model includes
A complete change capacity model has three components:
A capacity taxonomy: a defined set of dimensions along which capacity is assessed, consistently applied across all groups in the portfolio.
A group-level assessment: a scored profile for each business unit or stakeholder group across those dimensions, produced through a combination of data inputs.
A portfolio-level map: an aggregated view that allows you to compare capacity across groups, identify constraints, and integrate capacity data into your sequencing and governance decisions.
The model should be designed to be maintained over time, not just completed once. Change capacity is dynamic. It degrades under sustained load, recovers once significant initiatives complete, and can be deliberately built through targeted intervention. A model that is only run at the start of a financial year will be misleading by the second quarter.
The four dimensions of change capacity
The core of any capacity model is its taxonomy of dimensions. What follows is a four-dimension framework that covers the factors consistently shown to predict change absorption at the group level. Organisations should adapt the specific inputs and scoring criteria to their context, but the four categories represent the minimum viable model.
Absorptive capacity: psychological and emotional readiness
Absorptive capacity reflects the degree to which a group is psychologically prepared to receive and engage with change. It is shaped by recent history more than by current intent: how previous changes landed, how much adoption debt remains unresolved, and how much trust exists in the change process itself.
Key factors include:
The outcome quality of recent changes: did the last programme actually deliver what was promised? Groups that have experienced repeated change that underdelivered have lower absorptive capacity for the next wave, regardless of how good that next programme is.
Adoption debt: the volume of incomplete adoption from previous initiatives that a group is still carrying. A team still operating workarounds from a system implementation six months ago has effectively not finished that change, even if the project has been closed. The 10 signs of change overload are often the visible symptoms of exactly this condition: groups carrying adoption debt from previous programmes that compromises their absorptive capacity for the next one.
Trust in leadership and in the change process. Gartner’s research found that 79% of employees have low trust in change. In organisations where this is the predominant sentiment, absorptive capacity is structurally constrained regardless of what the current BAU workload looks like.
Operational capacity: bandwidth available for change activity
Operational capacity is the dimension most organisations measure, and the one they over-index on. It is the time and bandwidth available for change-related activity: attending training, participating in pilots, adjusting to new processes, and absorbing the productivity dip that accompanies any significant transition.
Factors to assess include:
Current BAU workload and whether peak operational periods coincide with planned change activity
Active project and programme commitments beyond the change portfolio, including IT delivery work, regulatory deadlines, and business development activity
Span of management control: managers with broader spans have less time per direct report to invest in change support, which research published in PMC links to higher work-related stress and reduced leadership effectiveness during organisational transitions
Prior unplanned workload demands: business units experiencing performance pressure, customer escalations, or operational incidents are operating with reduced bandwidth for anything outside the critical path
Operational capacity is the dimension most likely to be seasonal and volatile. A business unit that has high operational capacity in February may have near-zero capacity in September if that is their peak period. The model must capture this temporal dimension, not just a point-in-time snapshot.
Capability capacity: skills and experience for this type of change
Capability capacity is the degree to which a group has the existing skills, knowledge, and change experience required to adopt the specific type of change being asked of them. This dimension is change-type dependent: the capability profile that matters for a technology transformation is different from the one that matters for a process redesign or a structural reorganisation.
The most useful indicators are:
Prior experience with this category of change. A team that has successfully adopted two previous CRM implementations has demonstrably higher capability capacity for a third than a team approaching it for the first time, even if both have identical bandwidth.
Change management maturity at the group level: the degree to which a group has developed consistent habits for navigating transitions, including strong adoption of learning and development programmes and a track record of embedding new ways of working.
Digital literacy, where technology change is the primary change type in the current portfolio.
Learning velocity from historical data: how quickly this group completed adoption milestones in comparable previous programmes.
Organisations that track adoption data at the initiative level over time are well-positioned to build this dimension. Those that do not have it in structured form can use calibrated manager assessments as a proxy.
Leadership capacity: manager and sponsor bandwidth
Gartner has noted that managers often lack the capacity to serve as the sole champions for change in their teams, and that expecting them to sell the change, model new behaviours, and simultaneously create safe space for their people frequently produces manager fatigue before the programme has even reached its most demanding phase. Leadership capacity is the dimension most consistently overlooked, and often the binding constraint on the entire model.
Leadership capacity includes:
The number of current change initiatives requiring active management-layer support: briefing, cascade, coaching, and problem-solving. Each initiative that requires a manager to actively champion change is a draw on a finite pool of leadership attention.
Manager change management competency: the skill level of the frontline management layer in facilitating transitions, having change conversations, and sustaining momentum without top-down pressure.
Sponsor quality and availability in the relevant business unit: whether the accountable executive sponsor has genuine commitment and time to discharge their sponsorship obligations.
Whether the leadership layer itself is subject to change (a restructure, leadership rotation, or change in reporting lines) concurrent with the change programme. A management layer in transition has significantly reduced capacity to lead change for the teams below it.
How to score capacity across your organisation
Turning the four-dimension framework into a usable model requires a scoring structure that is consistent, calibrated, and practical to maintain. The following process is designed to work with the data most organisations already have, without requiring a dedicated analytics infrastructure to get started.
Step 1: Define your group taxonomy. Use the same stakeholder group or business unit classifications as your change impact assessments and saturation model. Consistency across models is essential: the value of a capacity model is that it can be read alongside your demand data. If your groups are defined differently across tools, the integration breaks down.
Step 2: Score each group on each dimension. Use a three-point or five-point scale per dimension, with defined criteria for each score level. Three-point scales (high, medium, low capacity) are easier to calibrate and maintain; five-point scales allow for more granularity once the model matures. The scoring process should draw on multiple data sources:
Pulse survey data for absorptive capacity
Project and workload data for operational capacity
Adoption history and HR learning data for capability capacity
Manager assessment and initiative load data for leadership capacity
Step 3: Build your Composite Capacity Index. Aggregate the four dimension scores for each group into a single index. At first pass, equal weighting across dimensions is reasonable. More sophisticated models apply weights based on the change type: a technology-heavy portfolio should weight capability capacity more heavily; a structural reorganisation should weight absorptive and leadership capacity more heavily.
Step 4: Create your portfolio capacity map. Visualise the capacity profile of all groups together. This is your baseline: the supply-side view of your portfolio. It tells you where capacity is strong (groups that can absorb additional change without significant risk), where it is constrained (groups approaching their limit), and where it is depleted (groups that should not be the target of new significant change without deliberate remediation).
Step 5: Establish a refresh cadence. Quarterly is the minimum. After every major programme milestone, update the capacity data for affected groups: absorptive capacity changes when an initiative lands well or badly; operational capacity changes as workload peaks and troughs; leadership capacity changes when sponsors rotate or managers leave.
Integrating capacity data into sequencing decisions
The capacity model pays for itself when it changes the sequencing and timing decisions that shape your change portfolio. Three specific applications are worth building into your governance process.
Pre-commitment capacity checks
Before any new initiative is added to the portfolio and a go-live date committed to leadership, run a capacity check for every affected group. Which dimensions are currently constrained? Does the timing align with a high-capacity period or a low-capacity one? What capacity recovery is expected from changes currently in flight? This is a governance question, not just a change management question: it belongs in the portfolio approval process, not as a post-decision consideration.
Capacity recovery planning
When a major initiative completes, the affected groups do not immediately return to full capacity. Absorptive capacity in particular requires recovery time: the period in which new ways of working are consolidated, adoption debt is resolved, and the psychological overhead of sustained change decreases. Building deliberate recovery windows into the portfolio calendar (protected periods during which no new significant change is initiated against high-load groups) is not a concession to slowness. It is the mechanism by which adoption quality is preserved across the portfolio cycle.
Targeted capacity-building investment
The model identifies structural capacity constraints that cannot be resolved by better sequencing alone. A business unit with consistently low leadership capacity may need a manager development investment. A group with persistently low absorptive capacity may need a reset period combined with visible delivery on past change commitments before it can receive new programmes effectively. These interventions belong in the capability-building plan of the change function, resourced and scheduled like any other programme investment.
Five mistakes to avoid when building a change capacity model
Treating capacity as a single variable. If your model produces a single “capacity score” that is effectively a composite of time and morale, it will mislead. The four-dimension structure exists because each dimension can move independently. A group can be high on operational capacity and low on absorptive capacity at the same time, and conflating the two produces a score that suggests readiness when the reality is more complex.
Building the model once and not maintaining it. A capacity assessment that is run at the beginning of a financial year and not updated is a liability rather than an asset. By the third quarter, the picture has moved significantly. The model must be maintained on a defined cadence, with the discipline to update it after significant programme milestones.
Relying only on survey data. Surveys are an important input, but they capture sentiment rather than structural capacity. Operational capacity, capability capacity, and leadership capacity all have better signals in project data, adoption history, and manager workload data. Build a multi-source model from the start.
Ignoring the leadership capacity dimension. This is the most frequent omission. Organisations that map employee capacity in detail but treat manager capacity as unlimited will consistently underestimate the true constraint on adoption. The management layer is typically the bottleneck: it is where change communication is supposed to cascade, where adoption support happens, and where resistance is first encountered and either addressed or amplified.
Building the model in isolation from demand data. Capacity on its own is not actionable. A group with medium capacity and low change demand has no problem. A group with medium capacity and very high demand is in active risk territory. The capacity model is most powerful when read alongside your change saturation measurement: supply against demand, at the group level, tracked over time.
How digital tools support change capacity modelling
Maintaining a change capacity model manually, across multiple groups, multiple dimensions, and quarterly update cycles, is feasible for smaller organisations but becomes increasingly difficult as portfolio size grows. The model depends on data from multiple sources (pulse surveys, project registers, adoption tracking, HR data), and integrating those sources manually introduces both effort and lag.
Digital change management platforms such as Change Compass are designed to support exactly this kind of portfolio-level intelligence. Rather than building capacity data separately from initiative data, a purpose-built platform integrates both: initiative volume and impact data sits alongside capacity inputs, enabling a live view of where demand is running ahead of supply across the organisation. When capacity data is updated (after a programme completes, after a pulse survey cycle, or after a manager assessment) the platform refreshes the portfolio picture in real time, rather than requiring a manual rebuild of the model.
From capacity snapshot to portfolio governance
The goal of a change capacity model is not to produce an interesting dashboard. It is to change the questions your leadership and portfolio governance teams are asking before they approve new change commitments. Instead of “is this initiative ready to launch?” the question becomes: “is the receiving organisation ready to adopt it?”
That shift is significant. It moves the accountability for change success upstream, into the portfolio decisions that shape the timing and sequencing of change, rather than leaving the change management function to manage the consequences of decisions already made. It also creates a shared, data-based language for conversations that have traditionally been difficult: the conversation about deferring a launch, protecting a business unit, or reducing the simultaneous change load on a particular team.
Start with the data you have. Score the four dimensions using proxy measures where better data does not yet exist. Build the model for your highest-priority groups first, then expand. The first iteration does not need to be precise to be valuable. It needs to be consistent and maintained, and it needs to be read alongside your change demand data, not in isolation.
The organisations in the 32% that achieve healthy change adoption by their employees have typically not found a better communications strategy or a better sponsor. They have built a systematic view of what their workforce can absorb, and they have used that view to make different decisions about what to ask of them and when.
Frequently asked questions
What is a change capacity model?
A change capacity model is a structured assessment of a business unit or stakeholder group’s ability to absorb change at a given point in time. It typically covers multiple dimensions: psychological readiness, operational bandwidth, change-relevant skills, and leadership capacity. It is tracked over time to inform portfolio sequencing and governance decisions.
How is change capacity different from change saturation?
Change saturation measures the demand side: how much change is currently being placed on a group relative to their ability to absorb it. A capacity model measures the supply side: what the group is inherently able to absorb given their current psychological state, workload, capability level, and leadership support. The two should be read together, but they are built and maintained differently.
How often should a change capacity model be updated?
Quarterly is the recommended minimum. In addition, the model should be updated after any significant programme milestone: particularly when a major initiative completes, a leadership change occurs in a key business unit, or a pulse survey reveals a significant shift in sentiment. Capacity is dynamic; a model that is only updated annually will mislead more than it guides.
What data do you need to build a change capacity model?
A basic model can be built with: pulse survey data (for absorptive capacity), project and workload data (for operational capacity), historical adoption data (for capability capacity), and manager assessments (for leadership capacity). Organisations that do not have all of these in structured form can start with calibrated manager input across all four dimensions and layer in more granular data as the model matures.
How do you use a capacity model to make sequencing decisions?
The most direct application is a pre-commitment capacity check: before adding a new initiative to the portfolio, reviewing the capacity profile of every group the initiative will affect and assessing whether the planned timing aligns with a high-capacity period. The model also supports capacity recovery planning (building in protected windows after high-load periods) and identifying groups that need targeted capacity-building investment before they can receive additional change effectively.